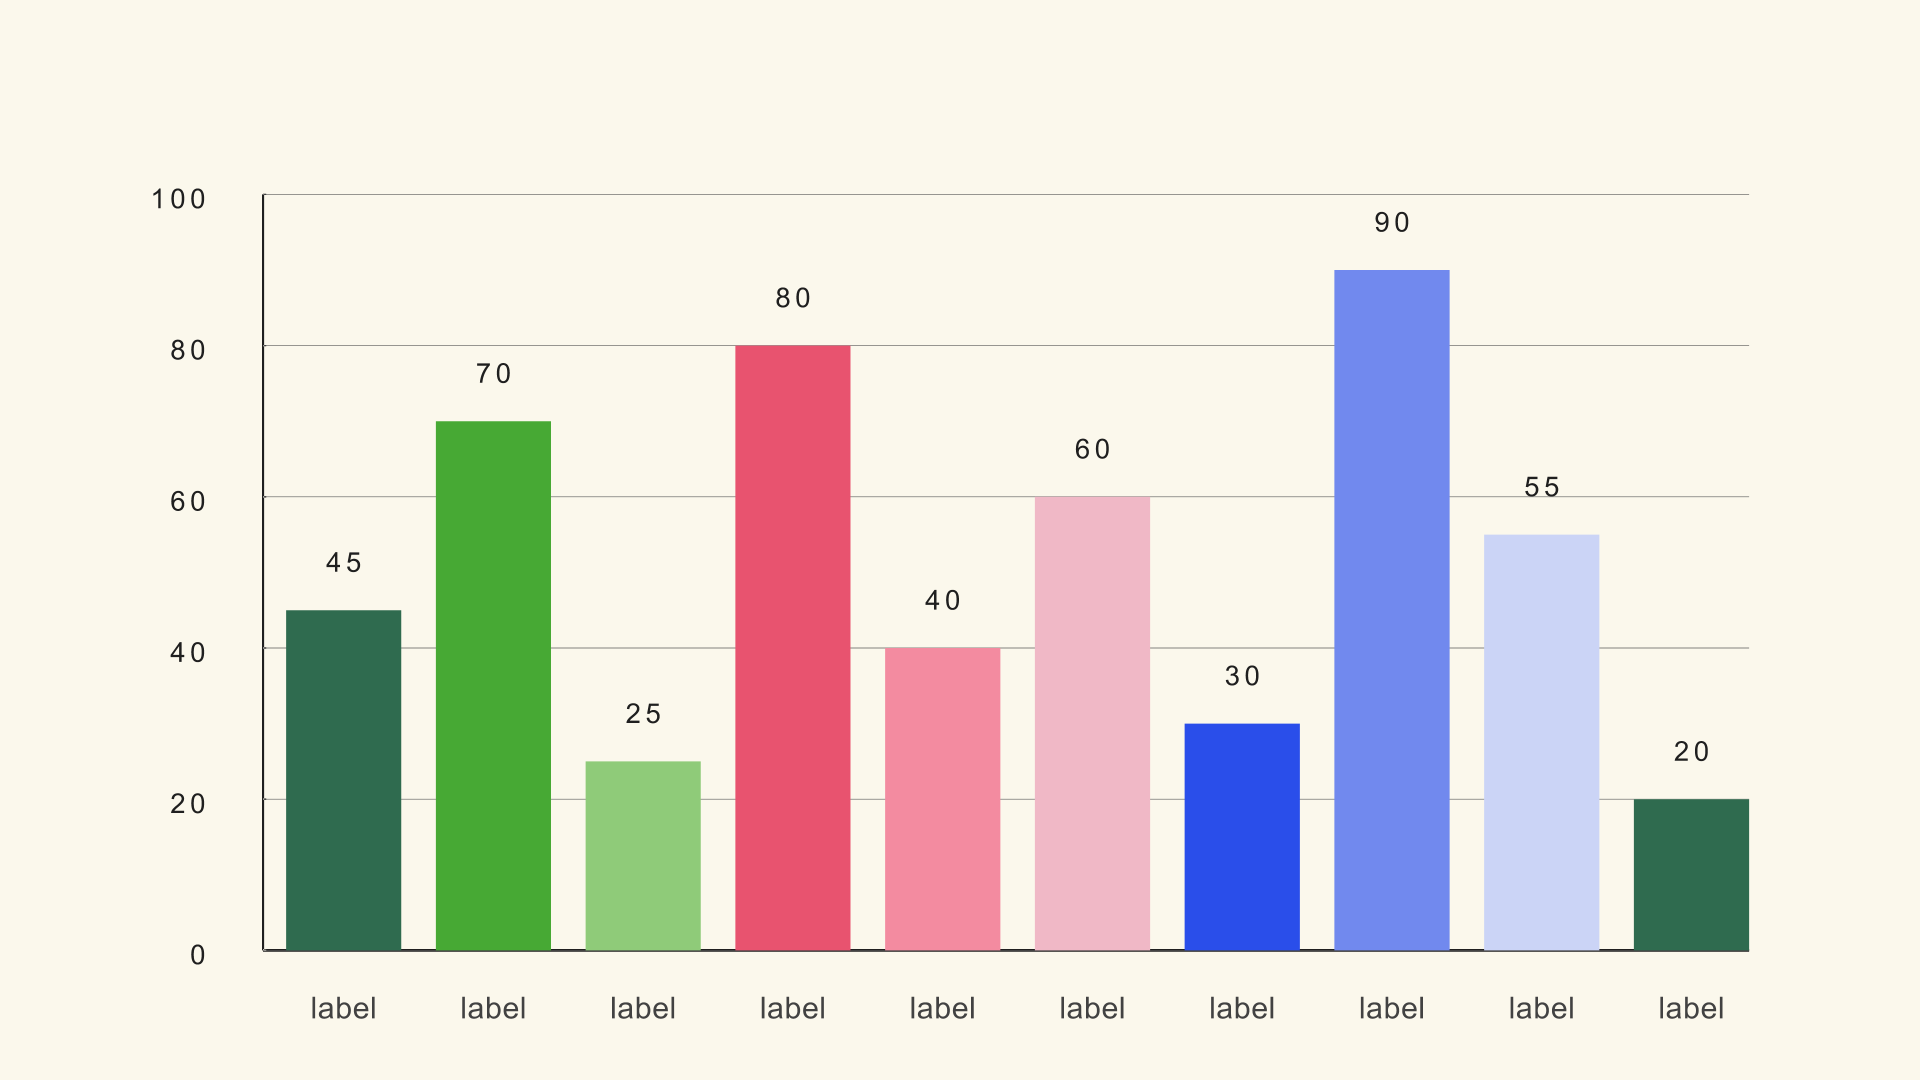
Tutorials6 min read
How to Make Charts and Graphs in DaVinci Resolve
The practical path from a spreadsheet to a finished, editable chart on a DaVinci Resolve timeline, using native Fusion generators instead of a second app.
Noyris Charts Team
Noyris Journal
Field notes from the people building the pack: practical workflows, CSV formats that actually load, and the settings that make a chart read on screen. No theory for its own sake.
Latest update
November 3, 2026
22 field-tested articles · tested on Resolve 18-21.
The practical path from a spreadsheet to a finished, editable chart on a DaVinci Resolve timeline, using native Fusion generators instead of a second app.
Noyris Charts Team
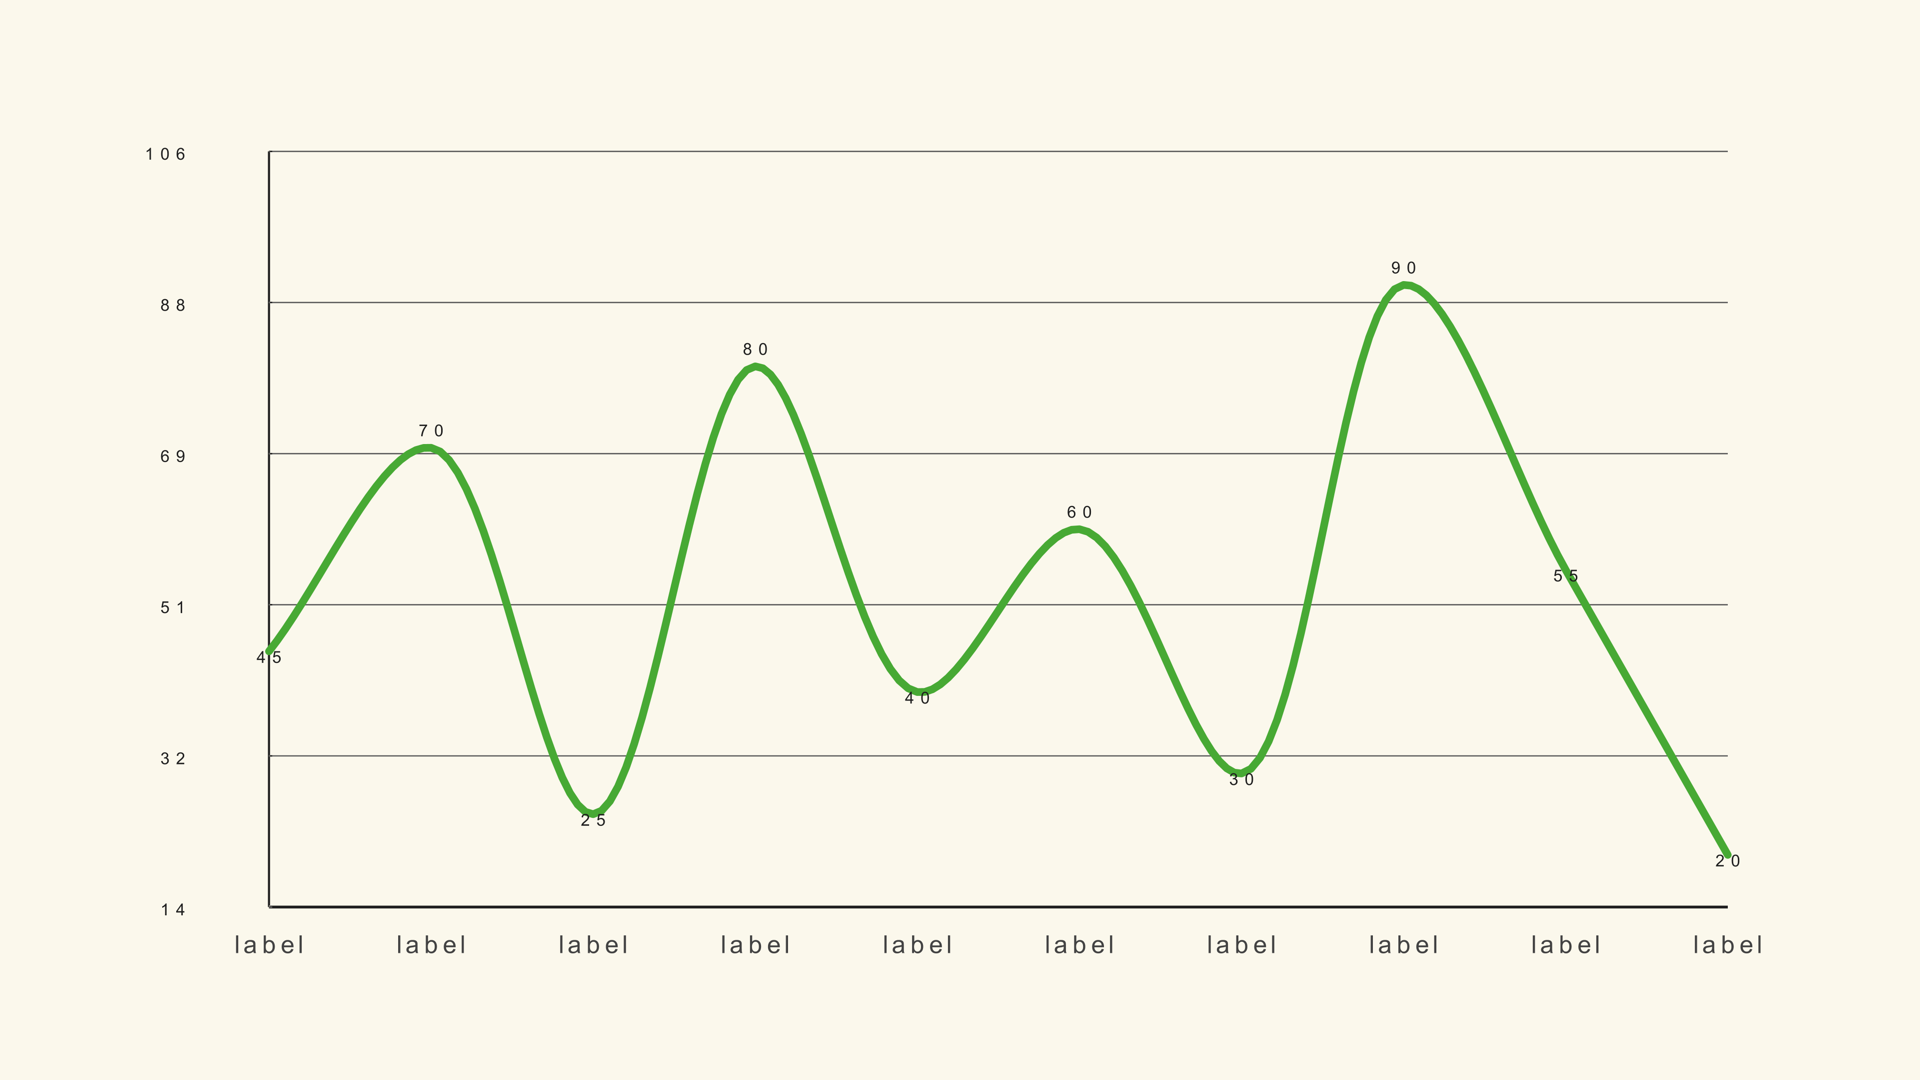
A practical timing guide for chart animation in Resolve, from the first grow-in to the easing and stagger settings that keep a chart readable.
Noyris Charts Team
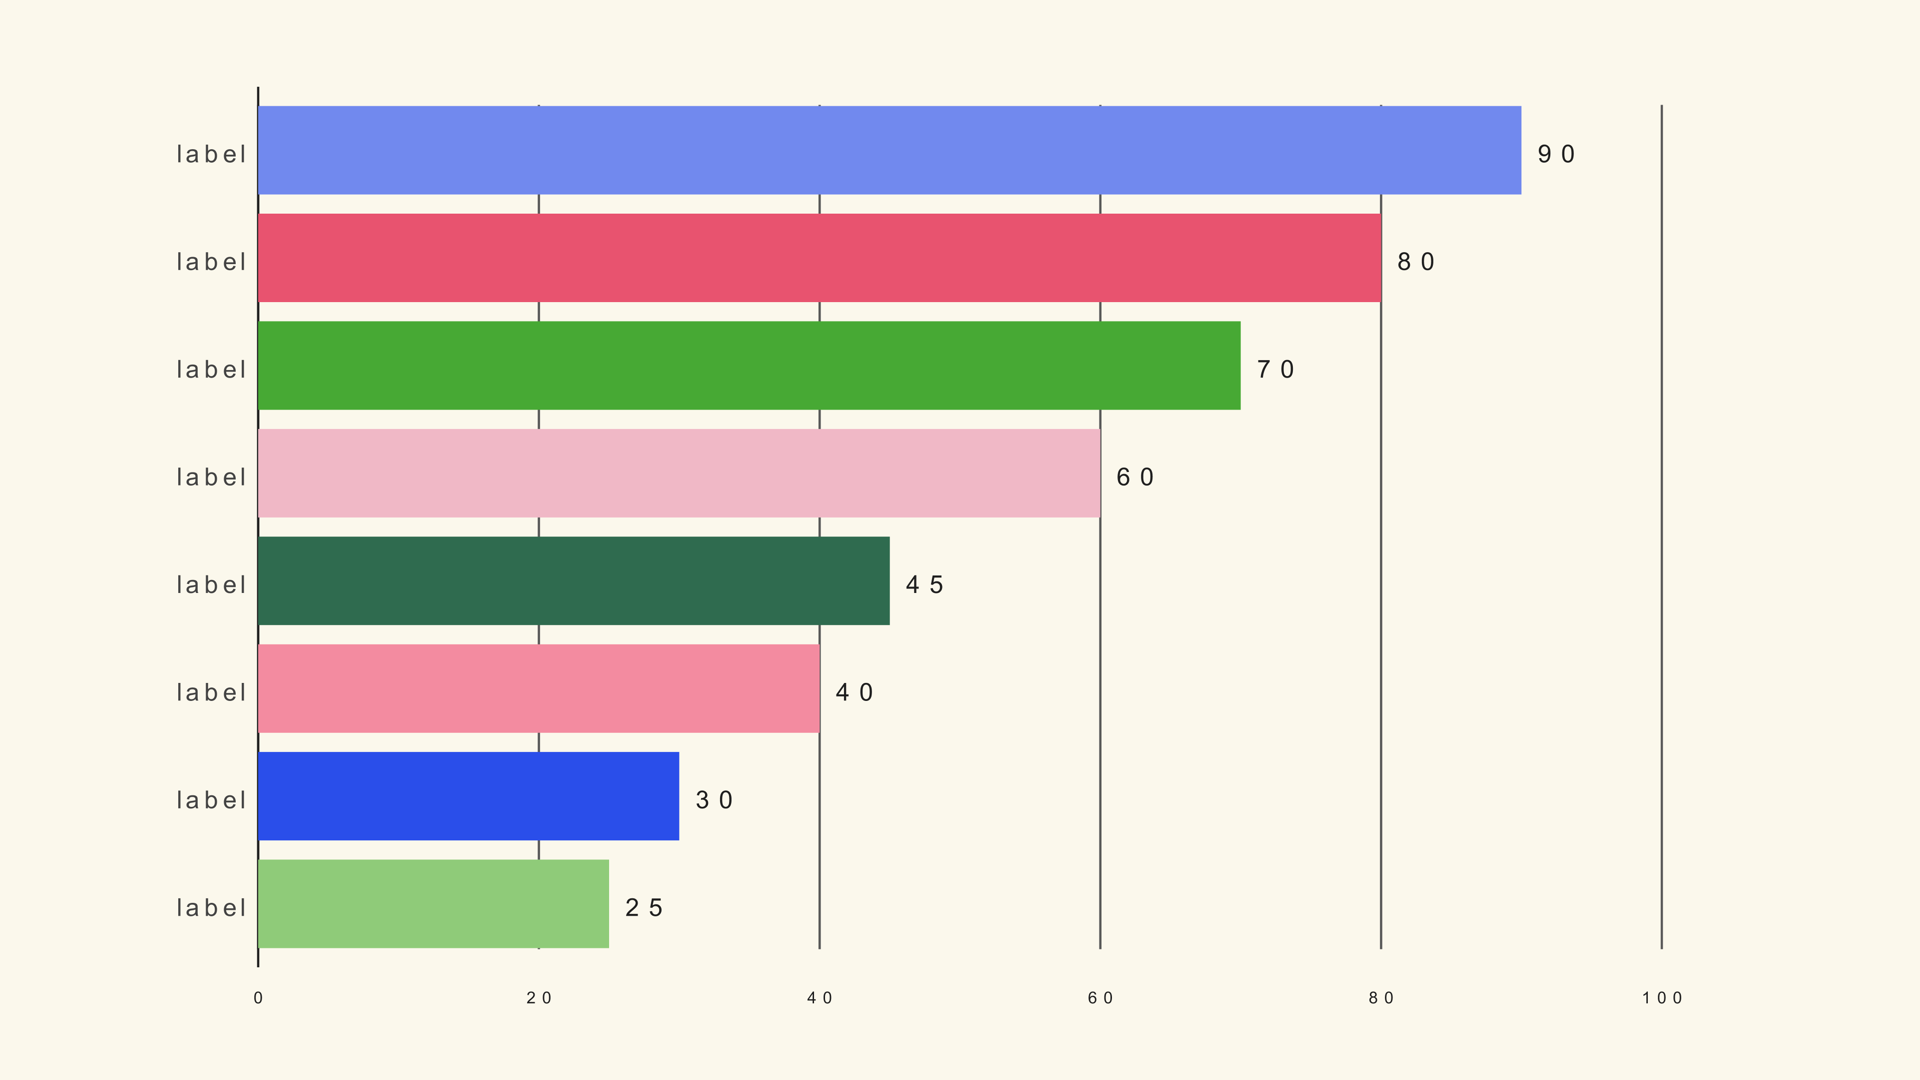
A complete bar chart race workflow for Resolve: the wide CSV shape, ranking controls, scale rules, motion timing and the mistakes that break the race.
Noyris Charts Team
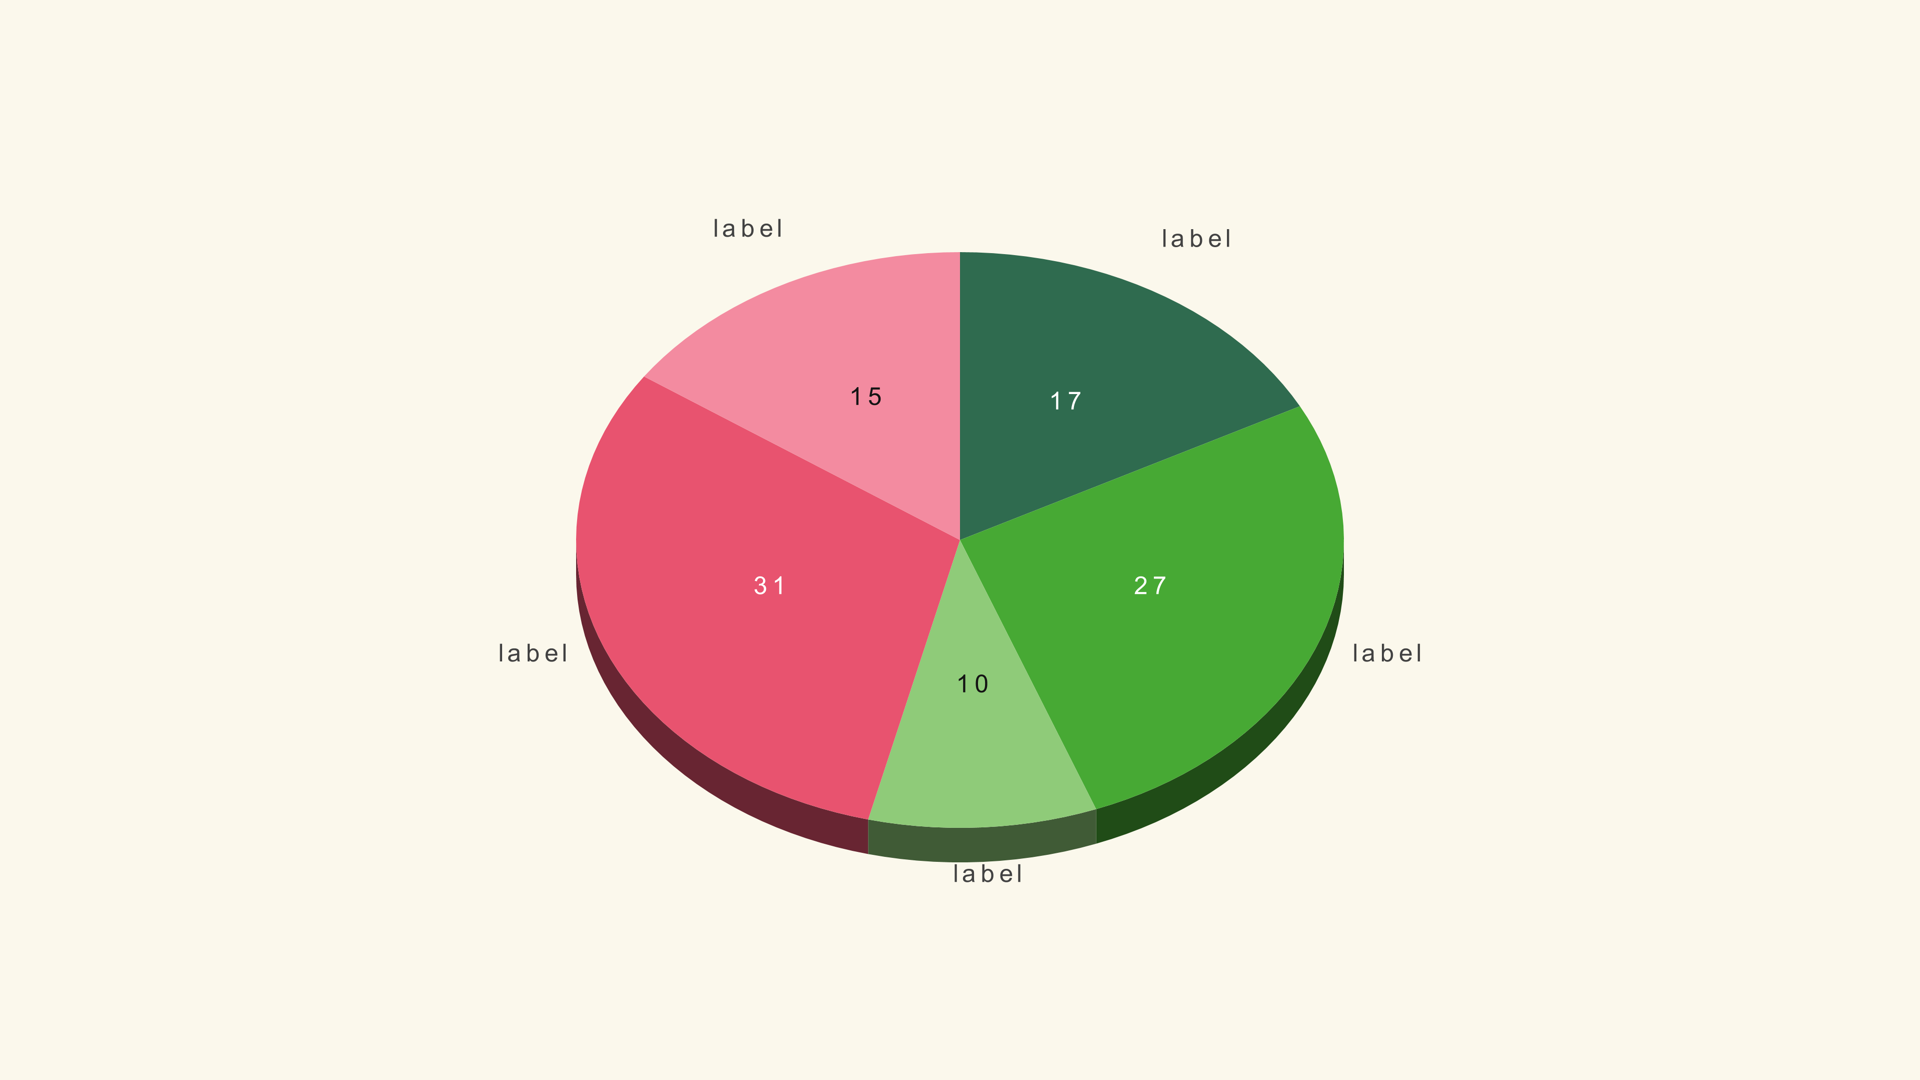
A practical buying guide for Resolve chart templates, with the questions that separate a useful generator from a folder of uneditable animations.
Noyris Charts Team
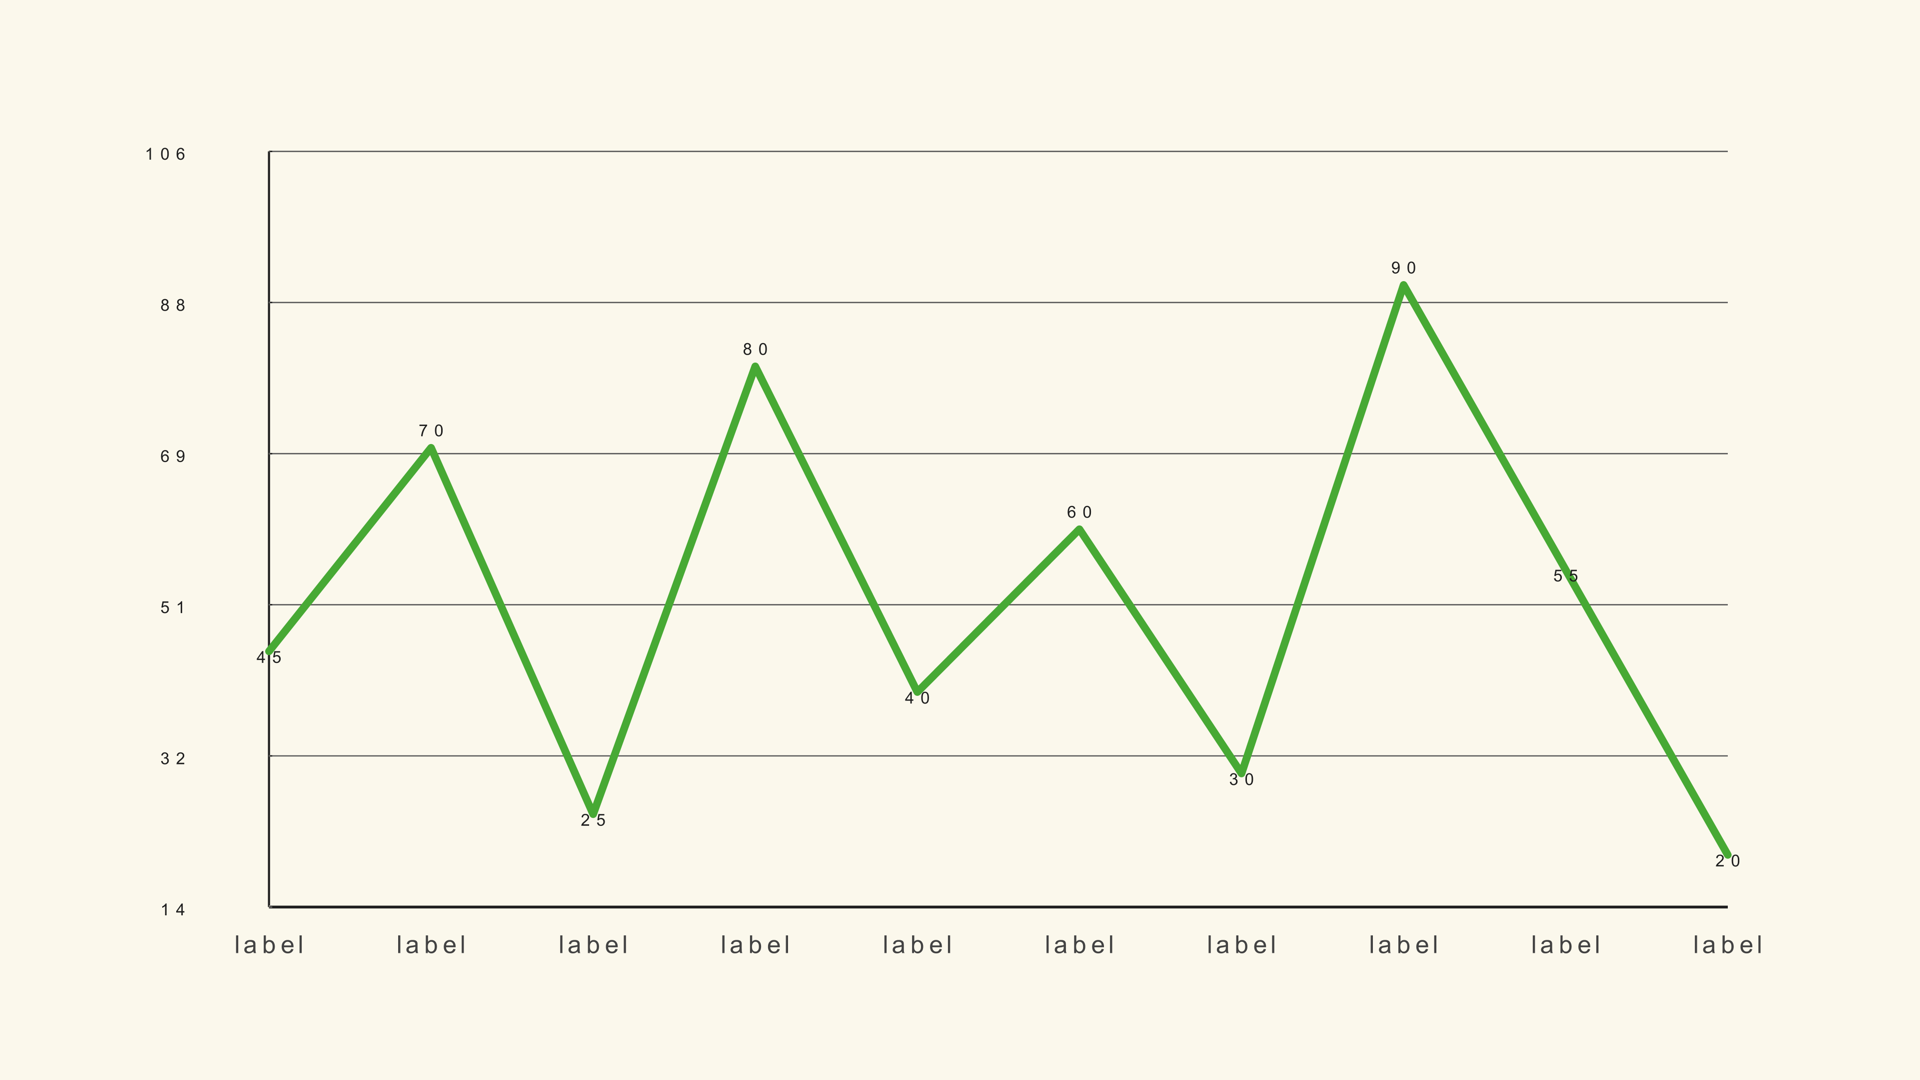
A step-by-step line graph workflow for Resolve, including the Fit to Data setting that keeps narrow trends from flattening into a straight line.
Noyris Charts Team
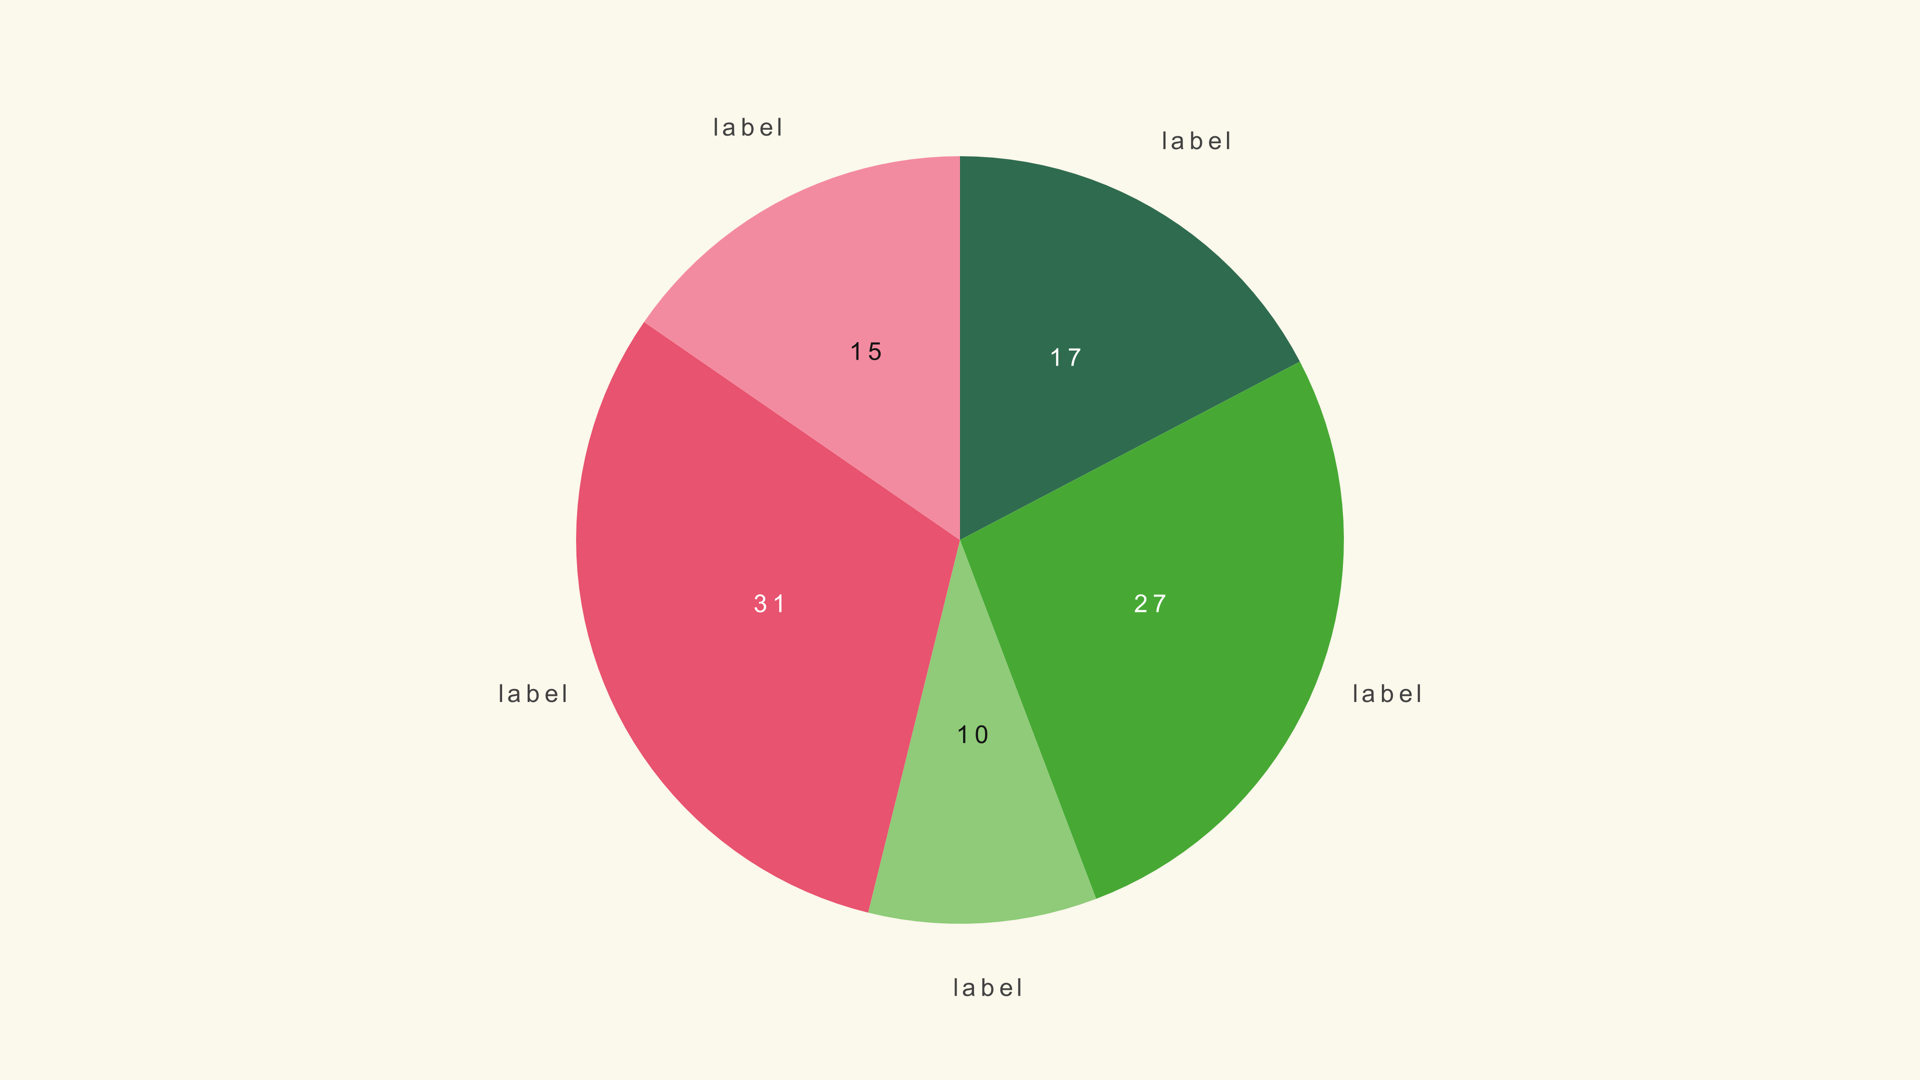
A practical pie chart workflow for Resolve, including when a pie is the wrong choice and how to keep the labels readable on video.
Noyris Charts Team
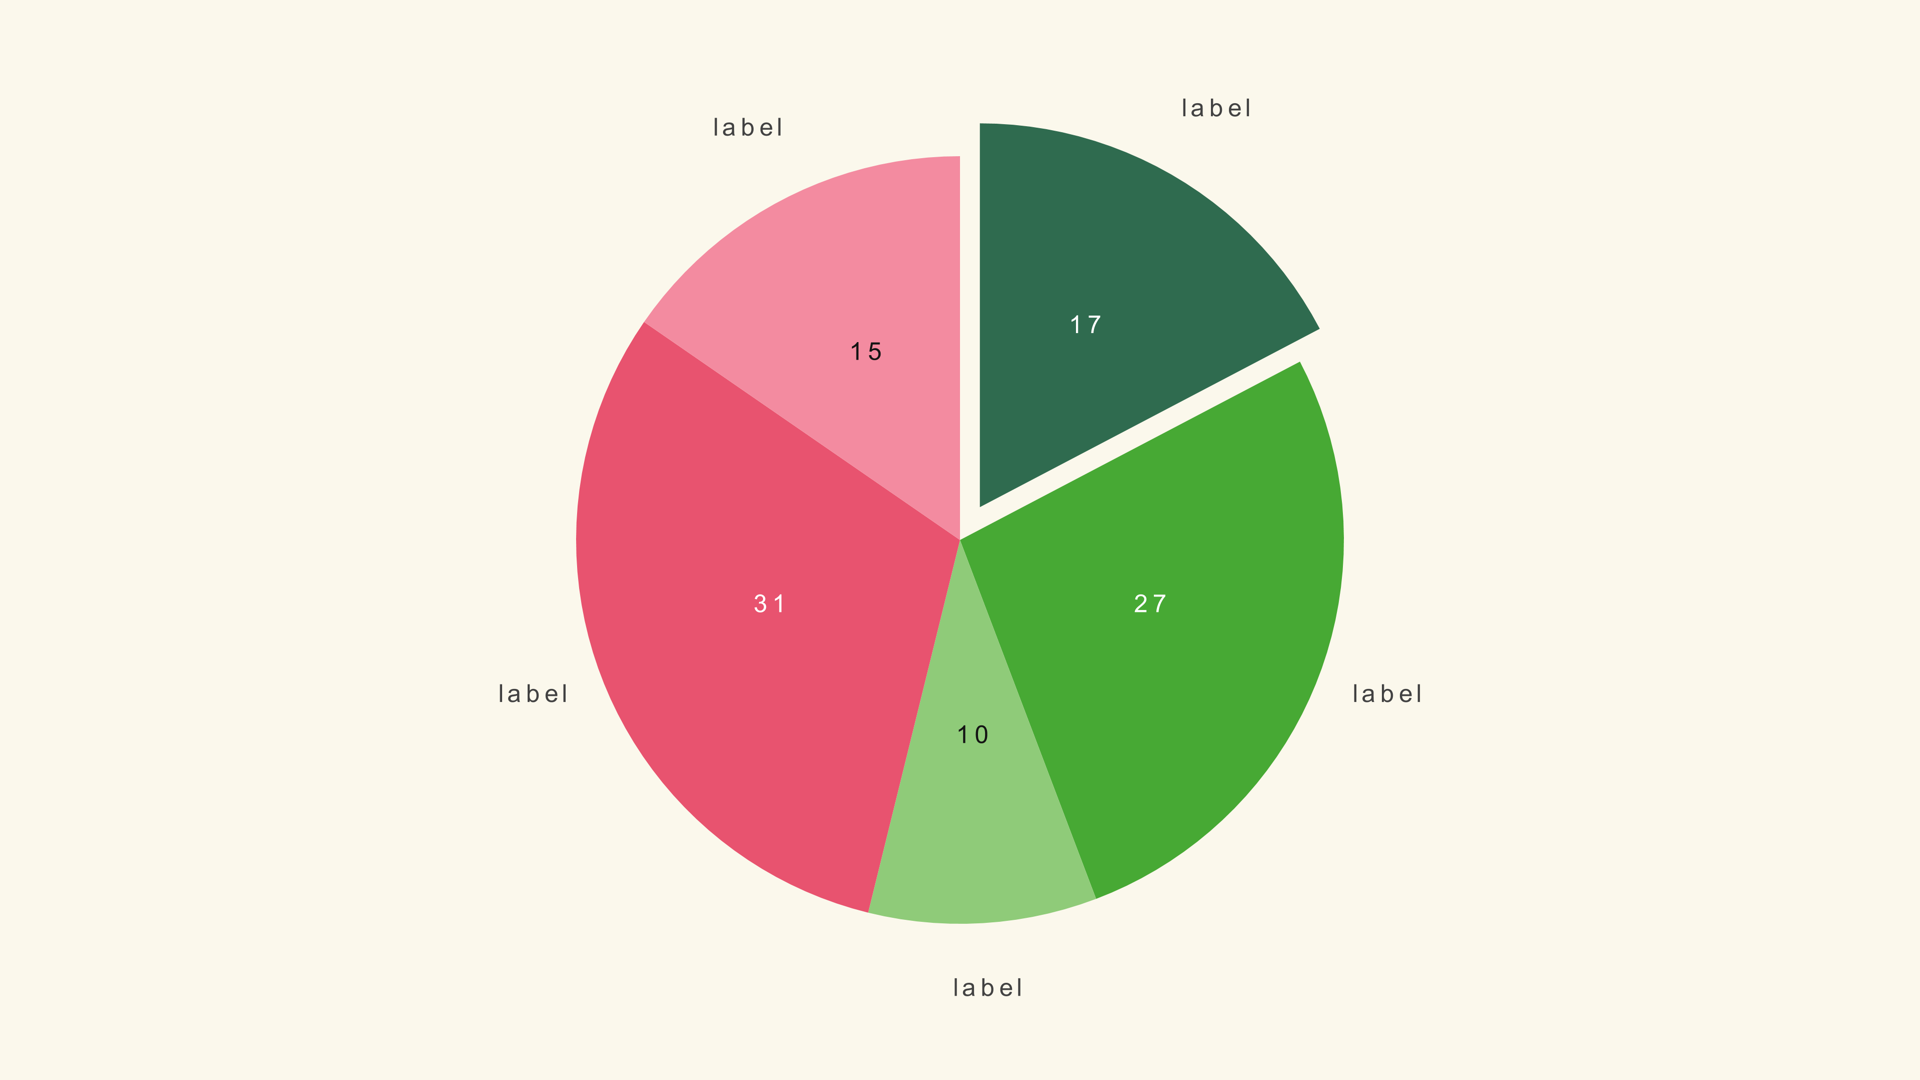
A practical infographic workflow for Resolve: choose the chart, build the hierarchy, keep the labels readable and animate the story in layers.
Noyris Charts Team
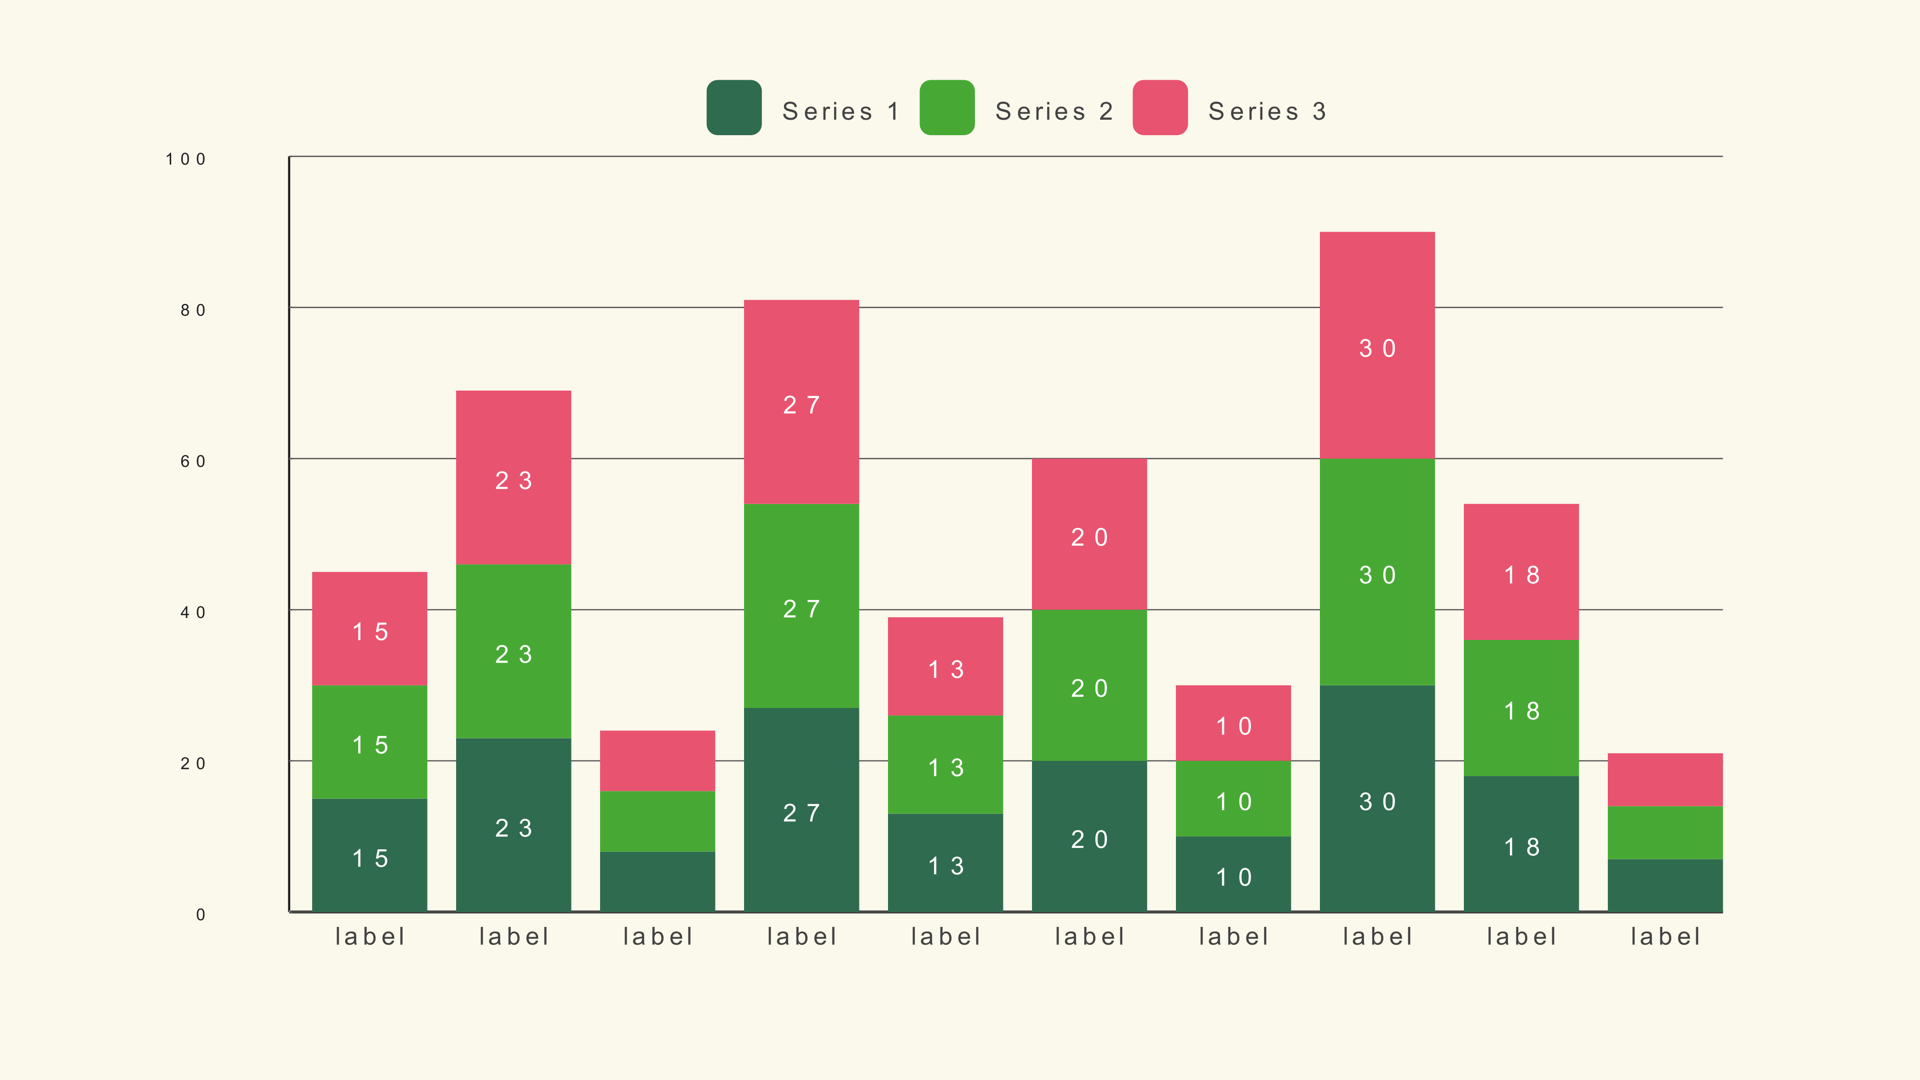
A stacked bar workflow for Resolve with the multi-column CSV shape, series limits and the scale rule that keeps the totals honest.
Noyris Charts Team
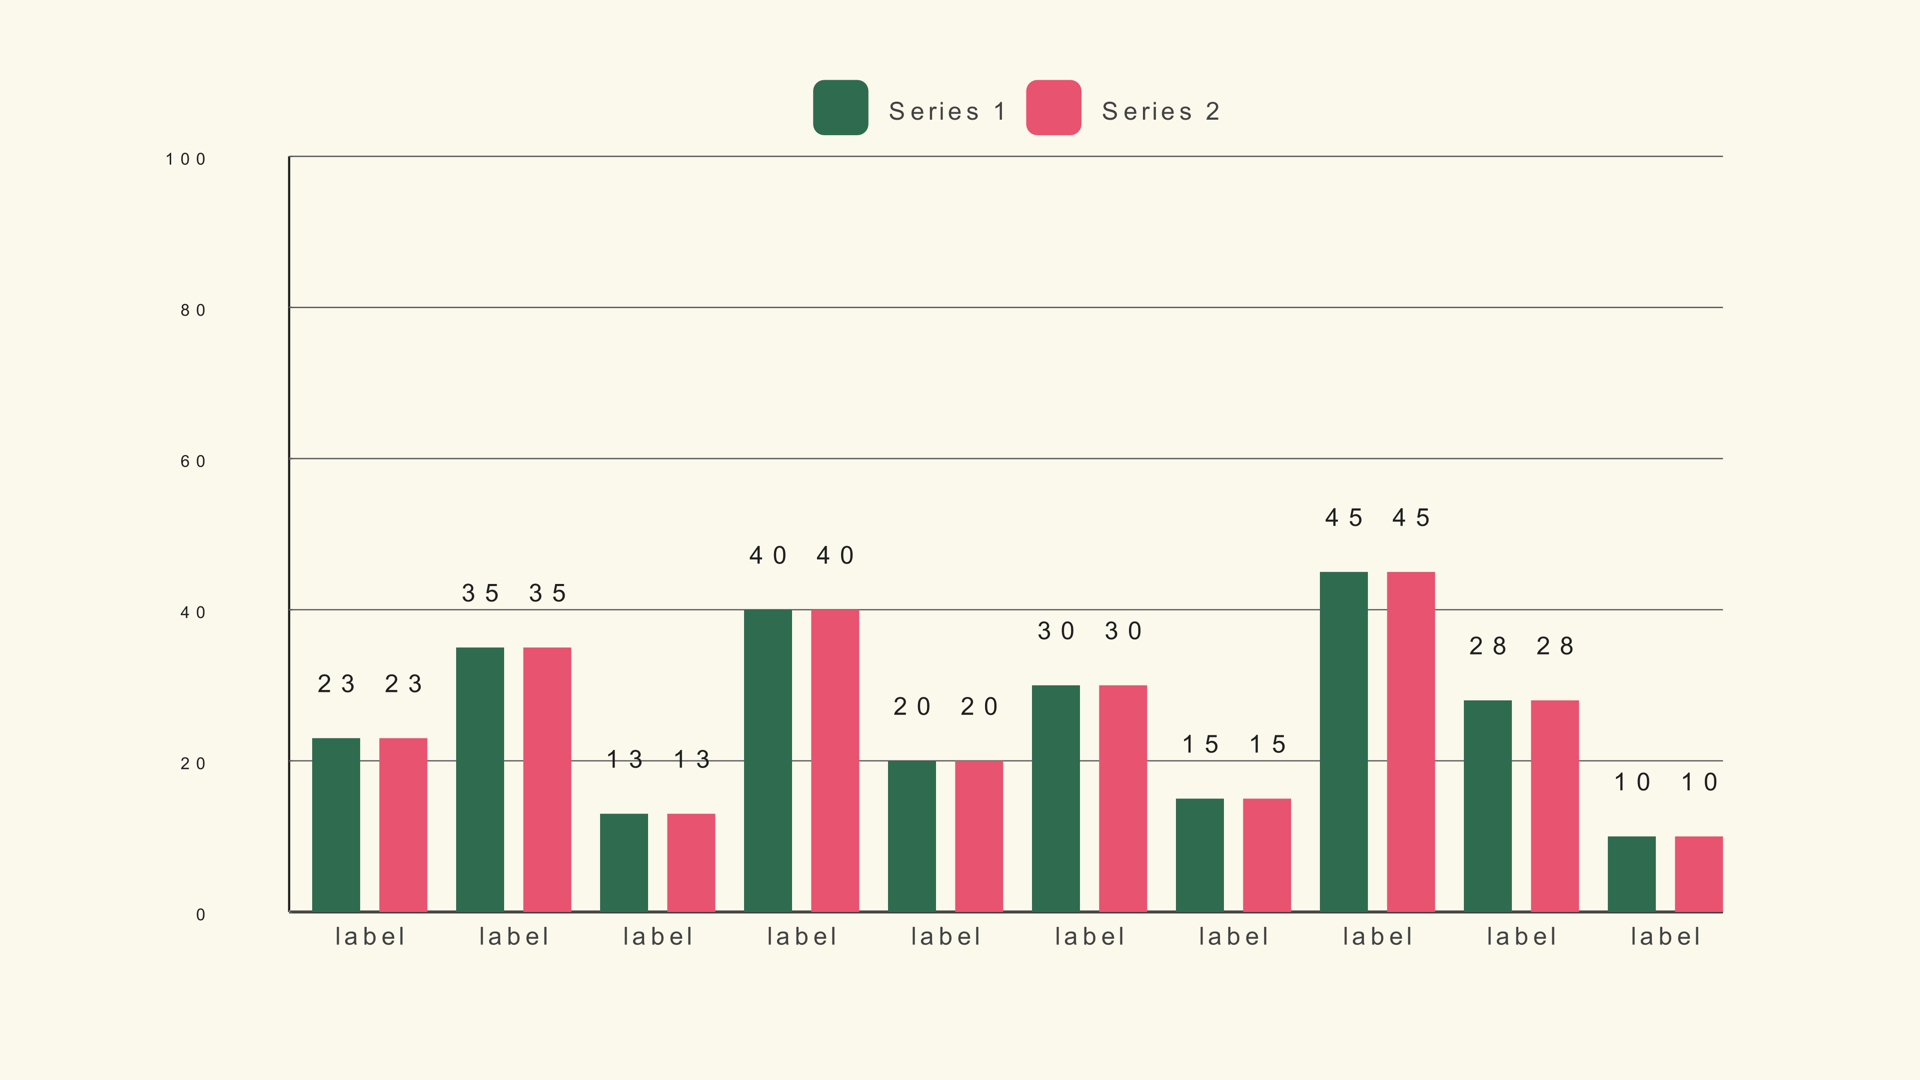
A grouped bar workflow for Resolve that keeps each series on its own baseline, from the CSV shape to the legend and motion.
Noyris Charts Team
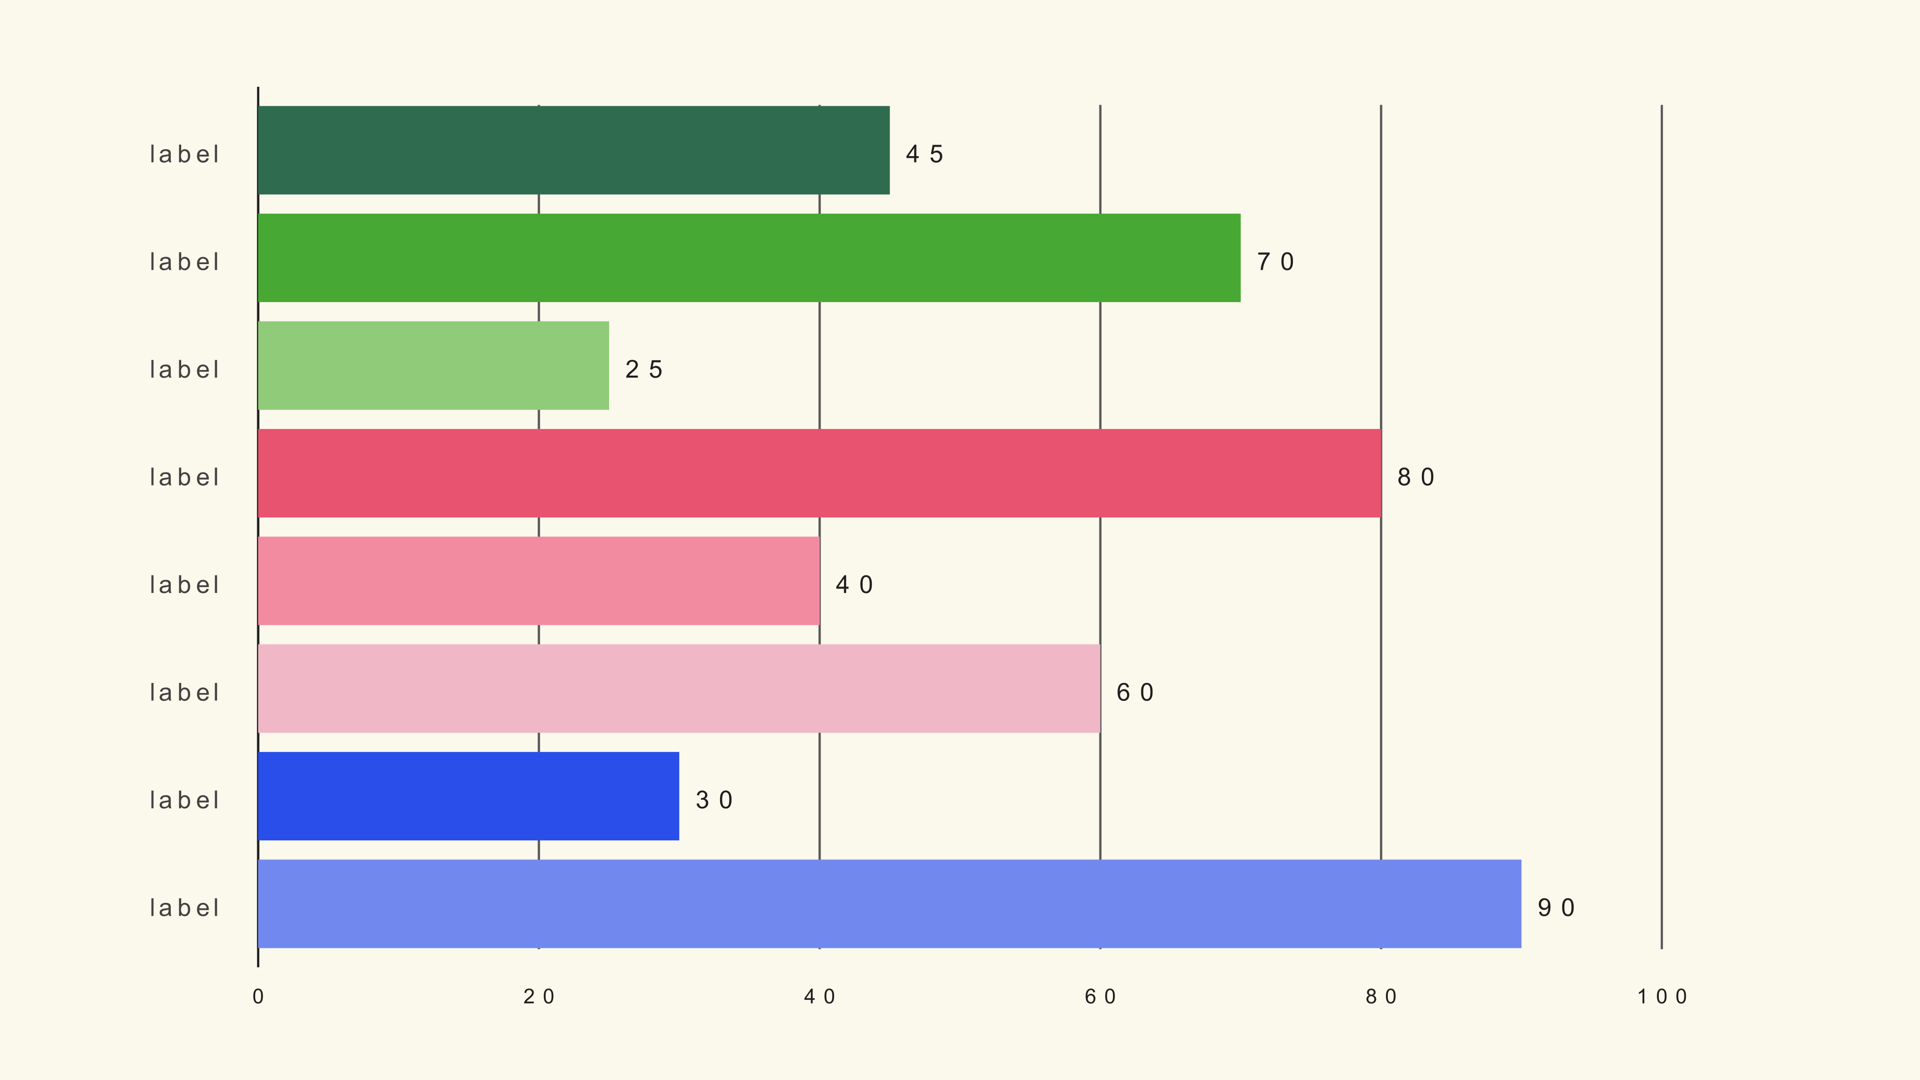
A horizontal bar chart workflow for Resolve that handles long labels, ranked lists and lower-third-friendly layouts.
Noyris Charts Team
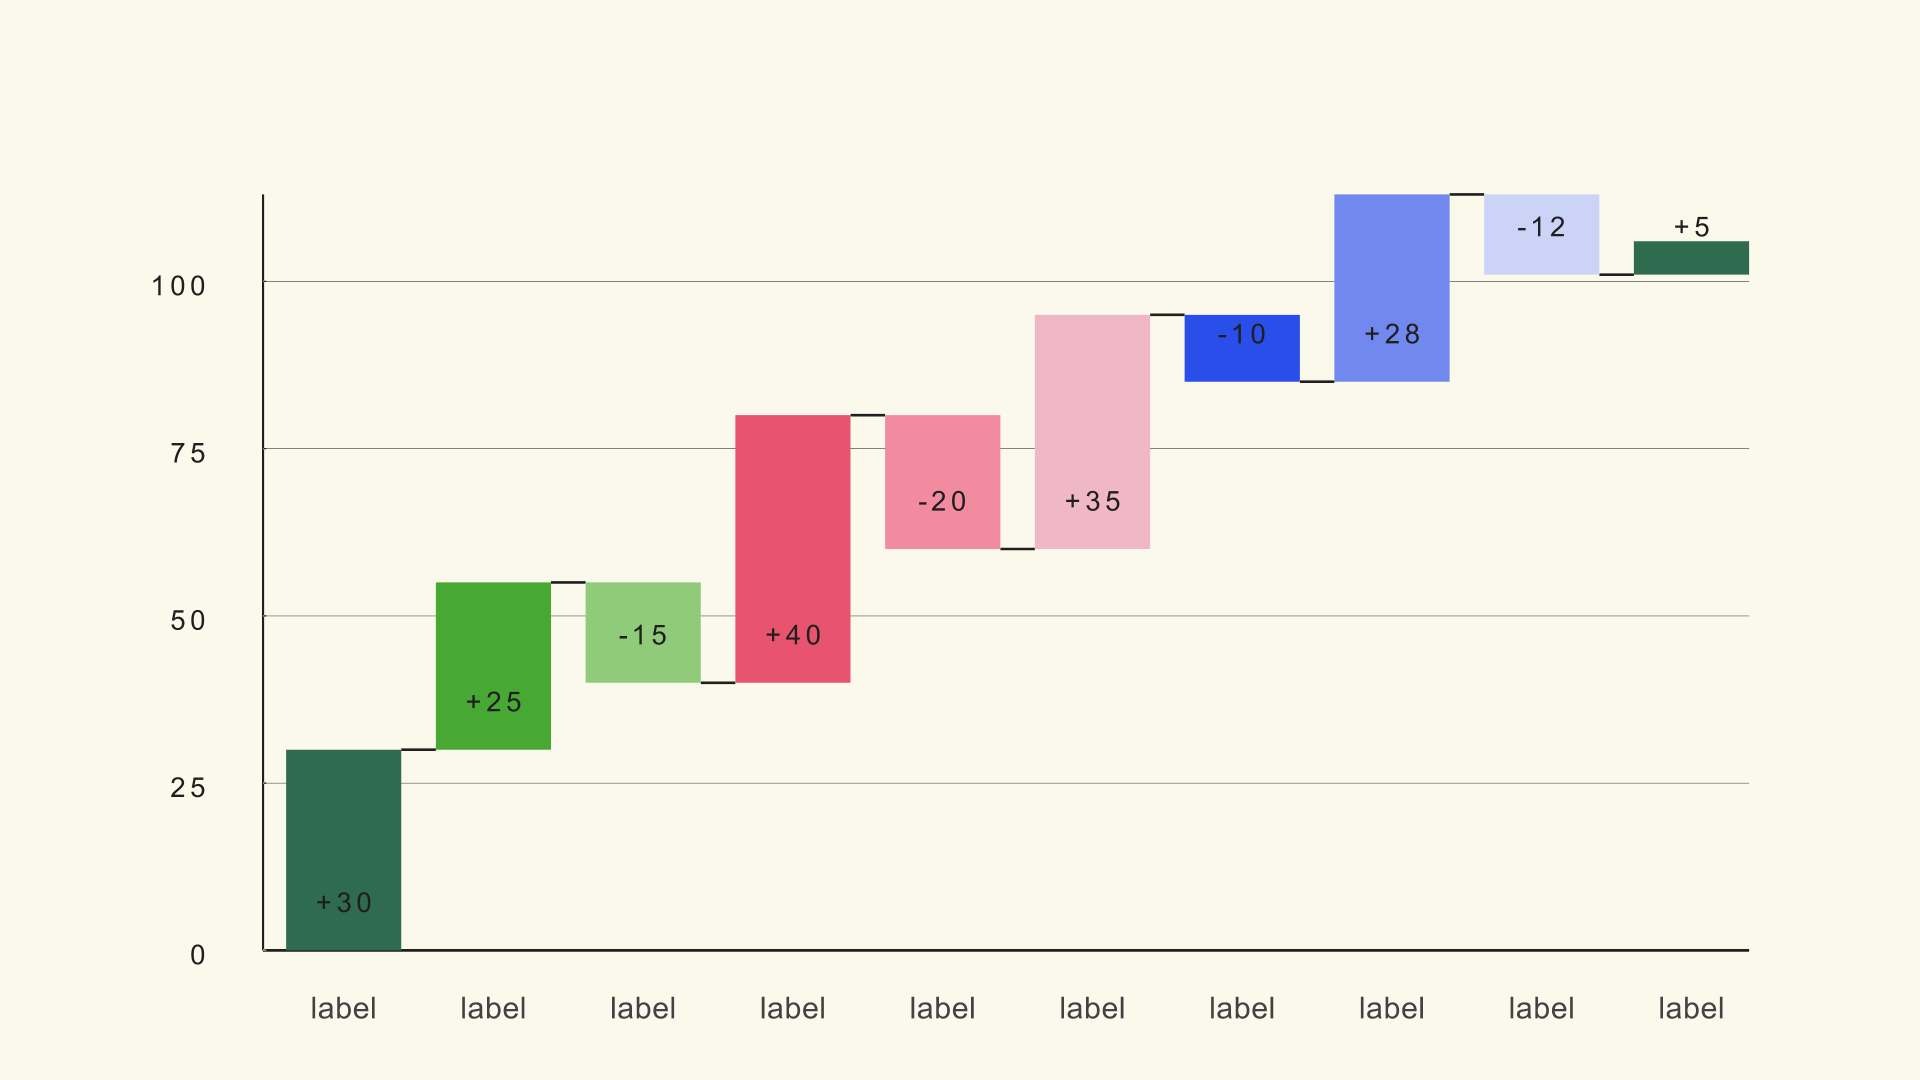
A waterfall chart workflow for Resolve that shows how a starting number becomes an ending number, step by step.
Noyris Charts Team
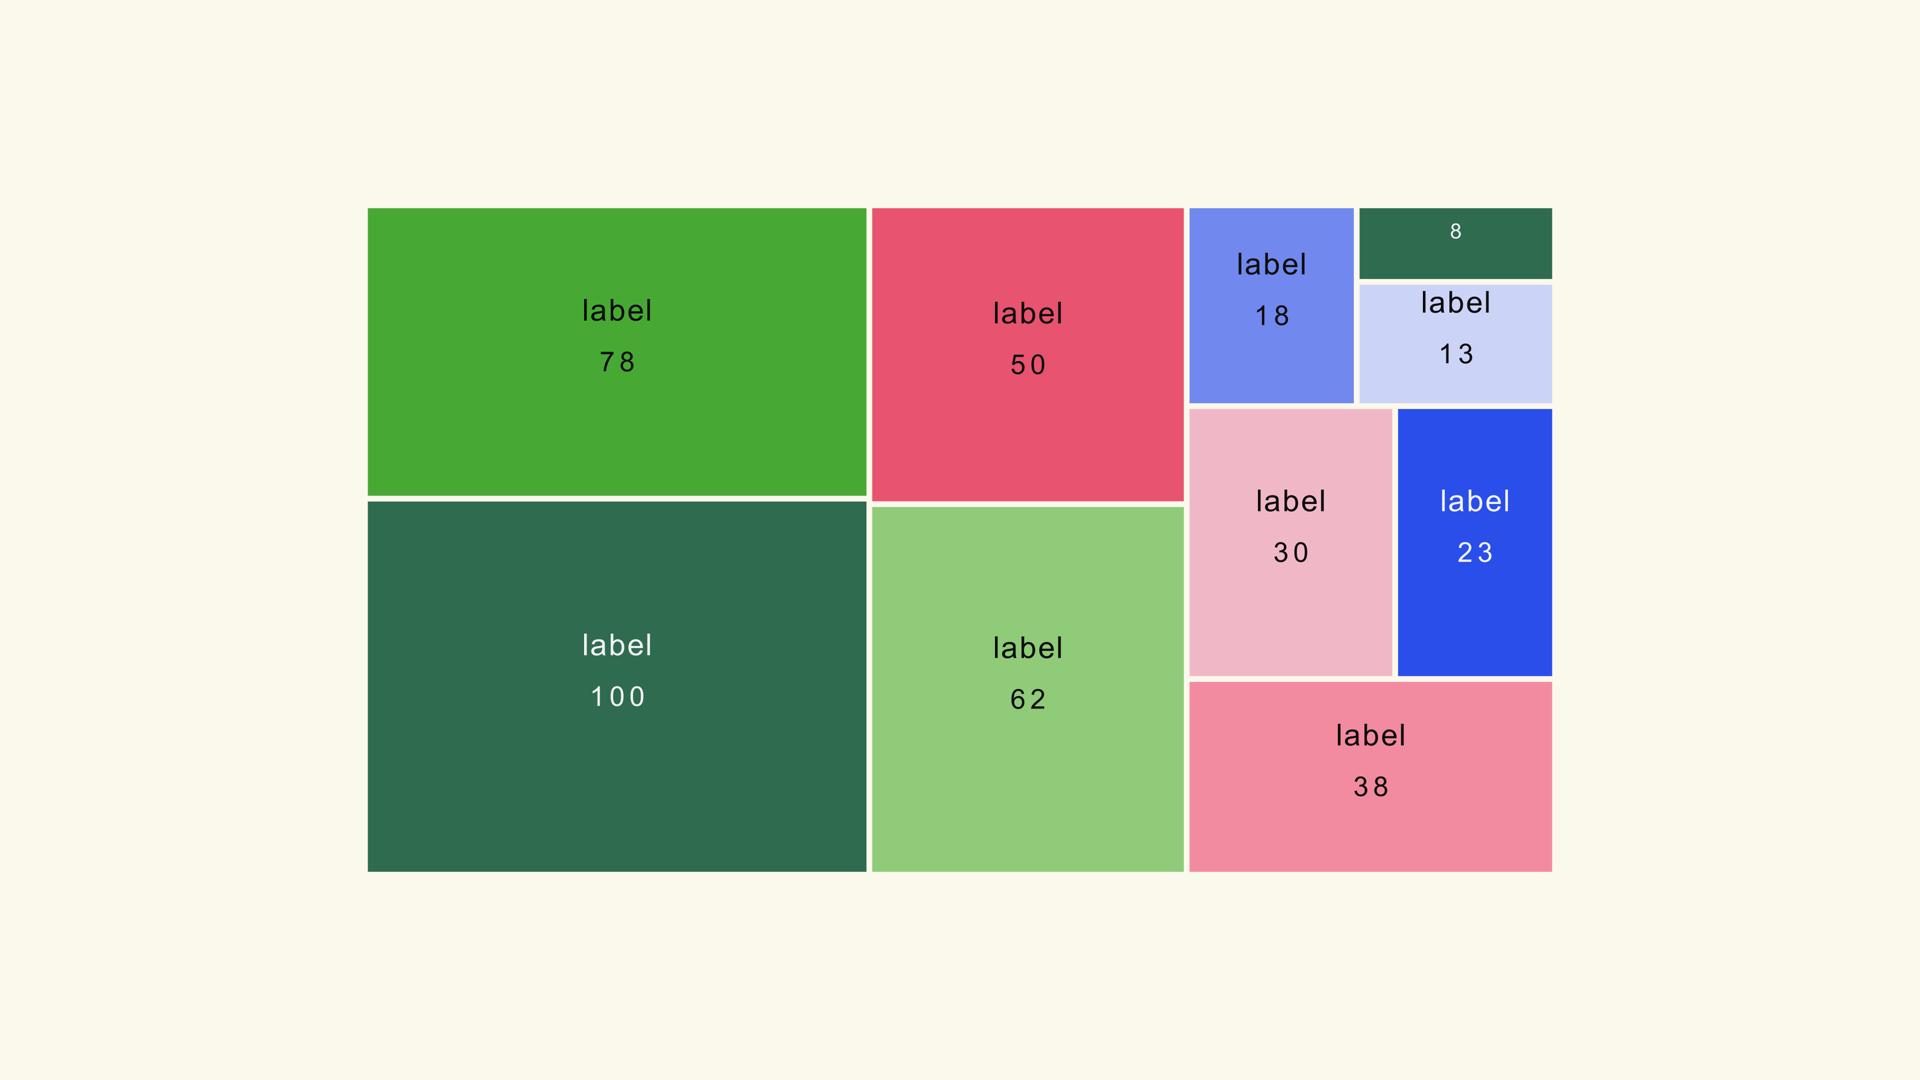
A treemap workflow for Resolve that shows share of a whole across many categories without turning the frame into a long bar chart.
Noyris Charts Team
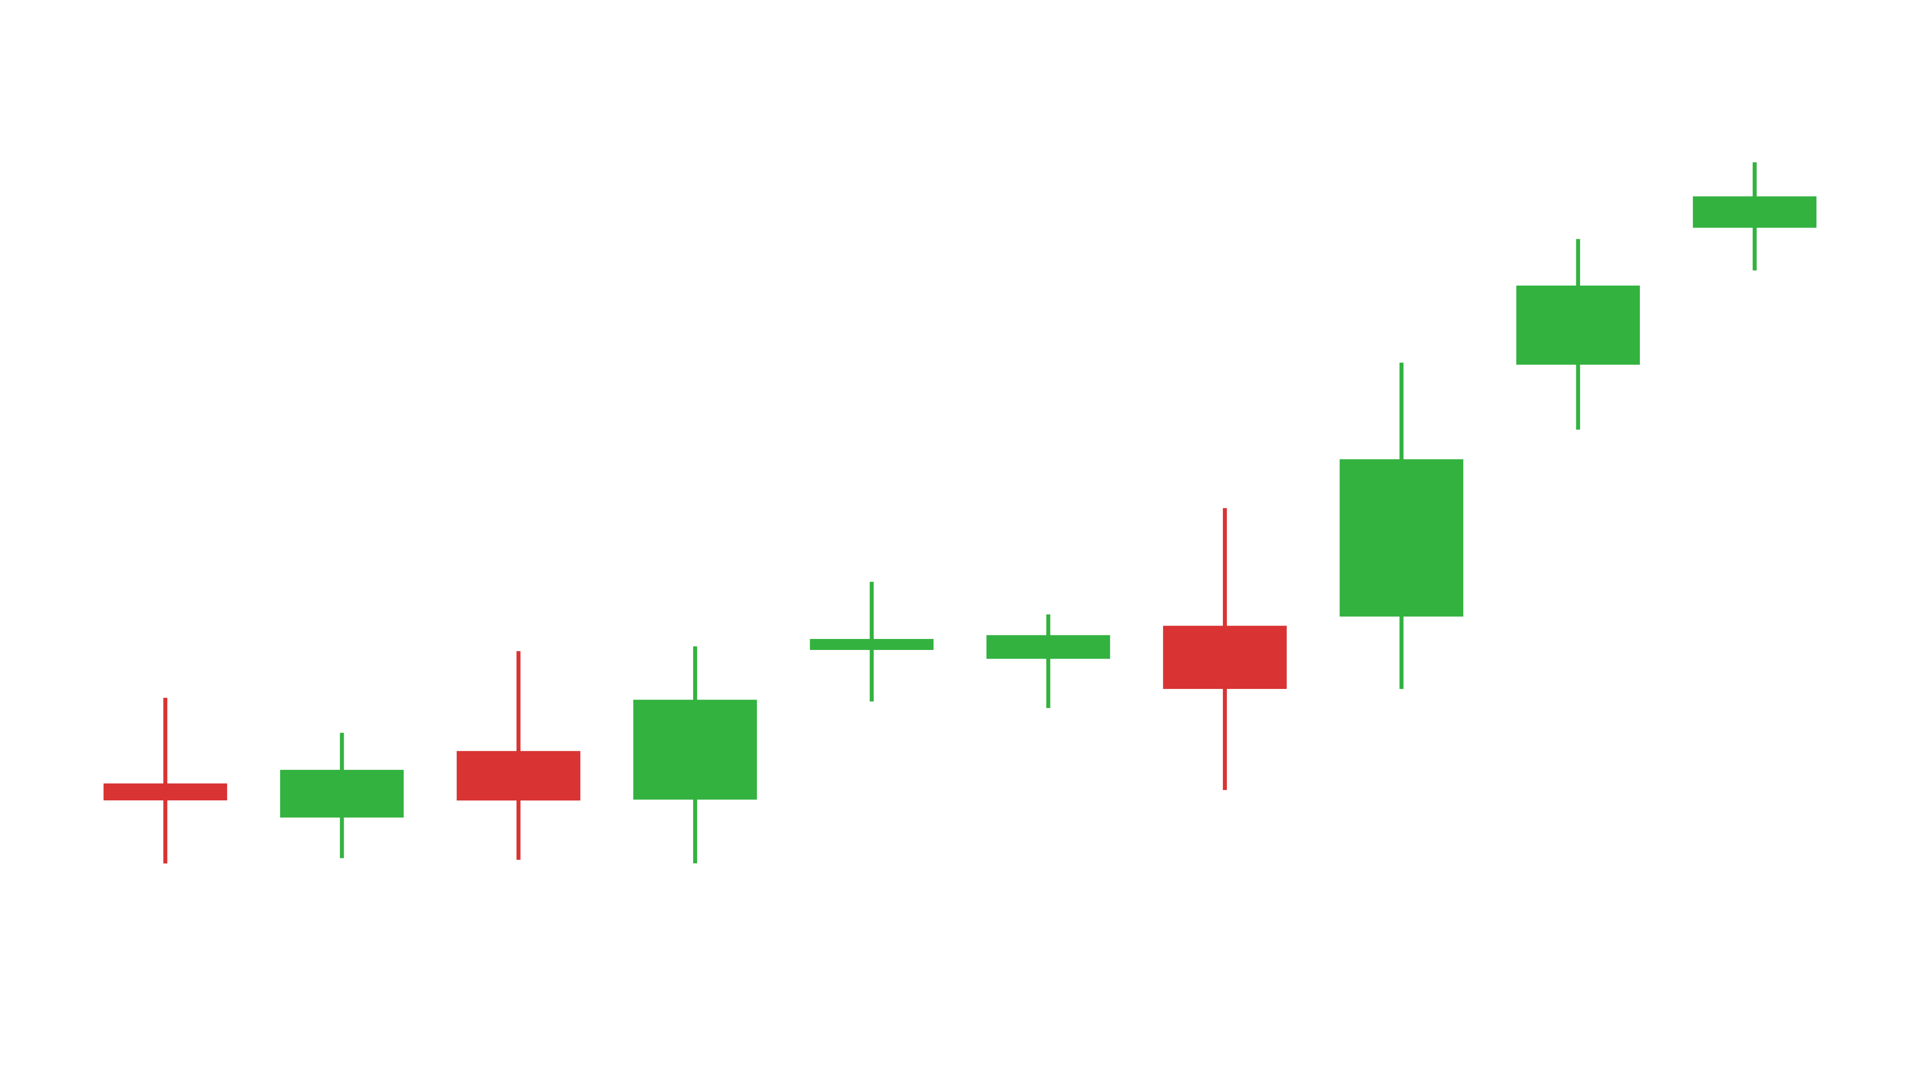
A candlestick workflow for Resolve, from the OHLC CSV columns to the body, wick, price window and market-readable animation.
Noyris Charts Team
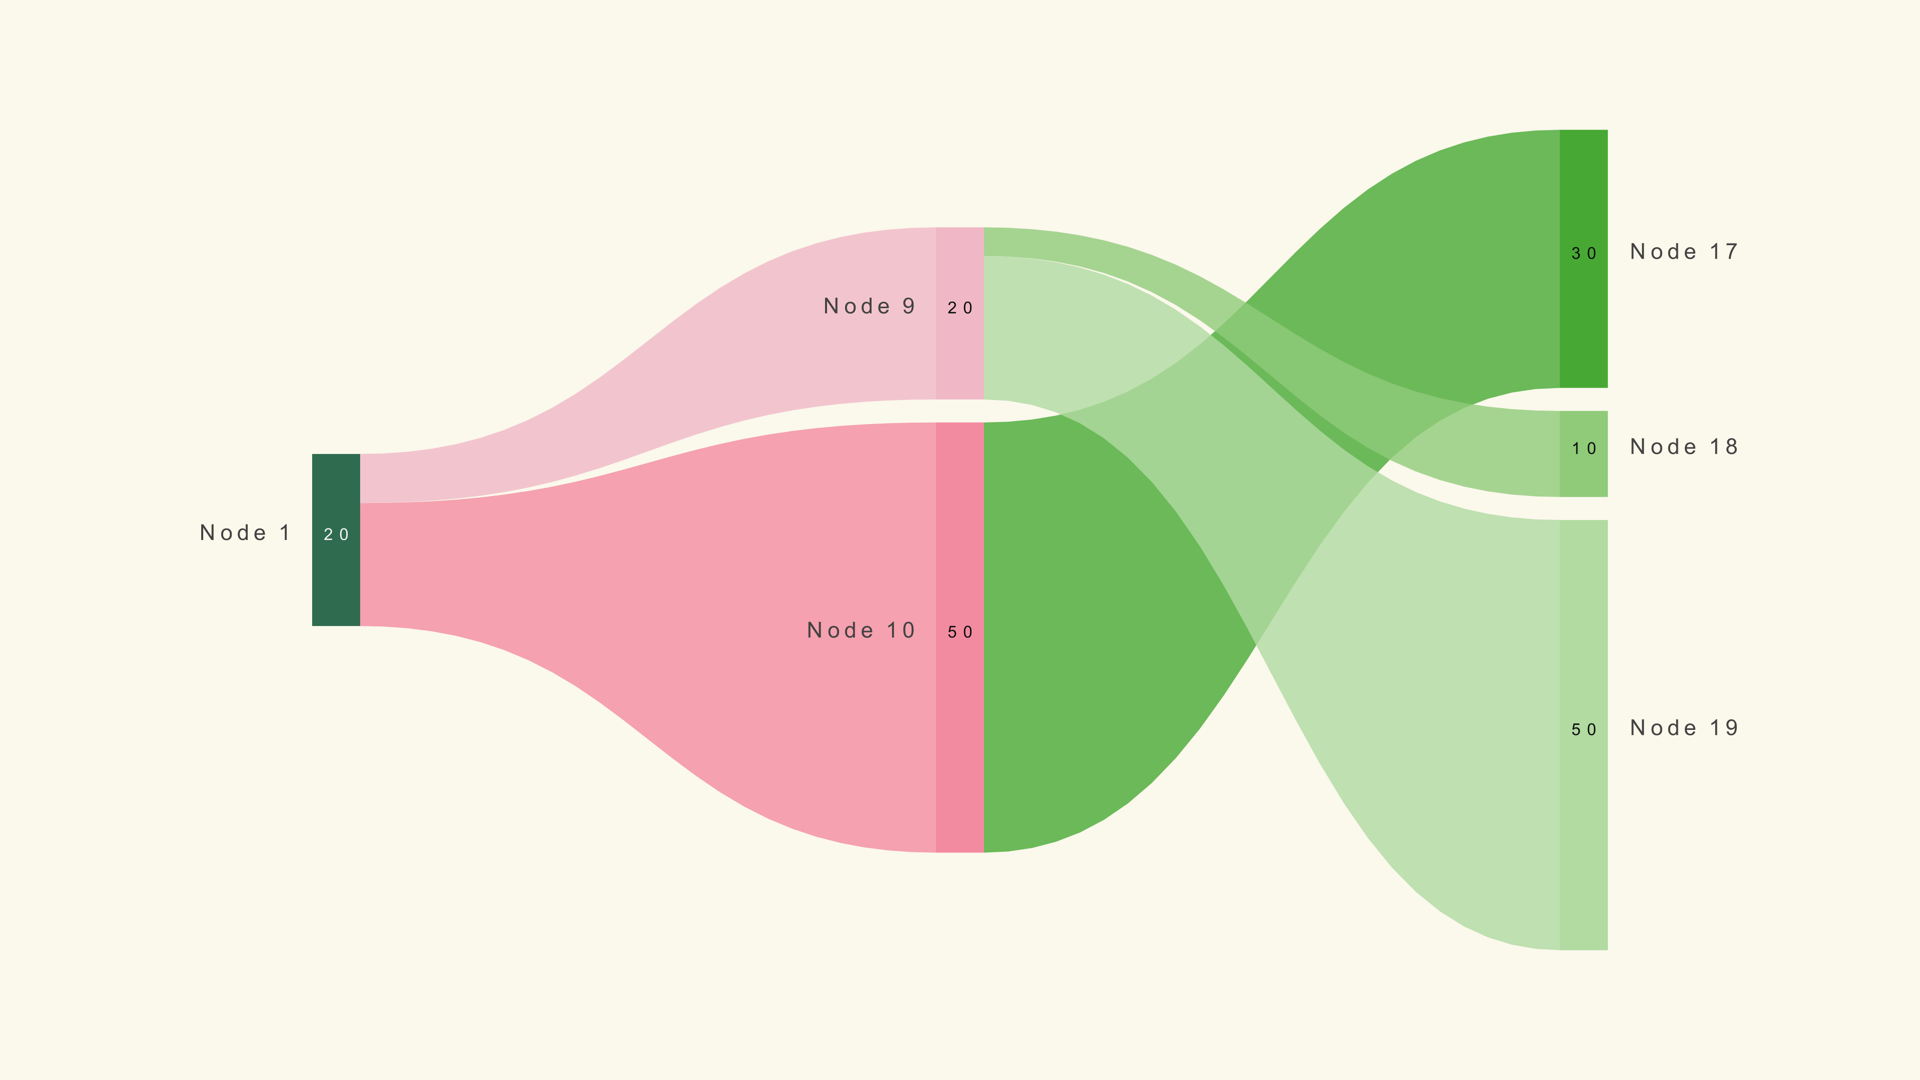
A Sankey workflow for Resolve that maps budgets, energy or journeys through stages, with the parent-link logic that controls every ribbon.
Noyris Charts Team
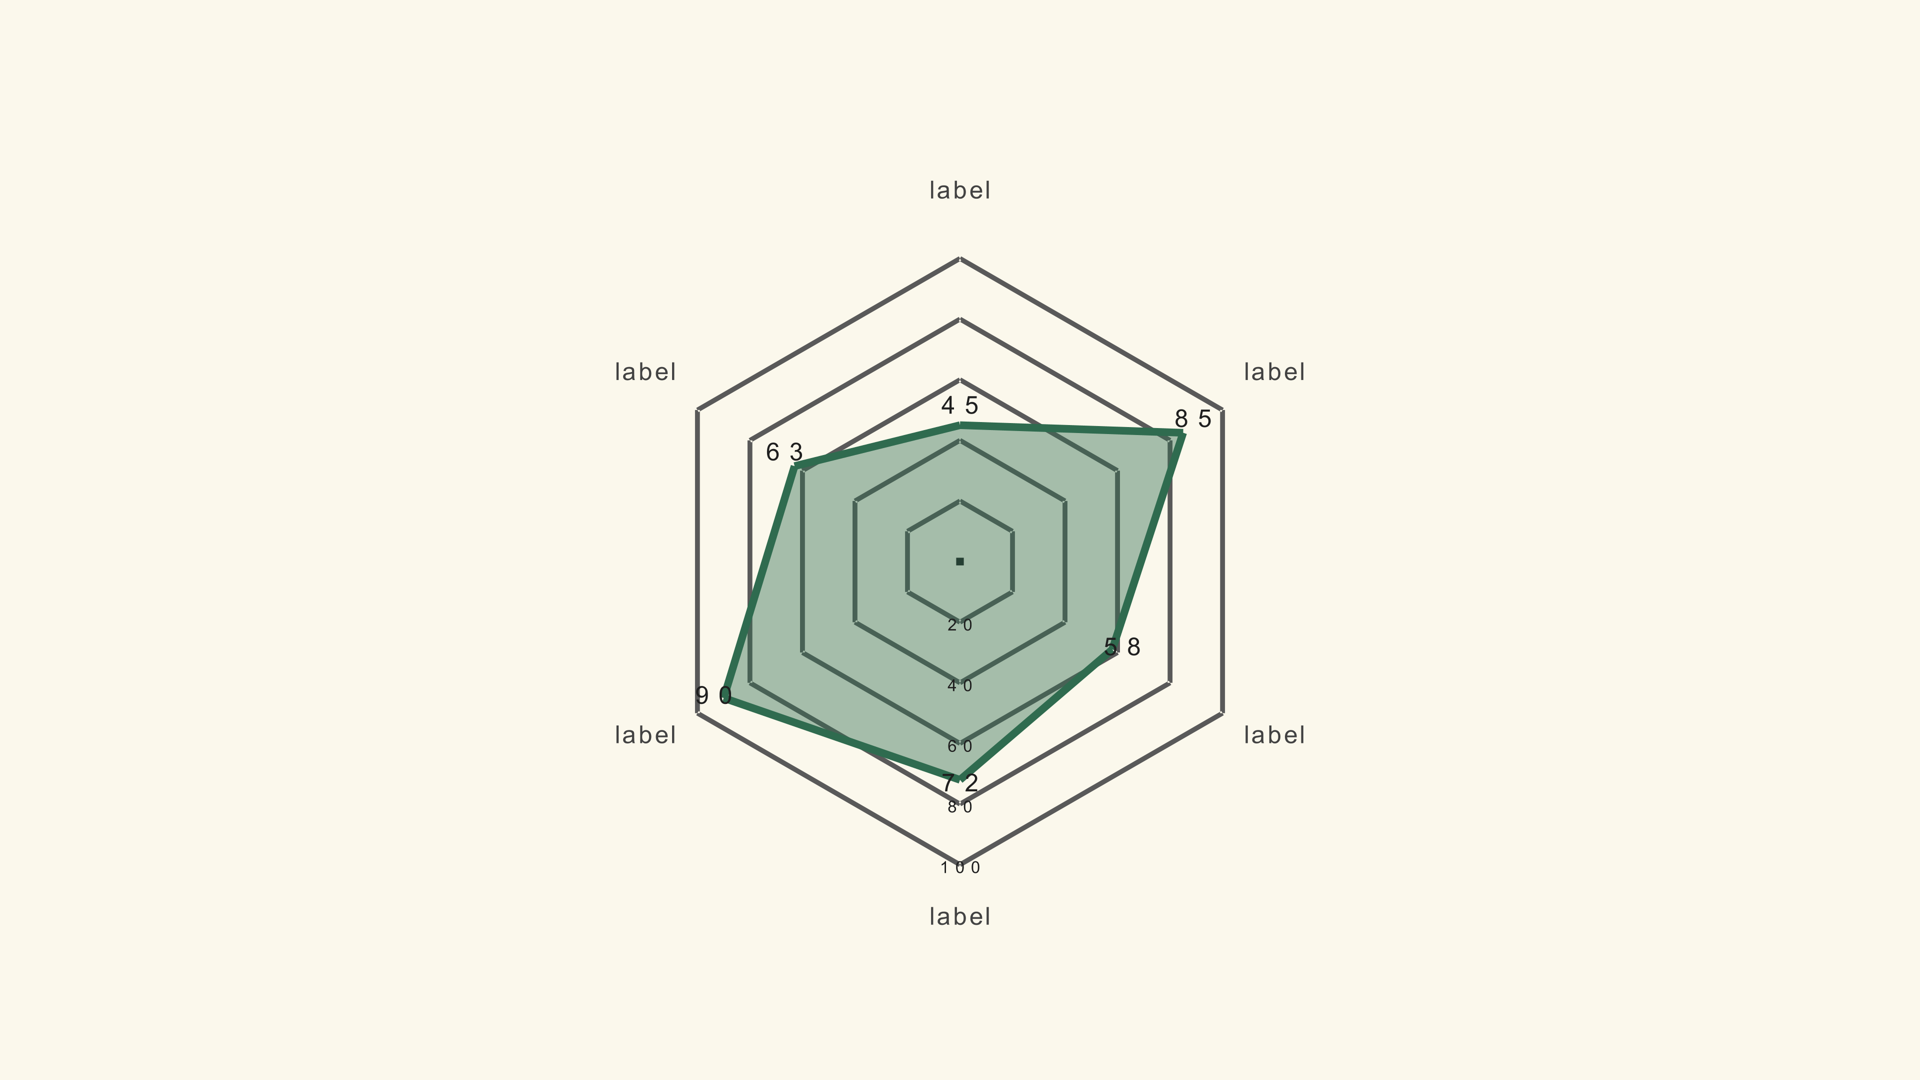
A radar chart workflow for Resolve for comparing several metrics at once, with the axis and scale rules that keep the shape honest.
Noyris Charts Team
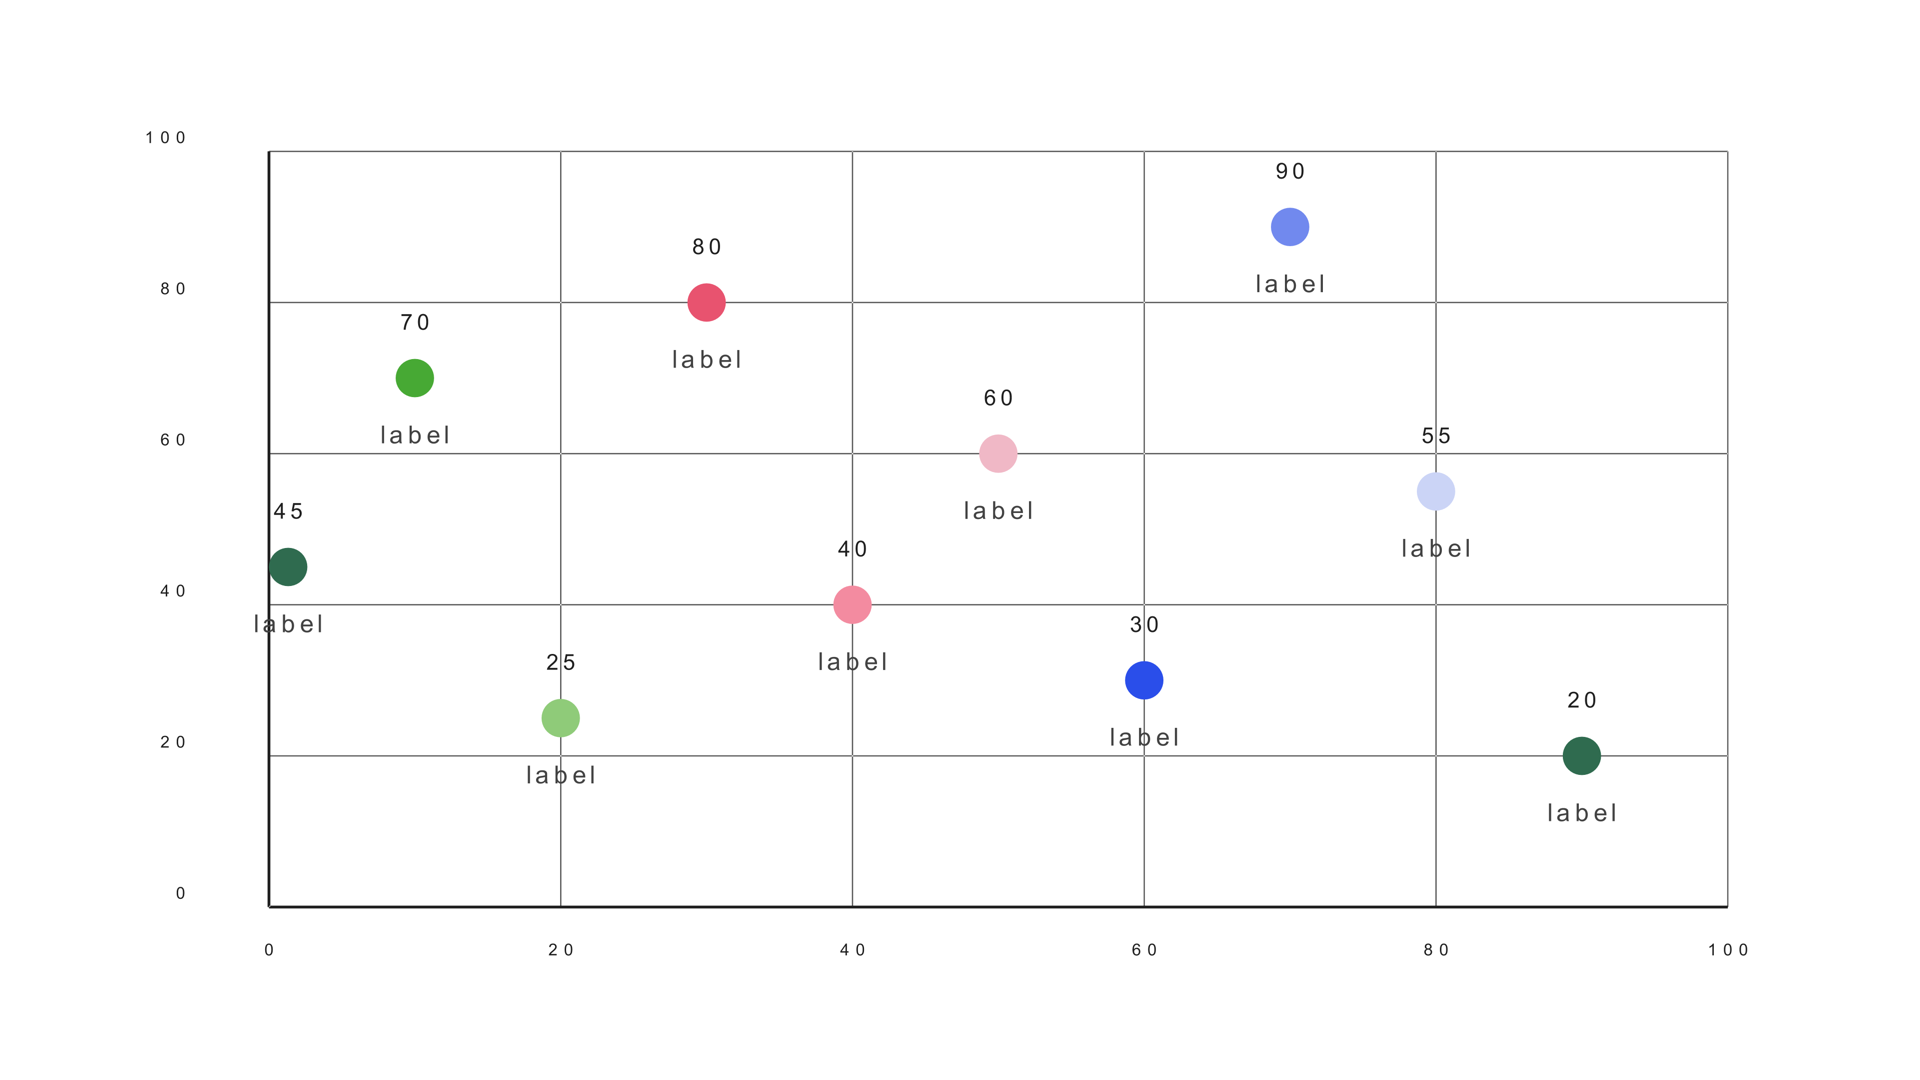
A scatter plot workflow for Resolve for correlation, clusters and outliers, with the axis and labeling rules that keep the plot readable.
Noyris Charts Team
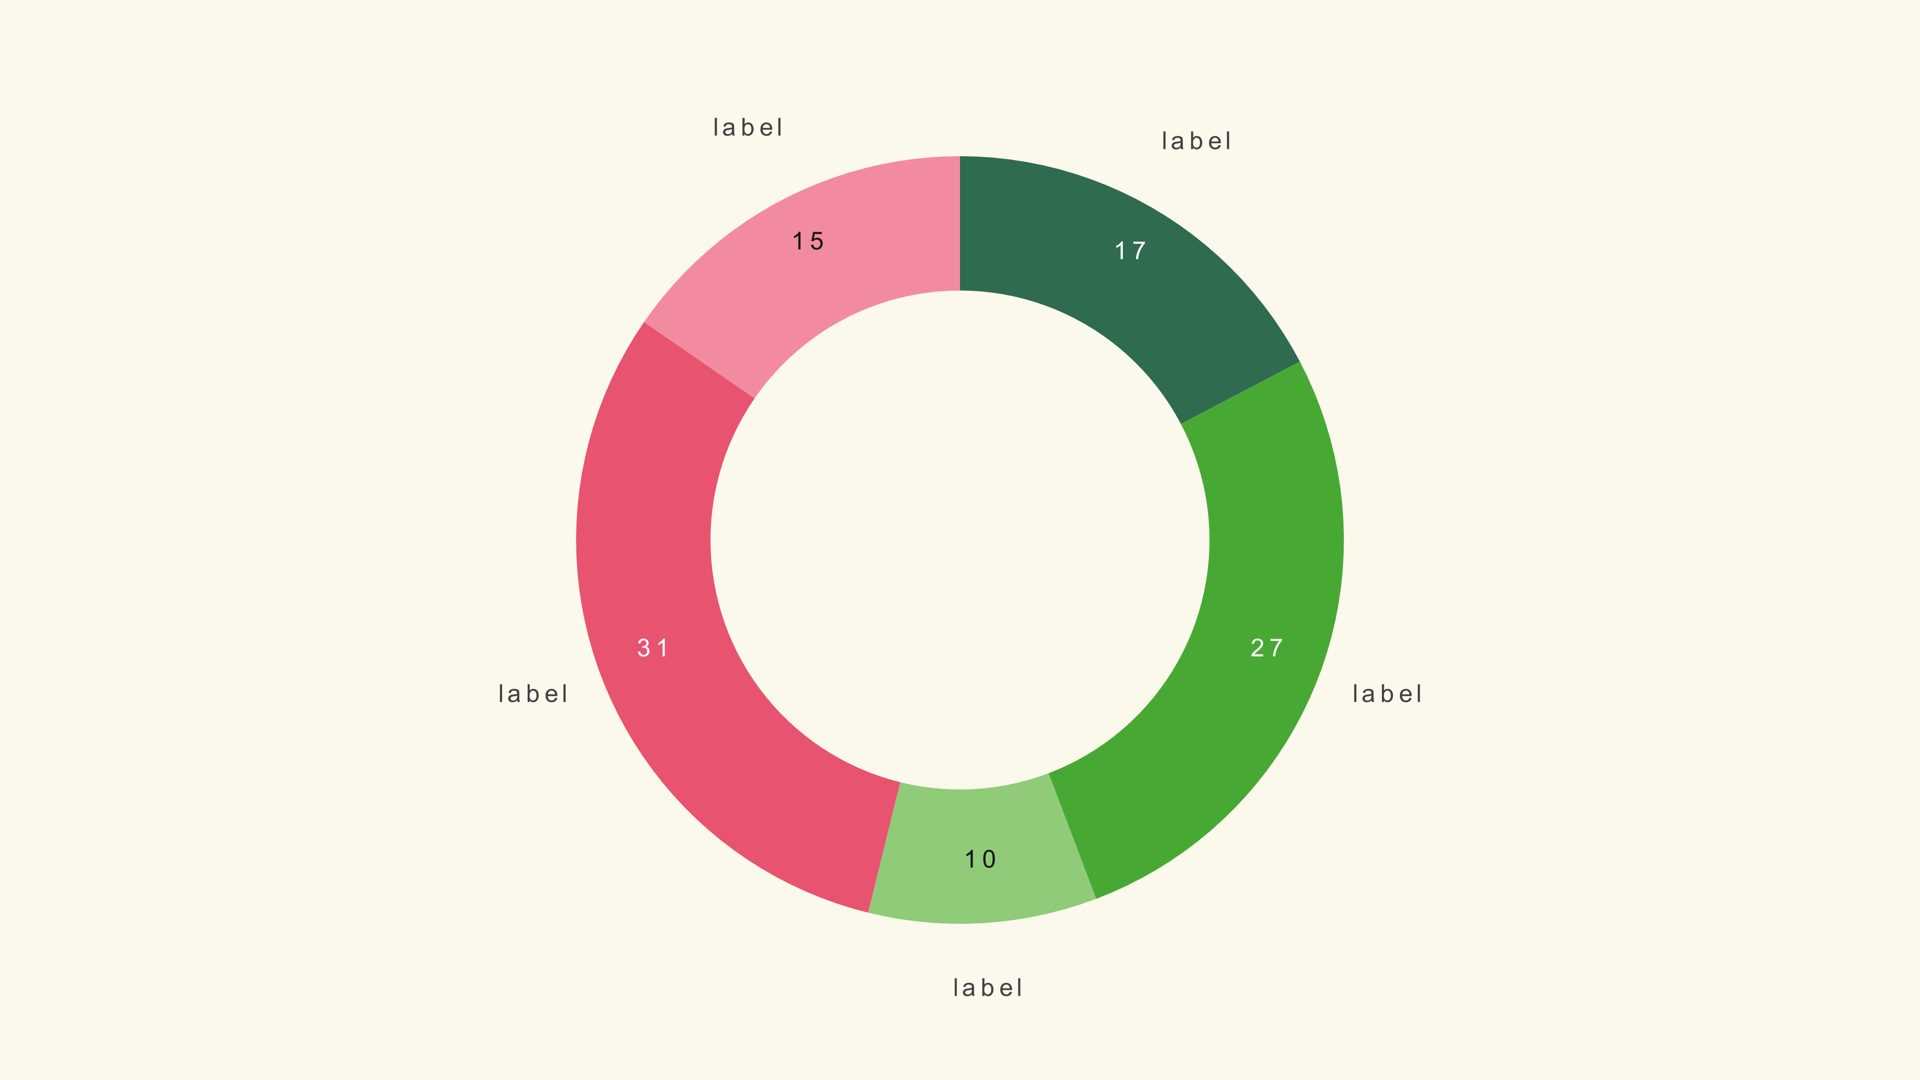
A donut chart workflow for Resolve that uses the open center for a KPI or callout while the ring shows share of a whole.
Noyris Charts Team
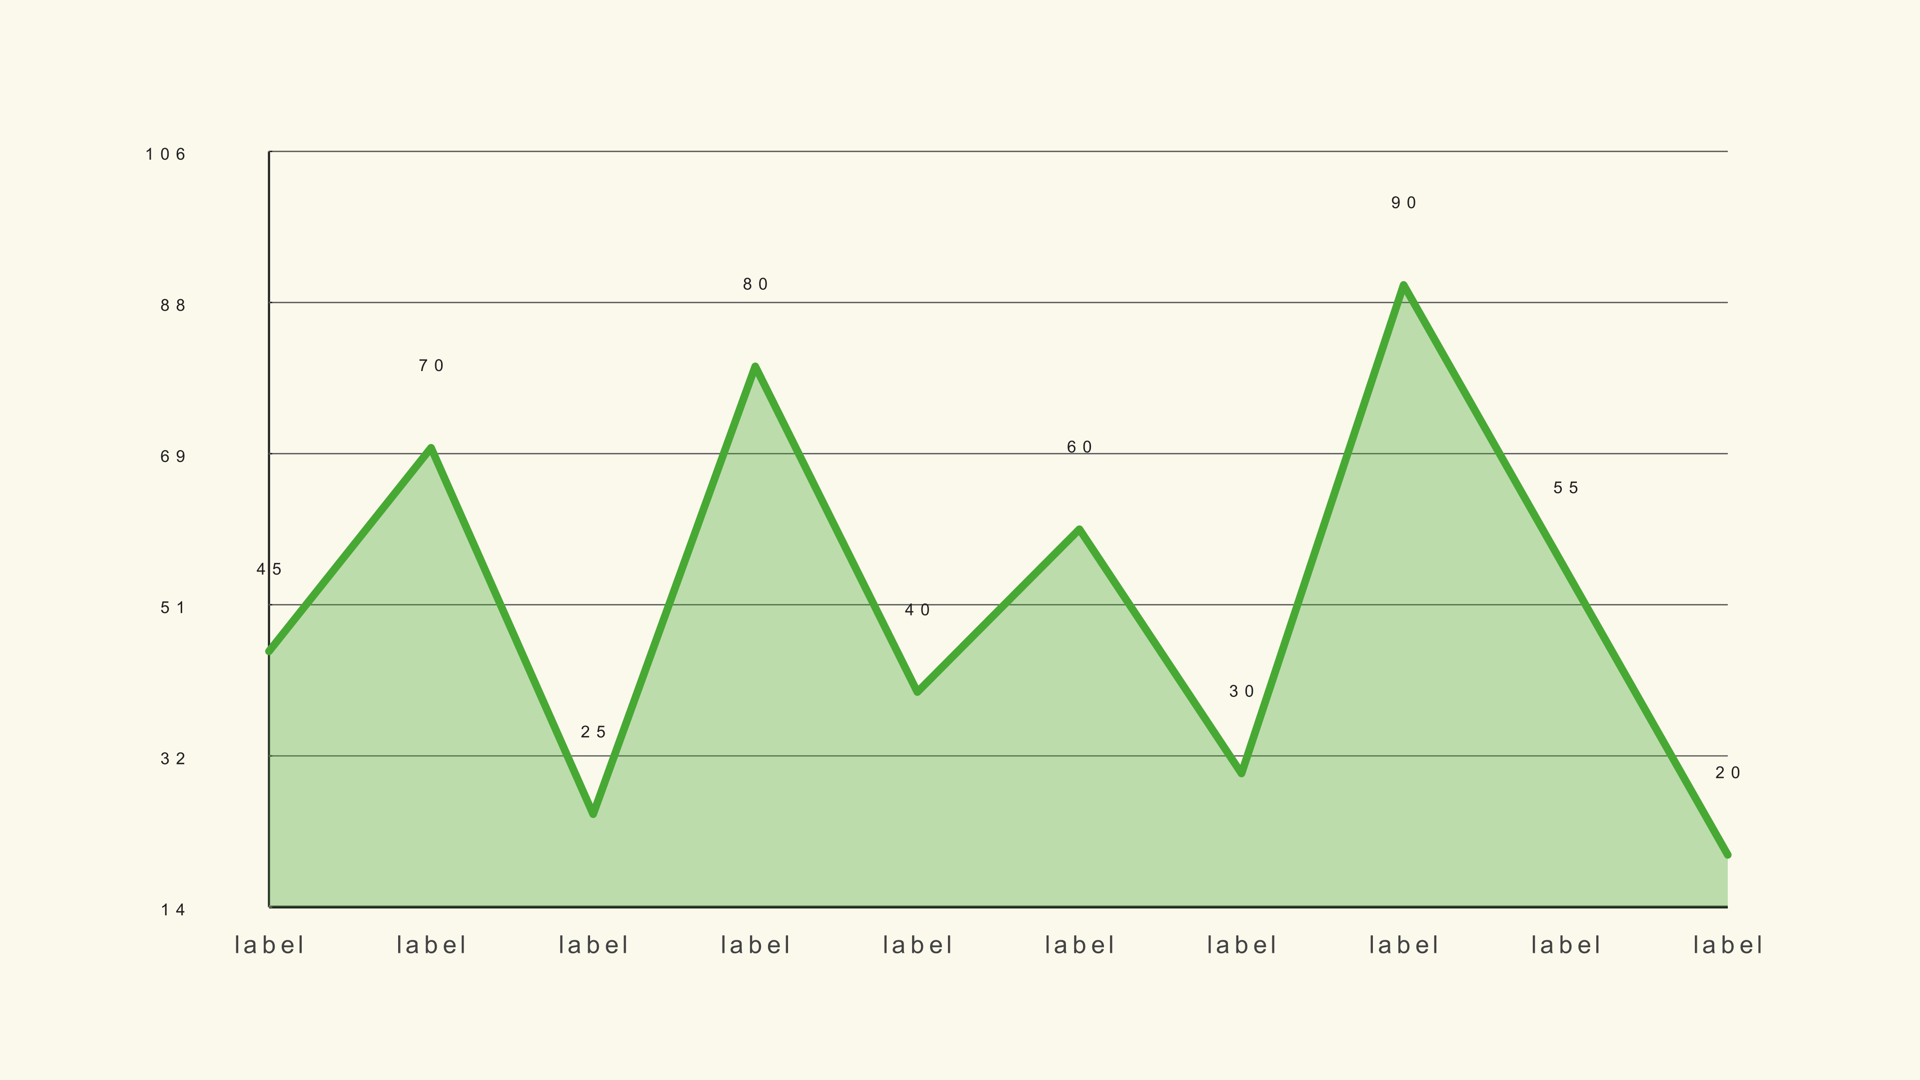
An area chart workflow for Resolve for trends where the magnitude under the line matters, including stacked and multi-series variants.
Noyris Charts Team
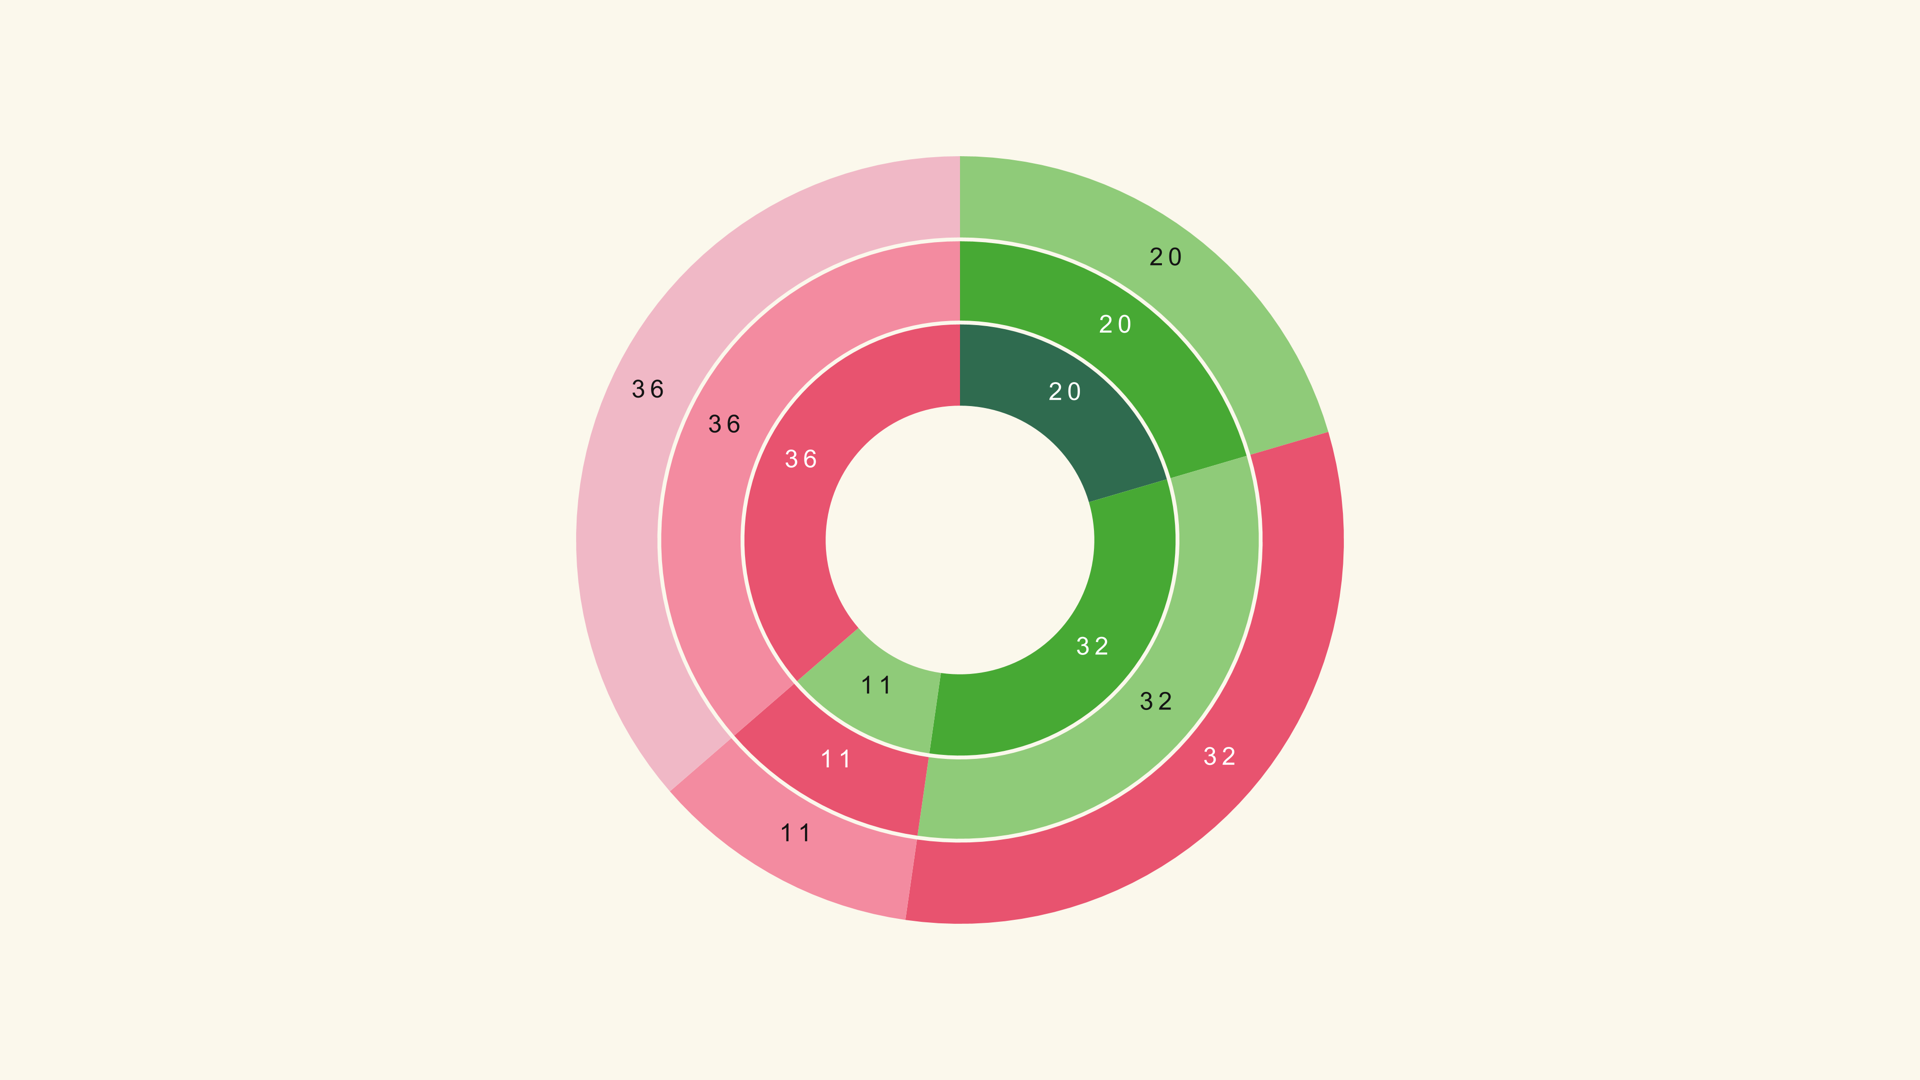
The visual rules that separate a chart that works on a timeline from a chart that only works as a still image.
Noyris Charts Team
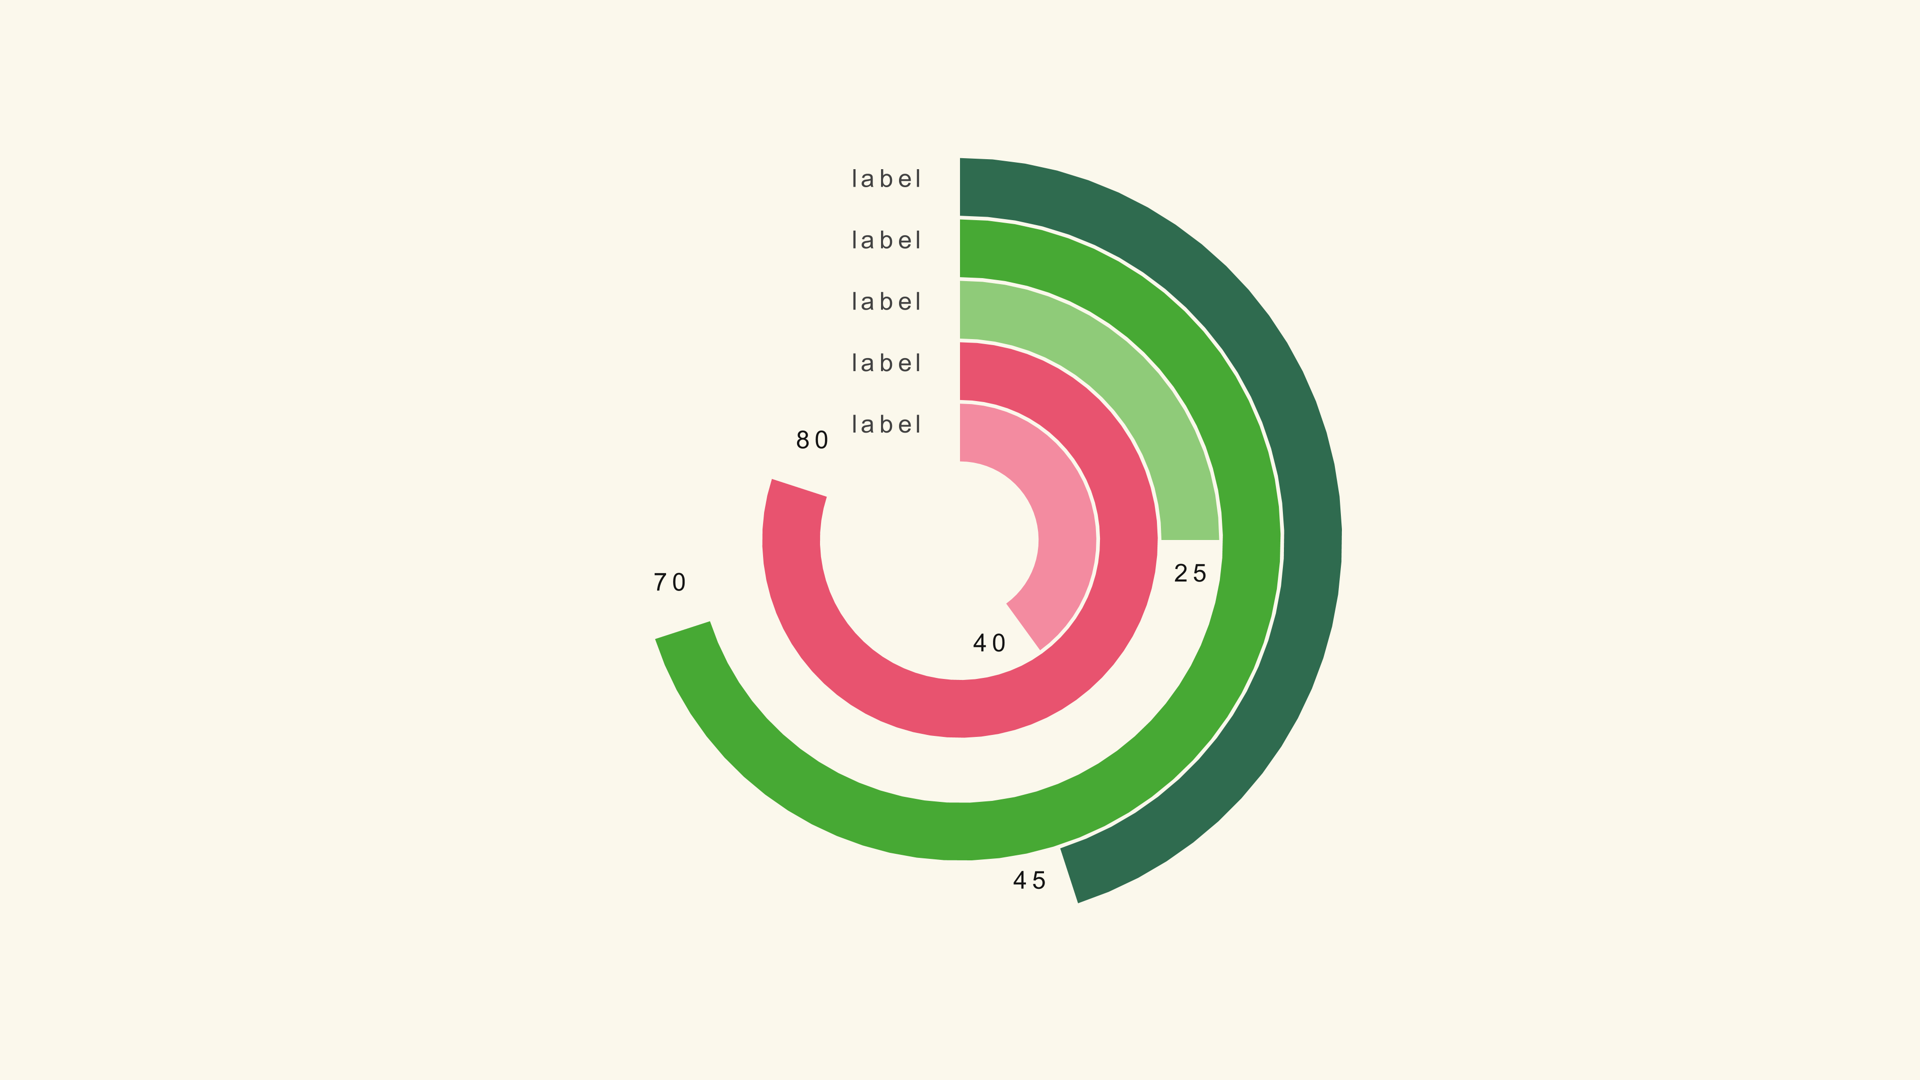
A ring gauge workflow for Resolve for KPIs, targets and progress graphics, with the scale and label rules that keep the arc honest.
Noyris Charts Team
A practical, step-by-step walkthrough for building a clean, animated bar chart inside DaVinci Resolve - no After Effects and no node graph.
Noyris Charts Team
The exact CSV shapes Noyris Charts expects, with sample files and fixes for the import problems that waste the most time.
Noyris Charts Team
Tested in Resolve
Every workflow is run in DaVinci Resolve 18-21 before it ships. If a control changes, the article changes with it.
Sample files included
Each data article links to a CSV you can load immediately, so you can check the chart before touching your own spreadsheet.
Written by the product team
The people who build and support Noyris Charts write the guides. No ghostwritten listicles.
Skip the node graph.
All 41 native chart generators, 204 themes and the animation engine in one pack. One payment of $59.