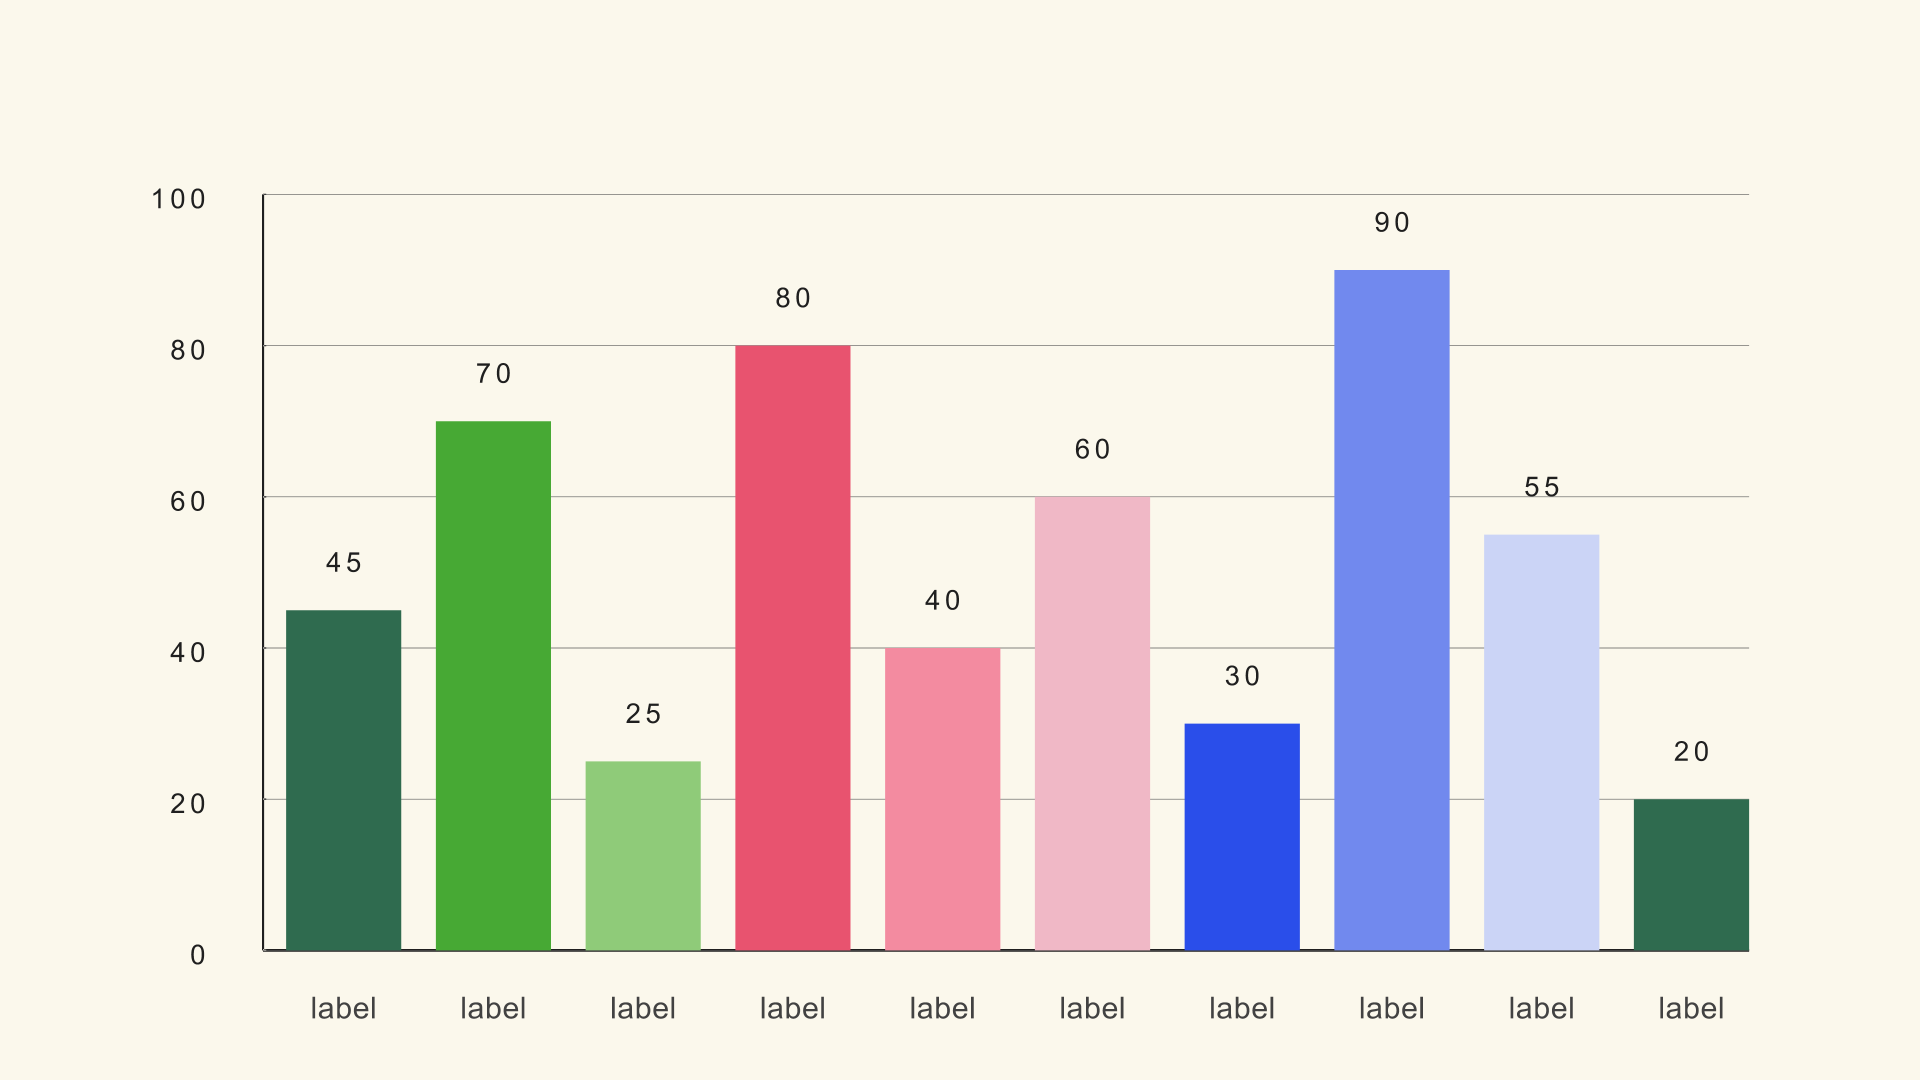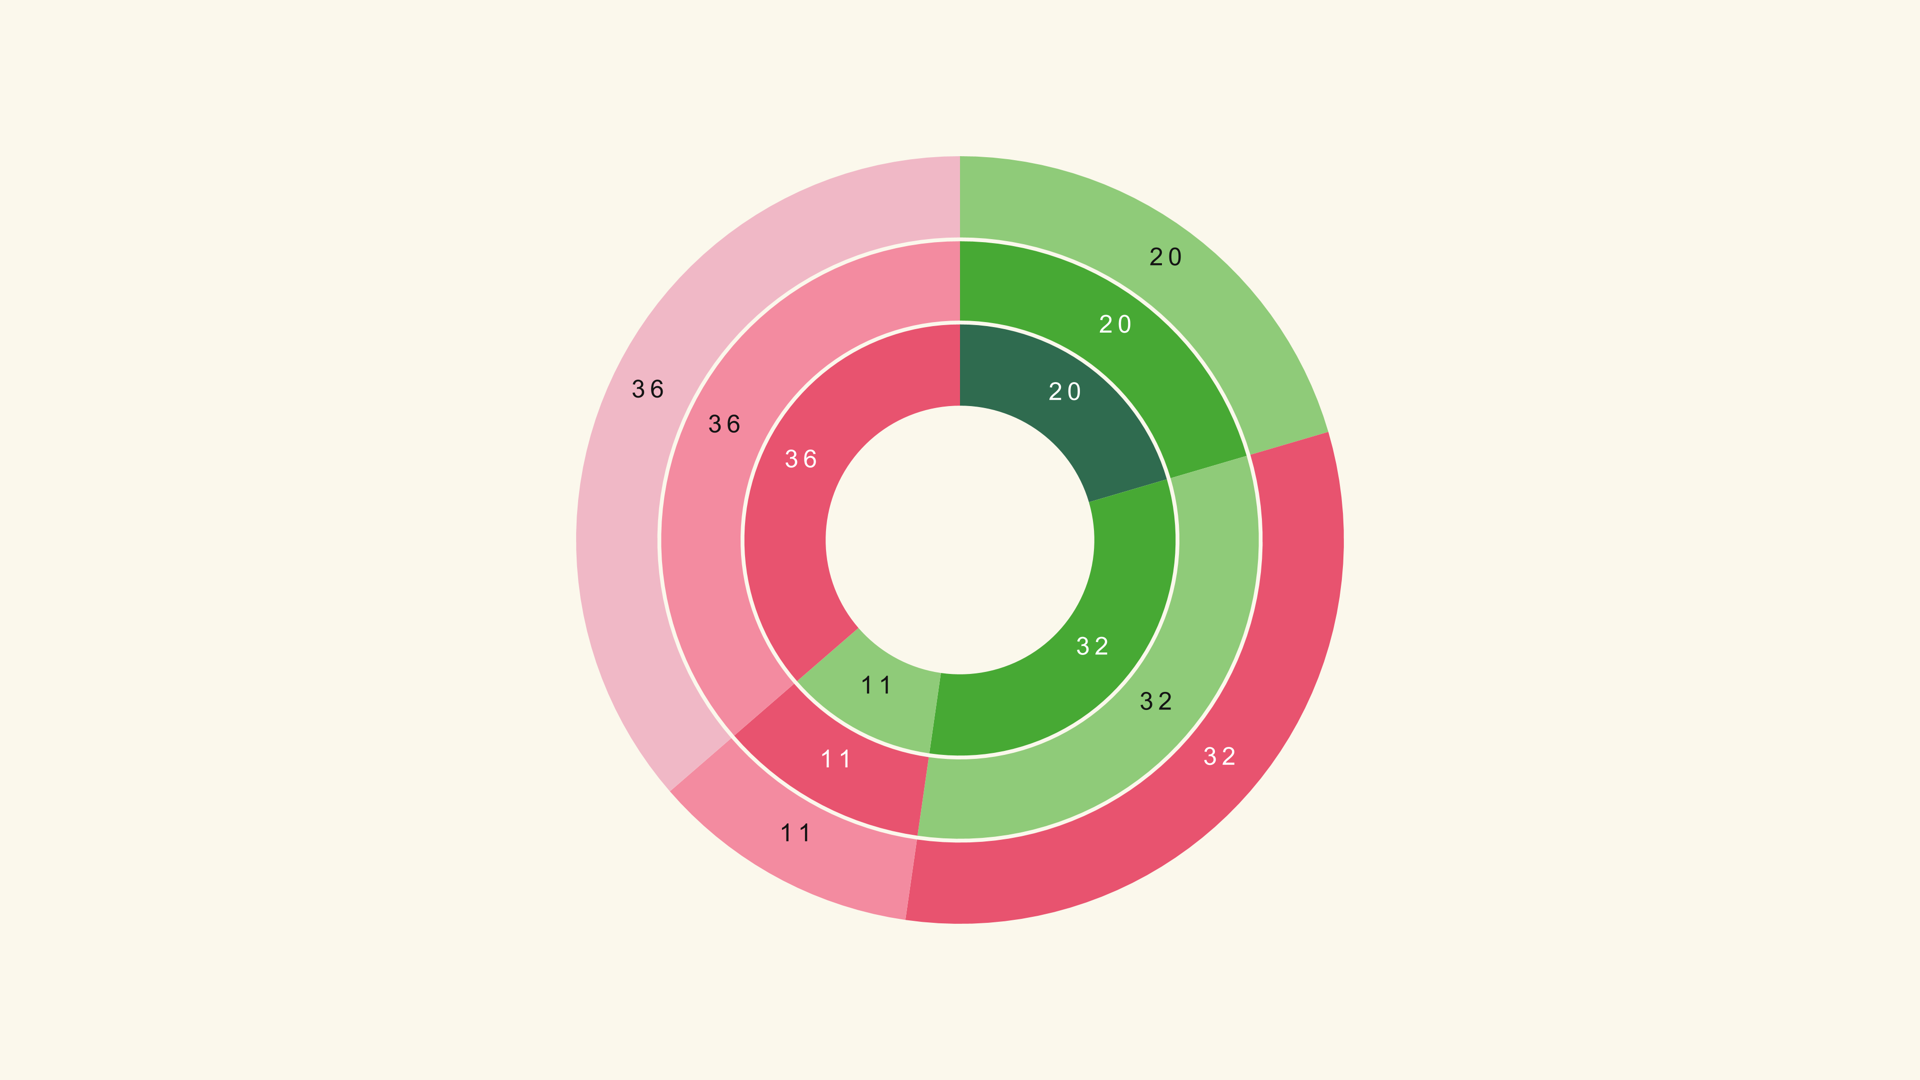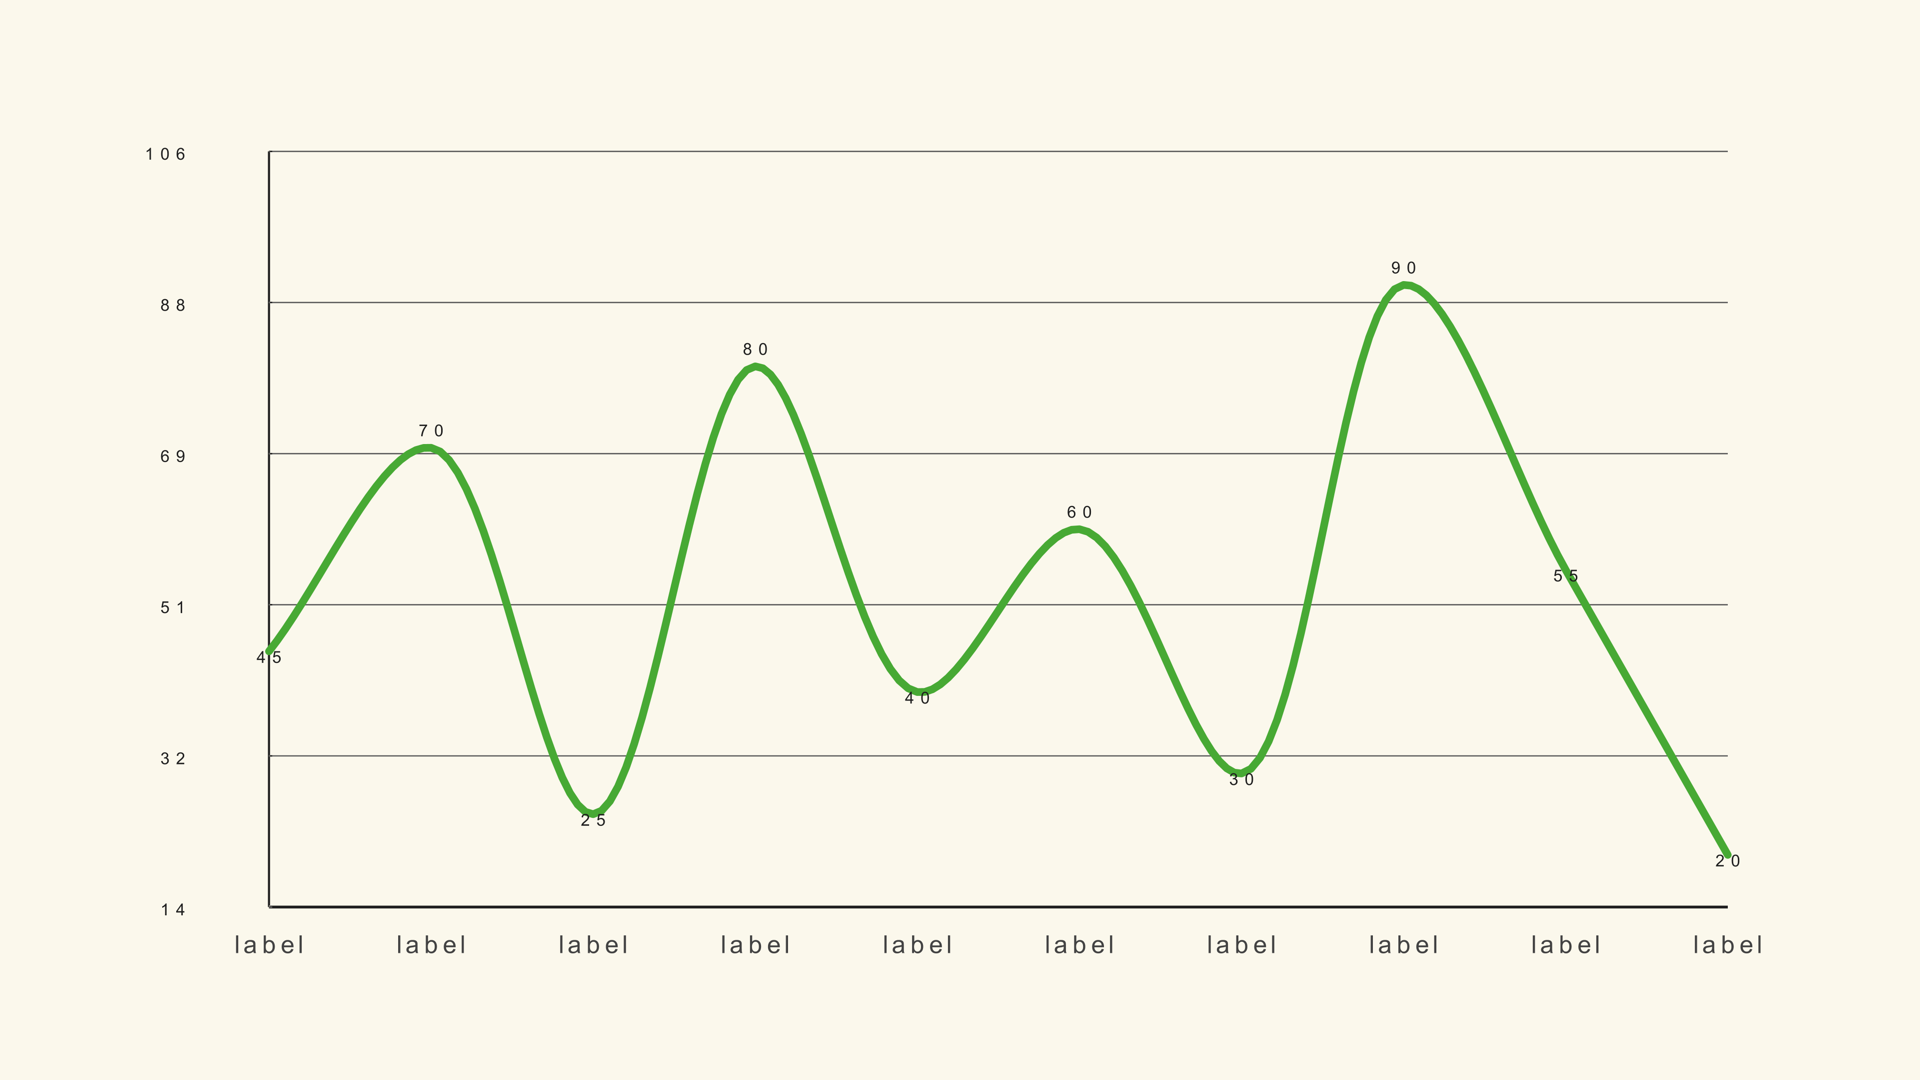
A chart animation has one job: show the viewer where to look and in what order. The motion is not there to prove that the chart is animated. It is there to make the data easier to read in the few seconds the graphic is on screen.
Every Noyris generator exposes a similar Animation page. Once you understand the shared controls, you can animate a bar chart, a line chart, a pie or a waterfall with the same timing logic. This guide covers the controls, a few timing recipes and the mistakes that make an otherwise good chart feel busy.
What the animation controls do
The Animation page is shared across most chart families. The exact style list changes with the geometry, but the timing model is consistent.
| Control | What it changes |
|---|---|
| Animate | Turns the reveal on or off. When off, the chart appears fully drawn on the first frame. |
| Animation Style | The motion vocabulary: Grow, Draw, Sweep, Slide, Fade, Rise, Pop and others depending on the chart. |
| Stagger Order | Whether elements arrive forward, reverse, from the center out or randomly. |
| Start | When the reveal begins on the timeline, in seconds. |
| Duration | How long the full reveal takes. |
| Stagger | The delay between one element and the next. |
| Easing | The acceleration curve: linear, ease-out, smooth, back, elastic and so on. |
| Exaggeration and Settle | How far the motion overshoots and how long it takes to settle. |
| Label Animation | Whether labels fade, pop or stay static. |
The total reveal time is roughly Start plus Duration plus the delay created by Stagger across the elements. If you have twenty bars and a 0.1-second stagger, the last bar does not begin until nearly two seconds after the first. That is usually too long for a chart that shares the screen with a voiceover.
Match the style to the chart
Use motion that follows the geometry. Bars grow from the baseline, lines draw along their path, pies sweep around the center, and racing bars slide into their new ranking. A fade can work for almost anything, but it carries less information than a directional reveal.
For a bar chart, Grow is the clearest default because the height is the value. For a line chart, Draw follows the time axis. For a pie or donut, Sweep mirrors the circular geometry. For a waterfall, a forward grow or a step-by-step reveal makes the running total understandable.
Reserve elastic, bounce and spring for short, playful graphics. In a news or finance sequence, an overshoot can make a serious number feel flippant. The style should match the tone of the edit, not only the shape of the chart.
Time the reveal to the voiceover
Place the playhead on the word or phrase that introduces the chart, then set Start a few frames before it. The viewer should see the first element arrive as the narration begins, not after the sentence is finished.
For a three-second graphic, a one-second reveal leaves two seconds for reading. For a five-second graphic, you can stretch the reveal to 1.2 or 1.5 seconds. If the chart needs to be read immediately, shorten the motion and let the final frame hold longer.
A practical default is 1.0 second duration and 0.05 to 0.08 seconds of stagger for a chart with six to twelve elements. Increase the duration before you increase the stagger. A longer, smooth reveal is easier to follow than a fast reveal with long empty pauses between bars.
Use stagger with purpose
Stagger creates reading order. Forward order follows the category order in the CSV, which is useful when the categories are already sorted. Reverse order can work when the story starts with the smallest or most recent item. Center-out works for a symmetrical comparison.
Random stagger is almost always a mistake for data. It hides the order the audience should follow and makes the chart feel like a decoration rather than an explanation. If you want randomness, use it in a title or background element, not in the data marks.
For a bar race, keep the stagger much shorter than the interval between time steps. The bars need to settle before the ranking changes again. For a line chart, a small stagger along the path helps the draw-on feel connected to the data points.
Tune easing and settle
Easing controls the feel. Ease Out starts quickly and slows into place, which suits a chart that needs to arrive with confidence. Ease In Out is gentler and works well for slow documentary graphics. Smooth is a safe default when you do not want to think about the curve.
Overshoot is a separate decision. A small amount of Back can give a bar a sense of weight. Too much Exaggeration, or a long Settle, makes the chart wobble after the value should already be readable. If the final frame has not settled by the time the voiceover moves on, reduce the overshoot.
Label animation should usually be quieter than the mark animation. A fade is enough for most labels. If the labels are the story, such as a ranking where the names reorder, a short pop or slide can help, but the label should never arrive after the viewer has stopped looking.
Check the final frame
Scrub to the last frame of the reveal and leave it there. Confirm that every label is visible, no bar is clipped, and the chart reads without motion. A chart that only makes sense while it is animating is not finished. The animation should lead to a stable frame the viewer can study.
Then watch the whole clip at normal speed on a phone-sized preview. This catches timing problems that are invisible when you scrub frame by frame. If a label arrives too late or a bar settles too slowly, fix the timing before you add more style.
Common mistakes
- Animating everything. If background, grid, labels and marks all move, the viewer has no focal point.
- Too much stagger. The last element arrives after the viewer has moved on.
- Random order. Data needs a readable sequence.
- Overshoot on a serious number. Motion has tone; match it to the edit.
- No hold. Leave the finished chart on screen long enough to read.
Next steps
Read How to Make Charts and Graphs in DaVinci Resolve for the full data-to-render workflow, then try the timing settings on the Bar Basic guide. If the chart needs to match a brand system, continue with How to Design Charts for Video.