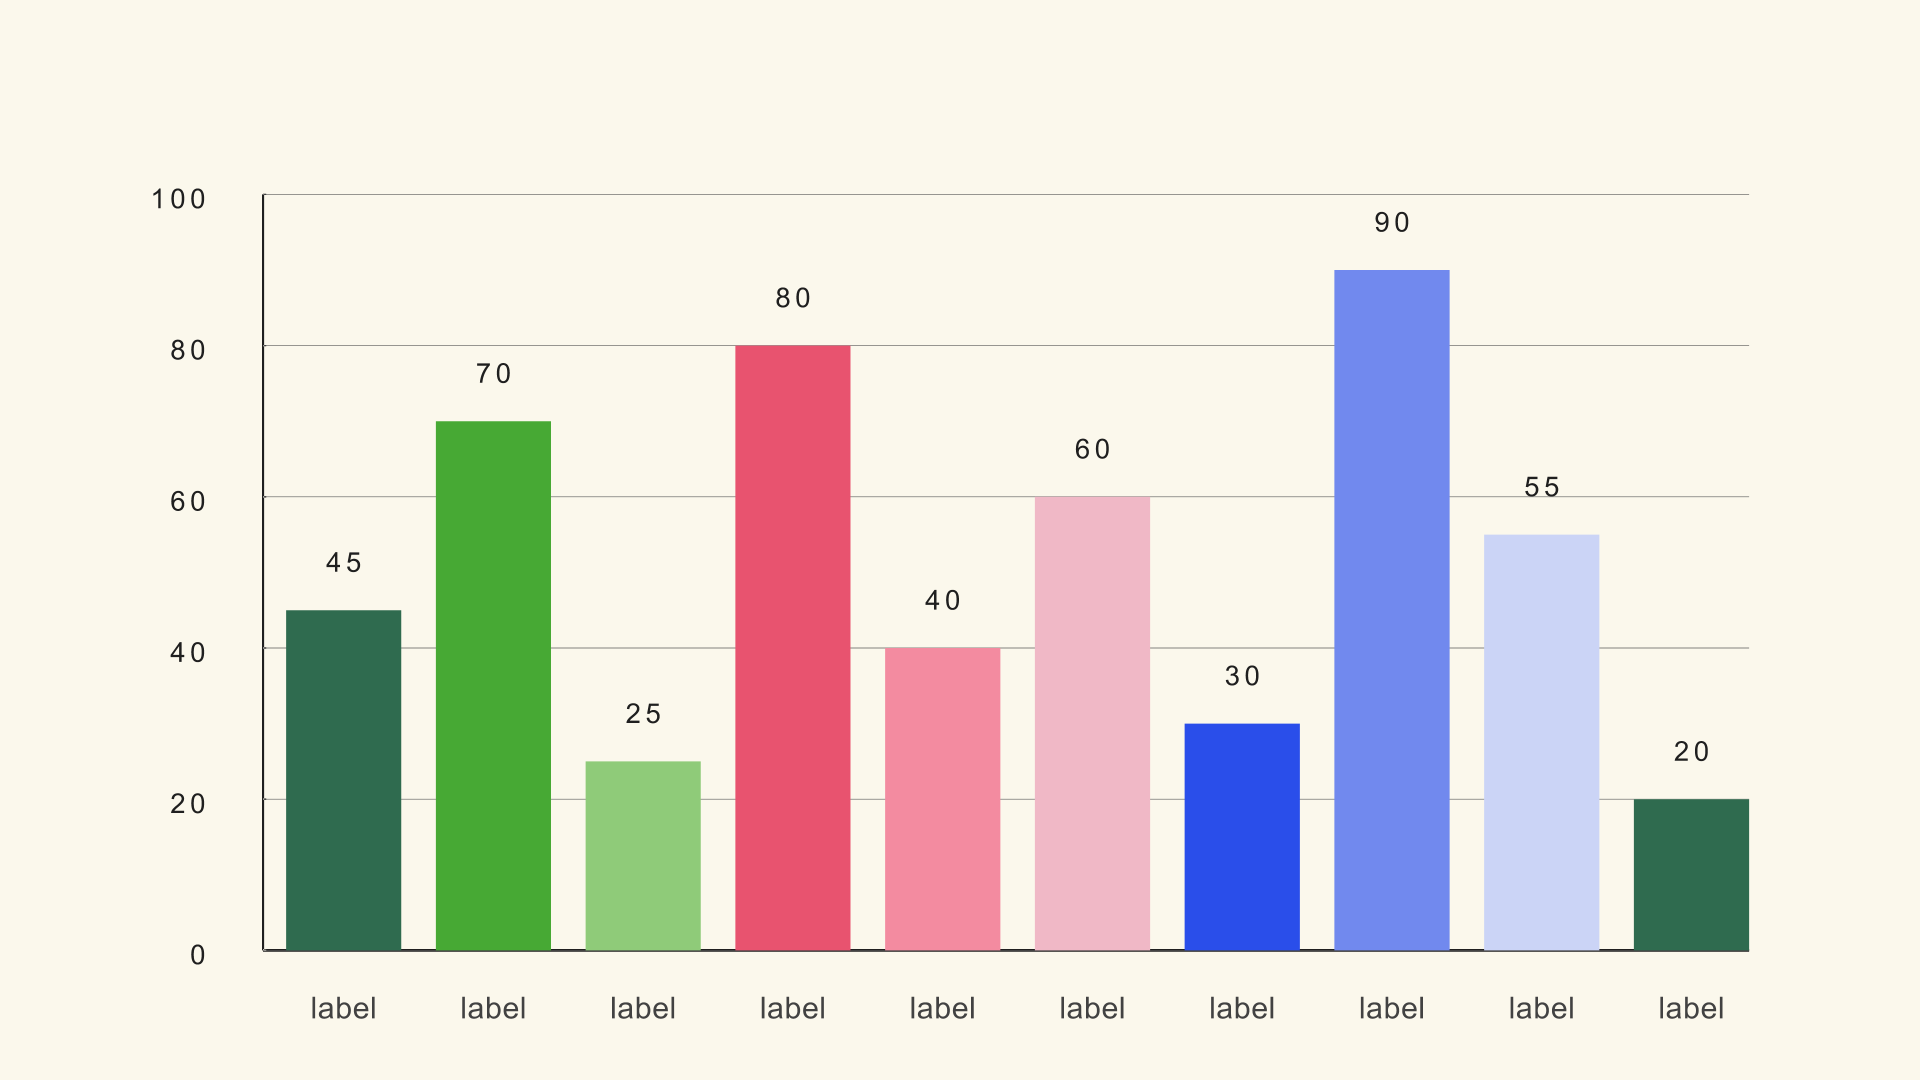
Bar Basic
Bar family · bar-basic
Noyris vertical bar chart generator (up to 100 bars).
70 controls4 Inspector pagesup to 100 bars
On this page
All 41 charts
Click a chart to open its page
Bar9
Treemap1
Candle2
Pyramid1
Sankey1
Waterfall1
Parliament1
Documentation
Noyris Charts is a pack of 41 animated chart types for DaVinci Resolve across 12 families - bar, line, area, pie, bubble, radar, treemap, candle, pyramid, sankey, waterfall and parliament - each driven by simple Inspector controls and 204 built-in color themes. This reference documents every chart, every control, and how to make it match your brand in minutes. Each chart has its own page with the full control breakdown.
41
Chart types
12
Families
204
Themes
Deep dives into the chart types editors ask about most: when to use them, the exact CSV shape, the settings worth changing first and a sample file you can load today.
Bar Basic
Bar family · chart guide
Bar Stacked
Bar family · chart guide
Bar Race
Bar family · chart guide
Line Basic
Line family · chart guide
Pie Basic
Pie family · chart guide
Pie Donut
Pie family · chart guide
Candle Body
Candle family · chart guide
Candle Wick
Candle family · chart guide
Sankey
Sankey family · chart guide
Waterfall
Waterfall family · chart guide
Treemap Basic
Treemap family · chart guide
Scatter Plot
Bubble family · chart guide
Noyris Charts install as native Fusion generators - no plugins, no Studio-only features, no manual Lua. You drag one file onto the Fusion page once, restart Resolve, and all 41 charts are ready. The thumbnails are baked into the installer, so there is nothing to render.
Drag the installer onto the Fusion page
Unzip the download to get NoyrisCharts_Installer.lua. Open DaVinci Resolve, open any project, switch to the Fusion page, then drag the .lua file straight onto the Fusion page. In one drop it installs all 41 fuses, both generator libraries (Edit and Fusion) and all 41 preview thumbnails - there is nothing else to run. If it overwrites an existing file it leaves a .noyrisbackup copy beside it.
Fully quit Resolve, then reopen
Quit out completely (Cmd+Q / Ctrl+Q) and reopen. Resolve only scans Fuses, generators and thumbnails at startup, so the restart is the step that makes the charts appear.
Find them under Generators
Effects → Generators → "Noyris Charts" on the Edit and Cut pages (and the Generators bin in the Fusion page) now lists all 41 charts, each with its own thumbnail.
Drag a chart and edit it
Drag any chart onto a new clip. Select it, open the Inspector, and the Data / Layout / Style / Animation tabs hold every control. Enter values or load a CSV and pick one of the 204 themes - it animates immediately.
Scripts menu: copy NoyrisCharts_Installer.lua into your Fusion Scripts/Comp folder (macOS: ~/Library/Application Support/Blackmagic Design/DaVinci Resolve/Fusion/Scripts/Comp) and run it from Workspace → Scripts → Comp. No-script install: unzip NoyrisCharts_Manual_Install directly into your Fusion support folder - it mirrors the layout (Fuses → Fuses, EditTemplates → Templates/Edit/Generators/Noyris Charts, FusionTemplates → Templates/Fusion/Generators/Noyris Charts, Thumbs → both generator folders). Previews ship with the pack, so there is nothing to render. Restart Resolve and the generators appear under Effects → Generators. The only time you need Workspace → Scripts → Comp → RenderThumbs is if you later change a chart's .fuse and want to refresh its thumbnail.
Charts are grouped by family. Every card shows the chart's real Inspector controls - number of controls, names, defaults, min–max ranges, and a plain-language description of what each control does - generated from the .fuse source. Open any chart's full page to explore every control grouped by Inspector page.
Comparisons, rankings, values across categories. Best when exact magnitudes matter.
Bar family · bar-basic
Noyris vertical bar chart generator (up to 100 bars).
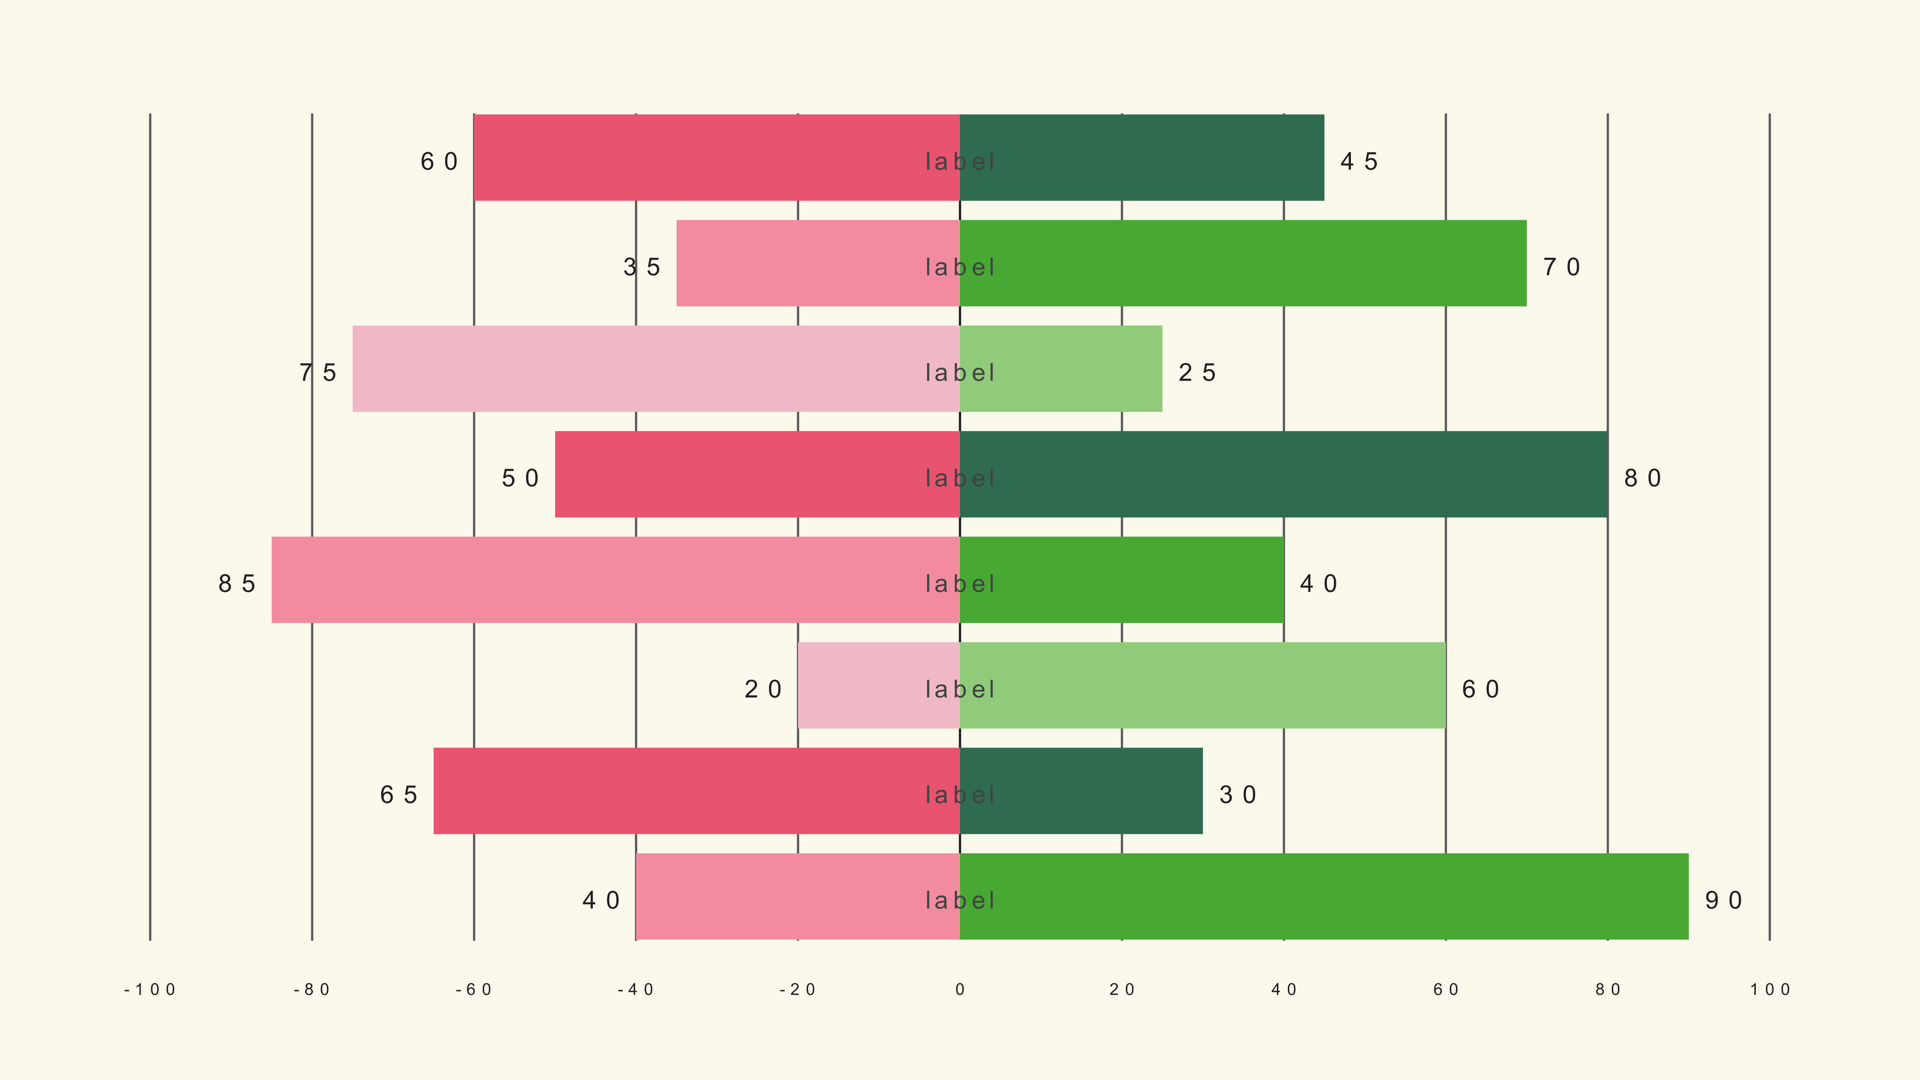
Bar family · bar-diverging
Noyris diverging horizontal bar chart generator (up to 100 bars).
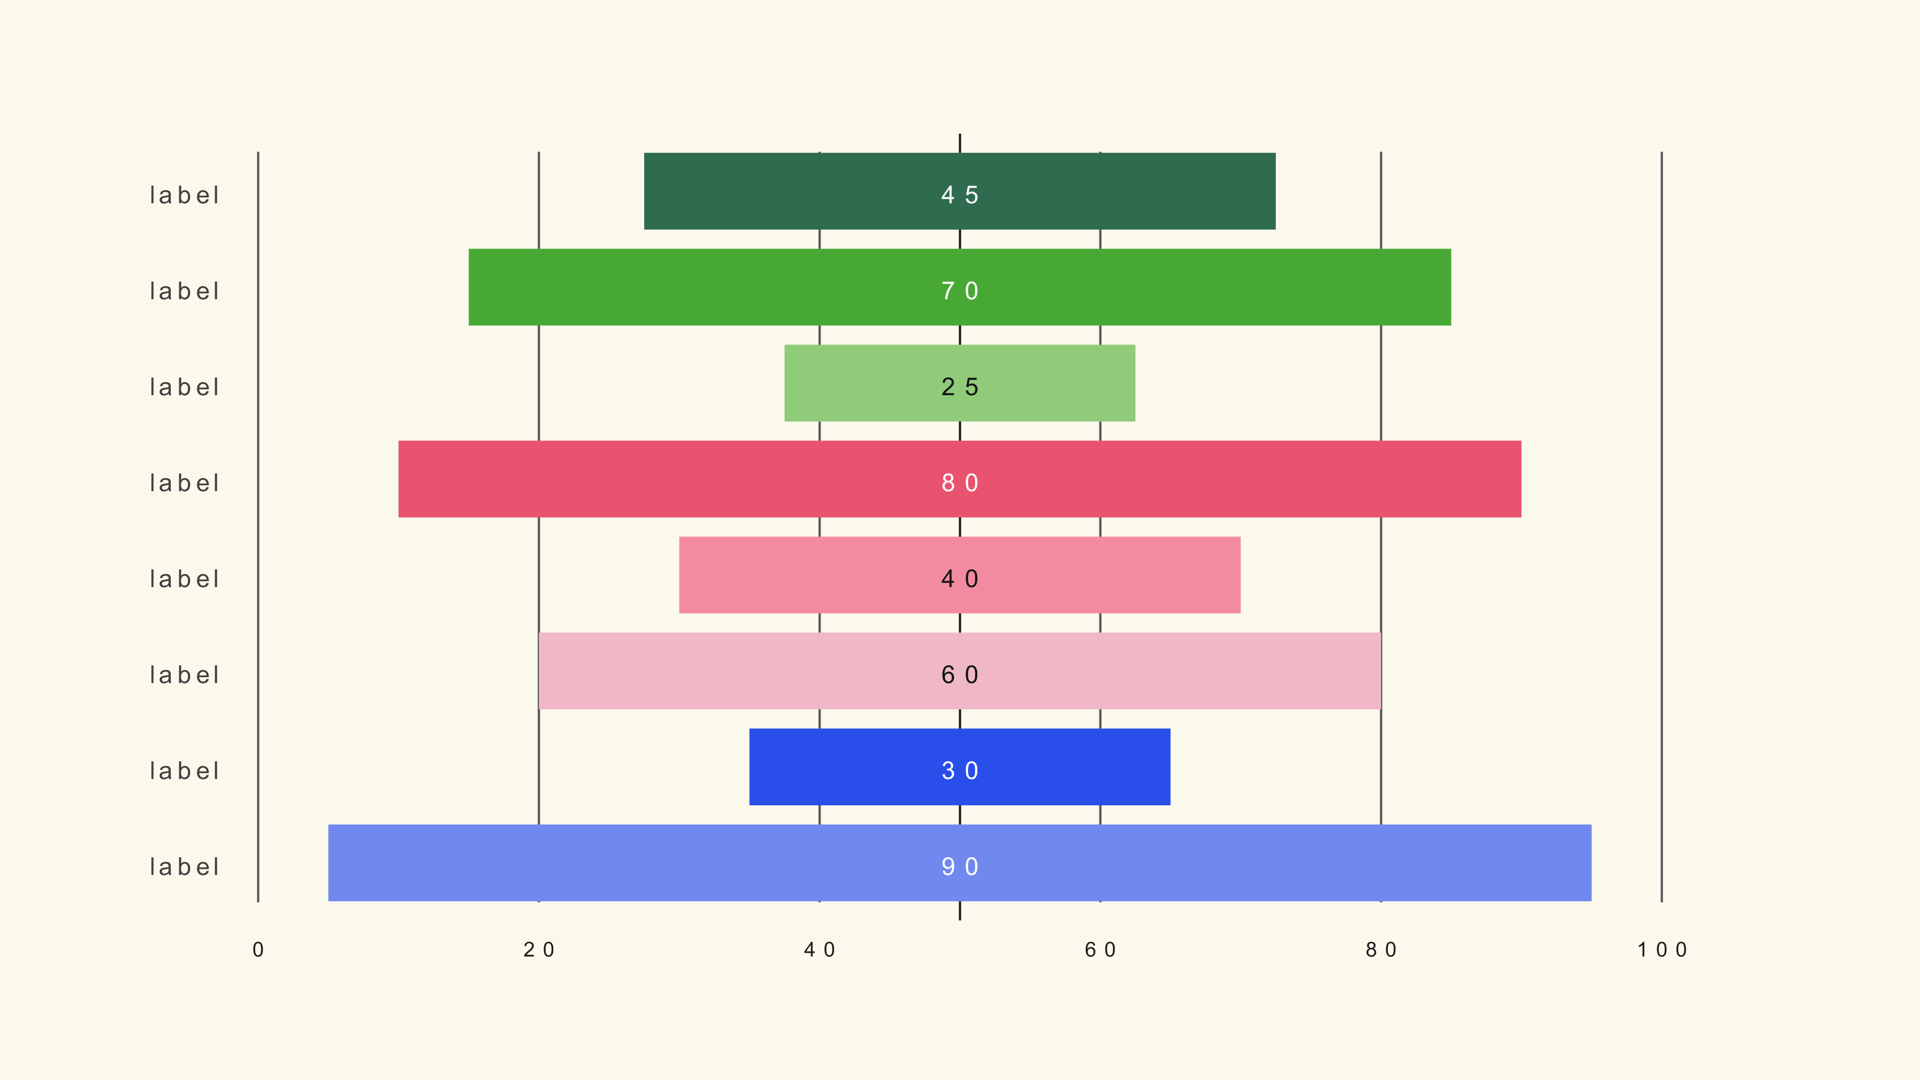
Bar family · bar-funnel
Noyris funnel chart generator - centered horizontal rows whose width scales with value (up to 100 bars).
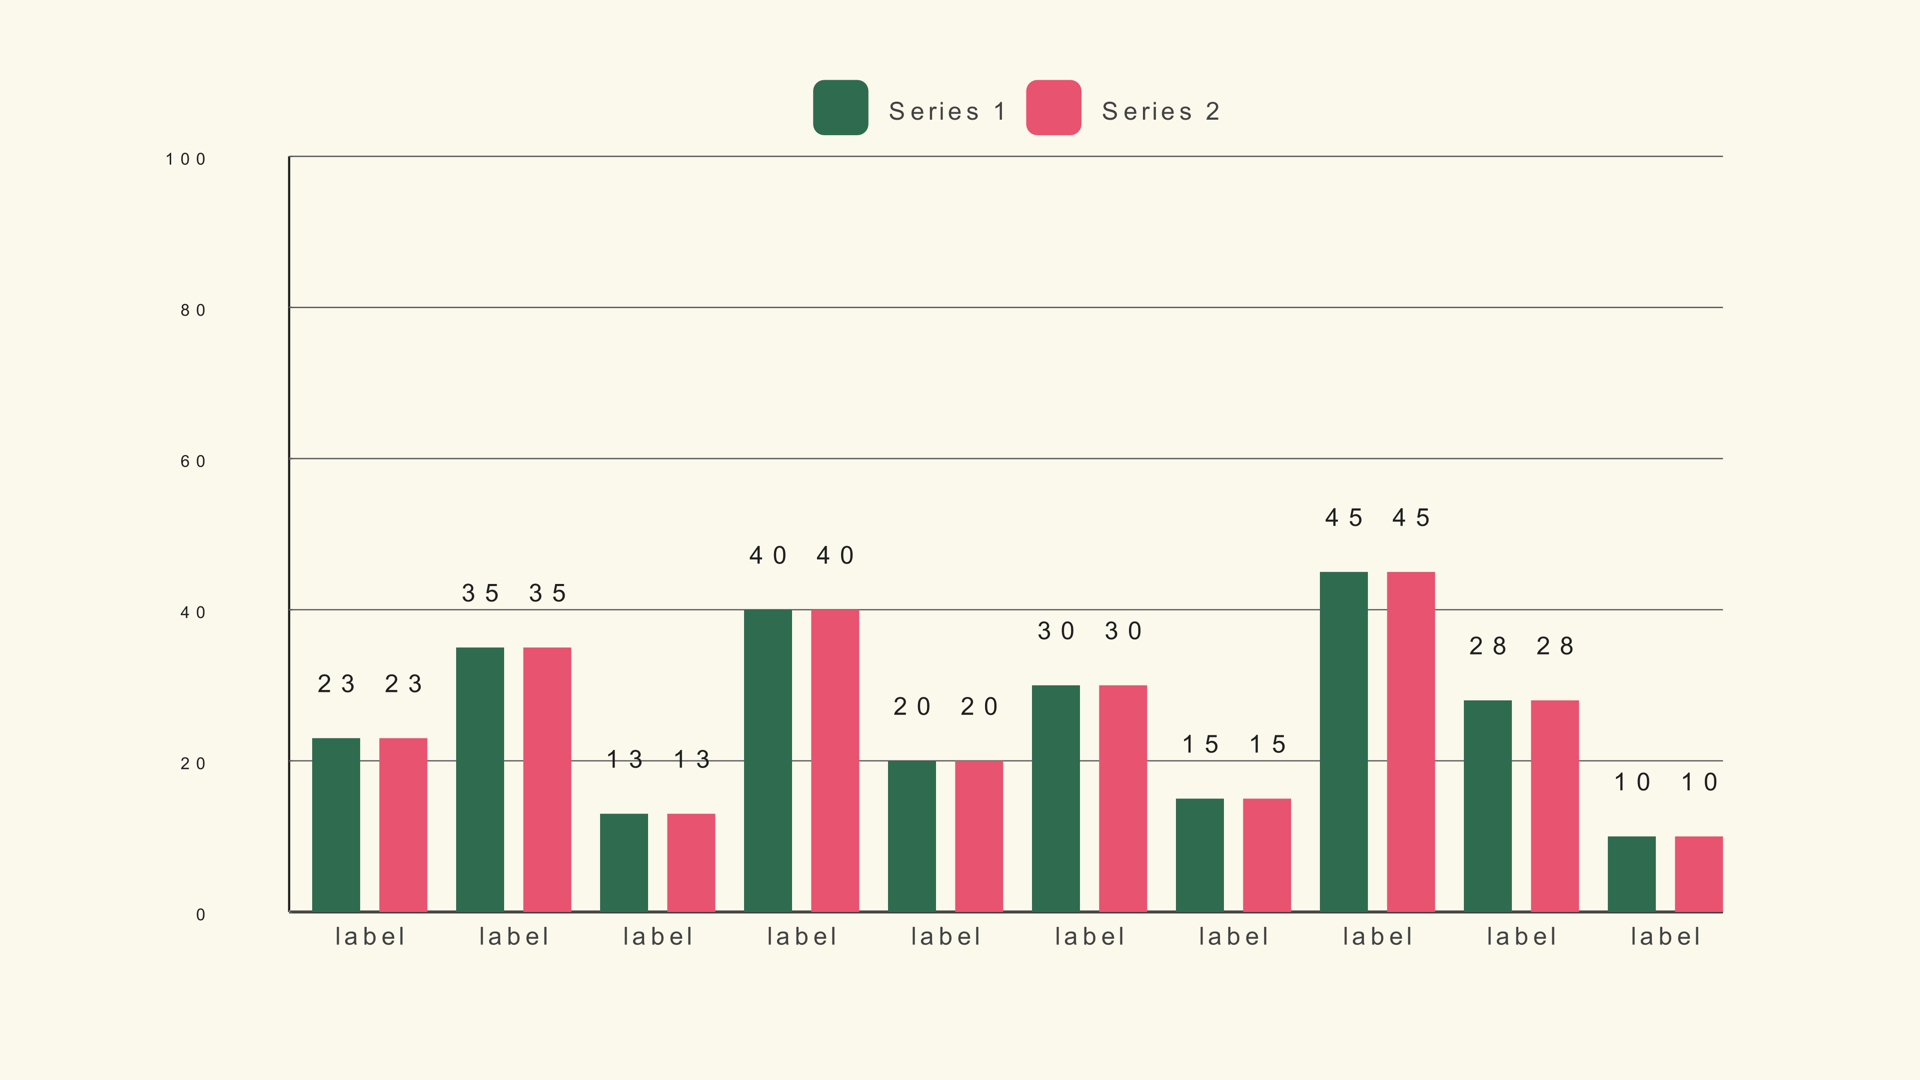
Bar family · bar-grouped
Noyris multi-series grouped (side-by-side) vertical bar chart generator (up to 50 bars, 5 series).
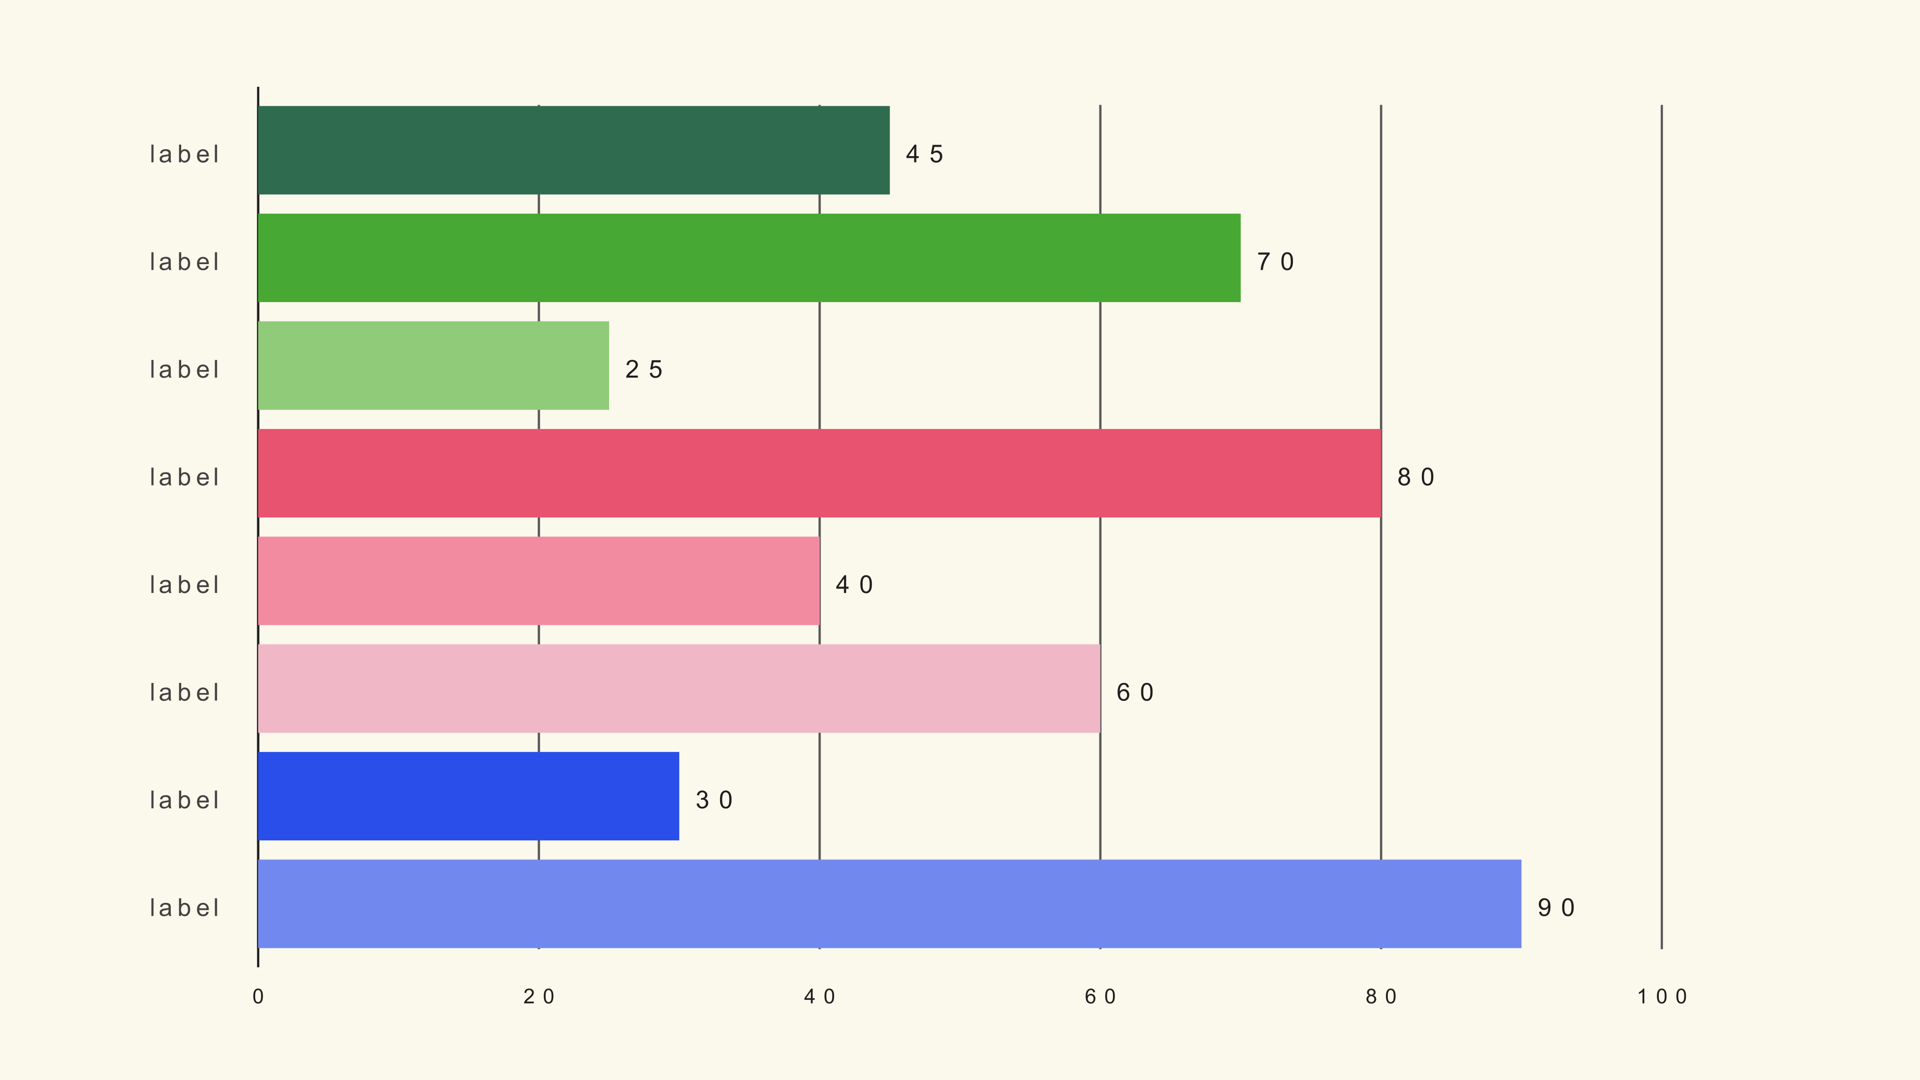
Bar family · bar-horizontal
Noyris horizontal bar chart generator (up to 100 bars).
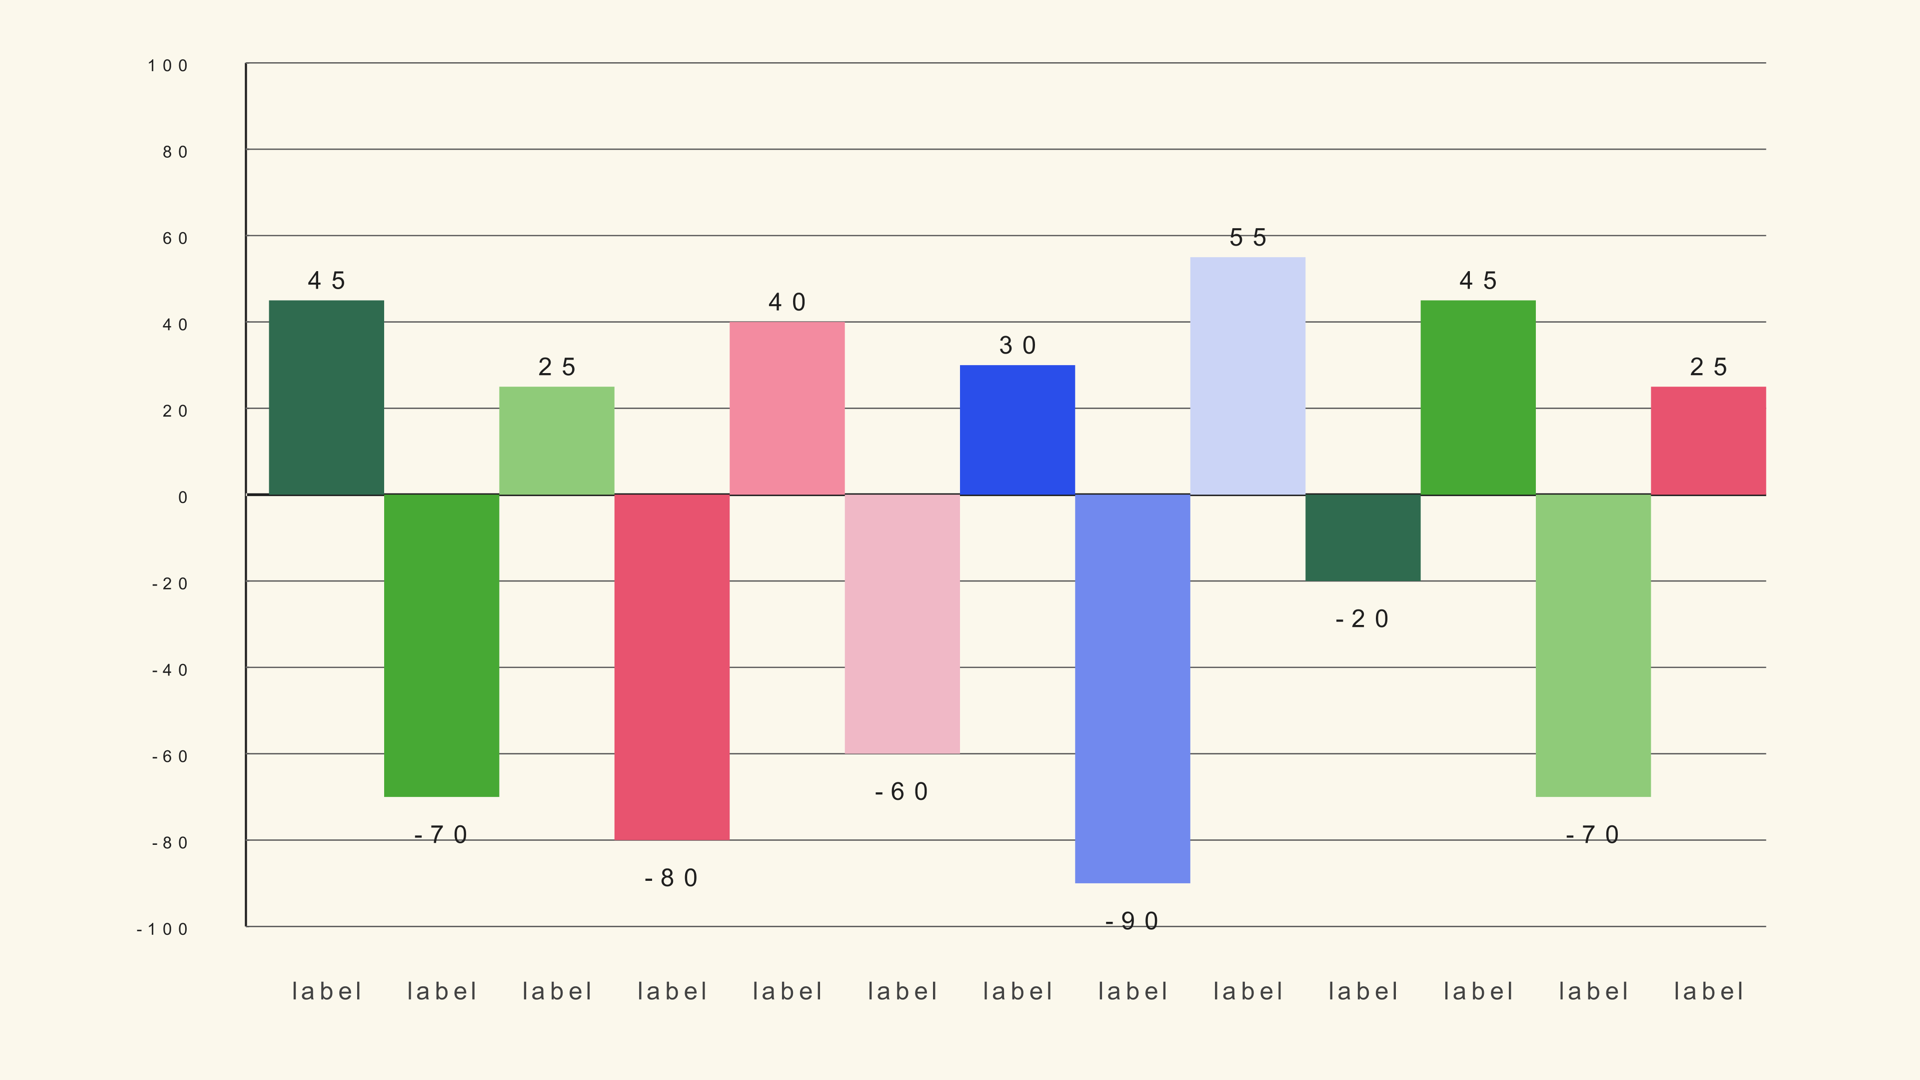
Bar family · bar-negative
Noyris vertical bar chart generator with negative values.
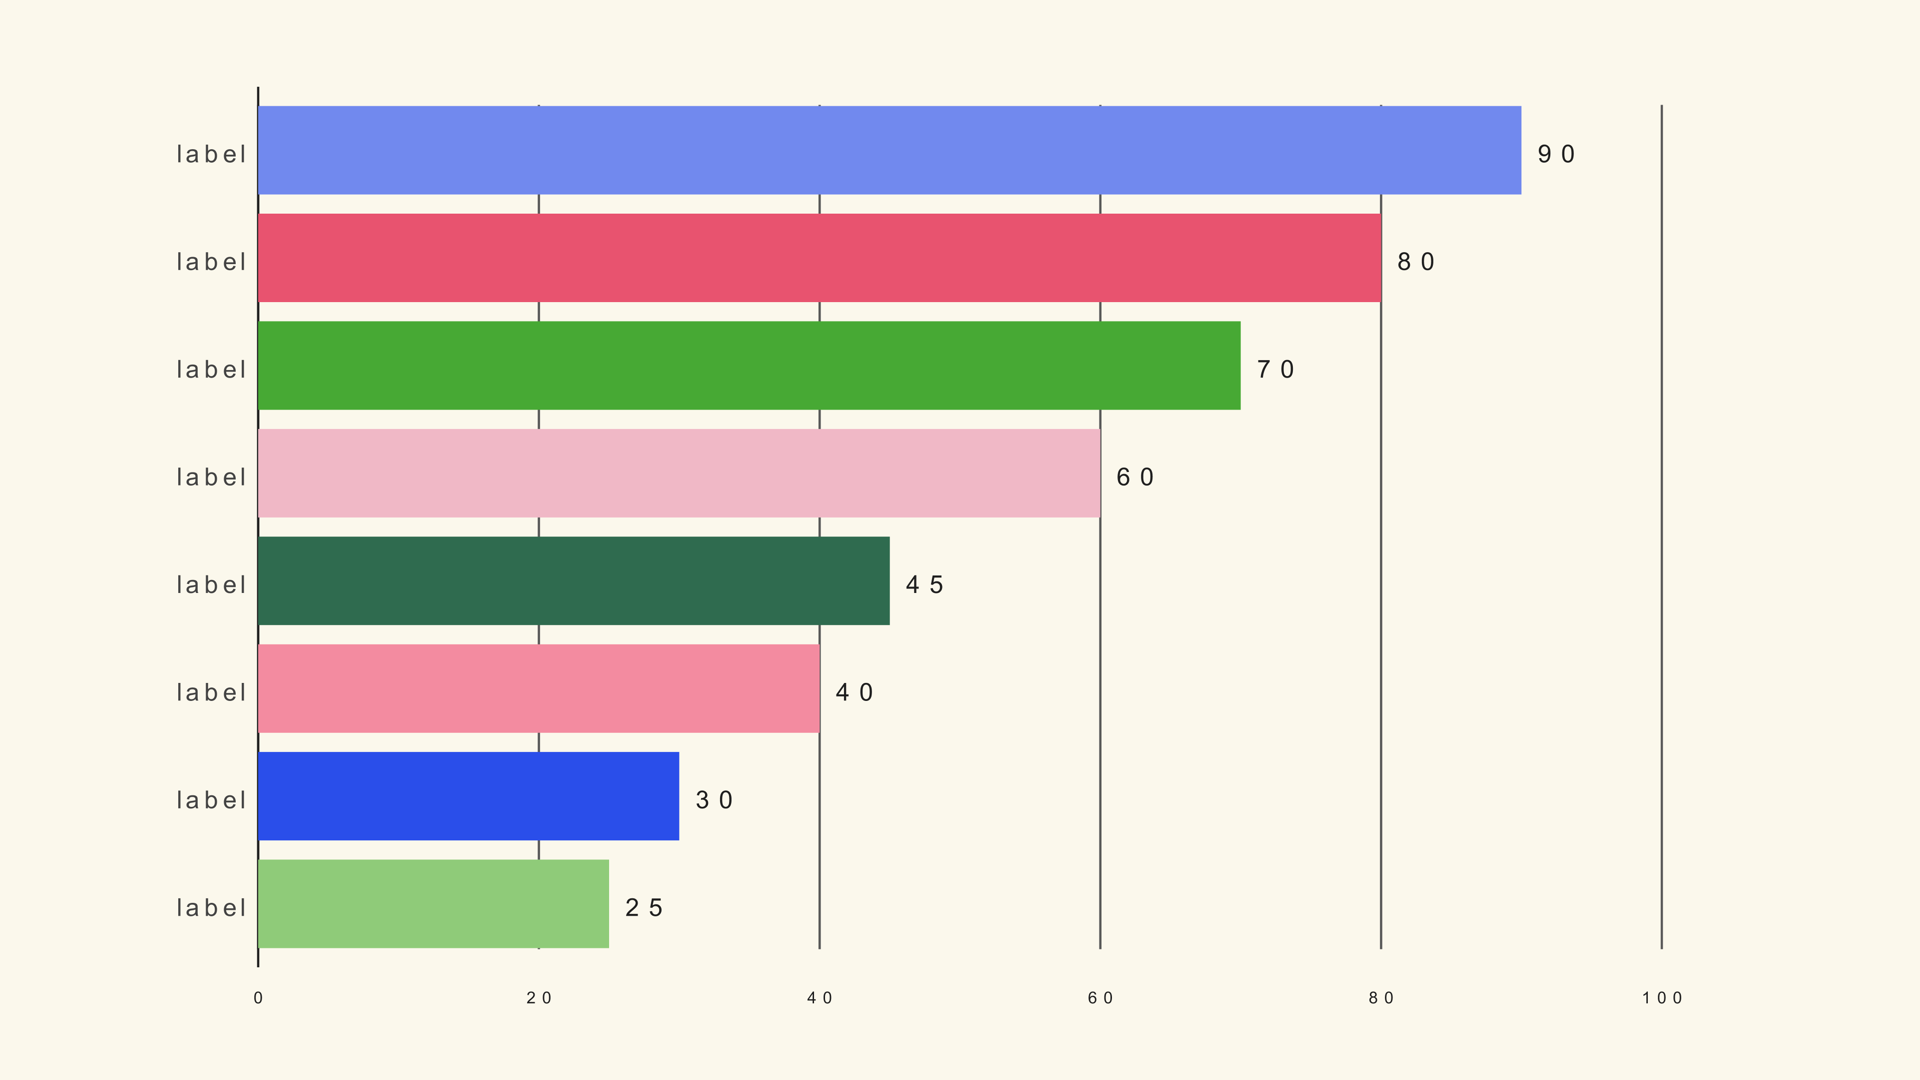
Bar family · bar-race
Noyris racing horizontal bar chart generator, sorted by value (up to 100 bars).
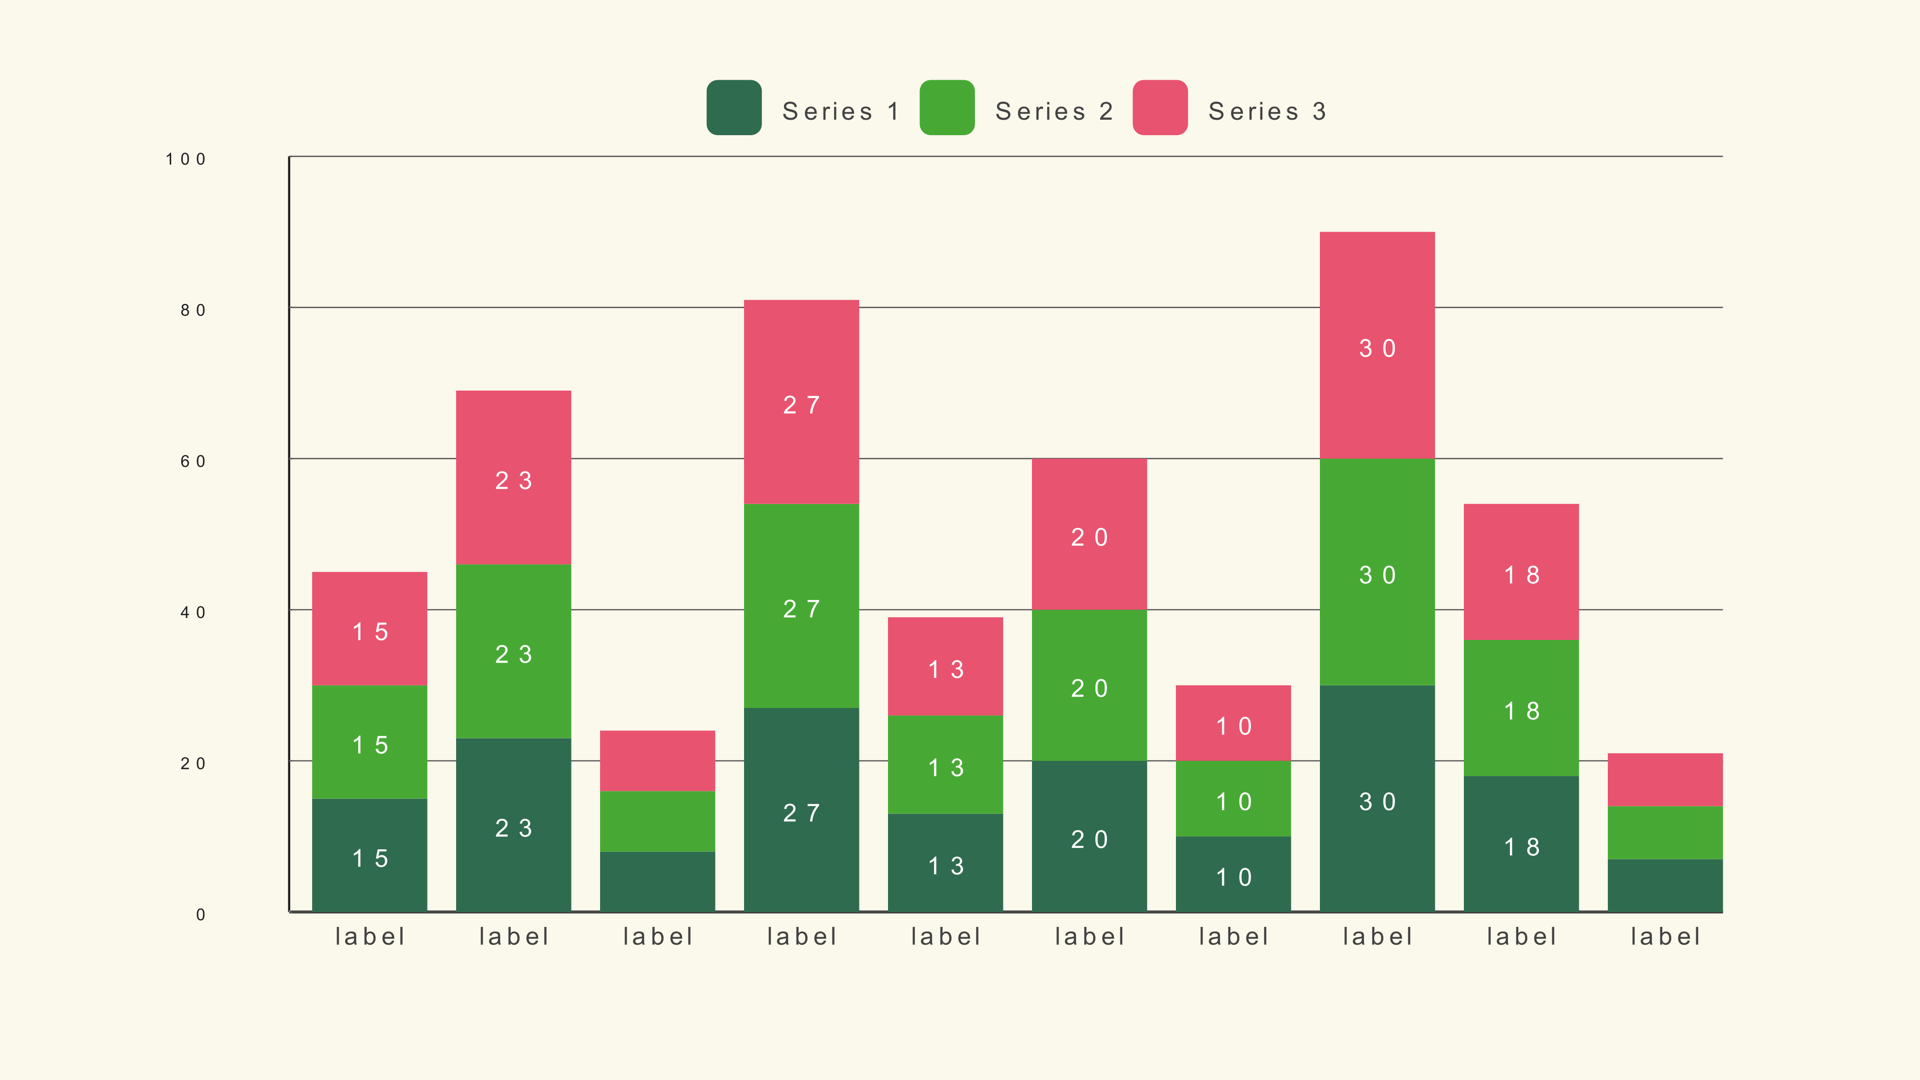
Bar family · bar-stacked
Noyris multi-series stacked vertical bar chart generator (up to 50 bars, 5 series).
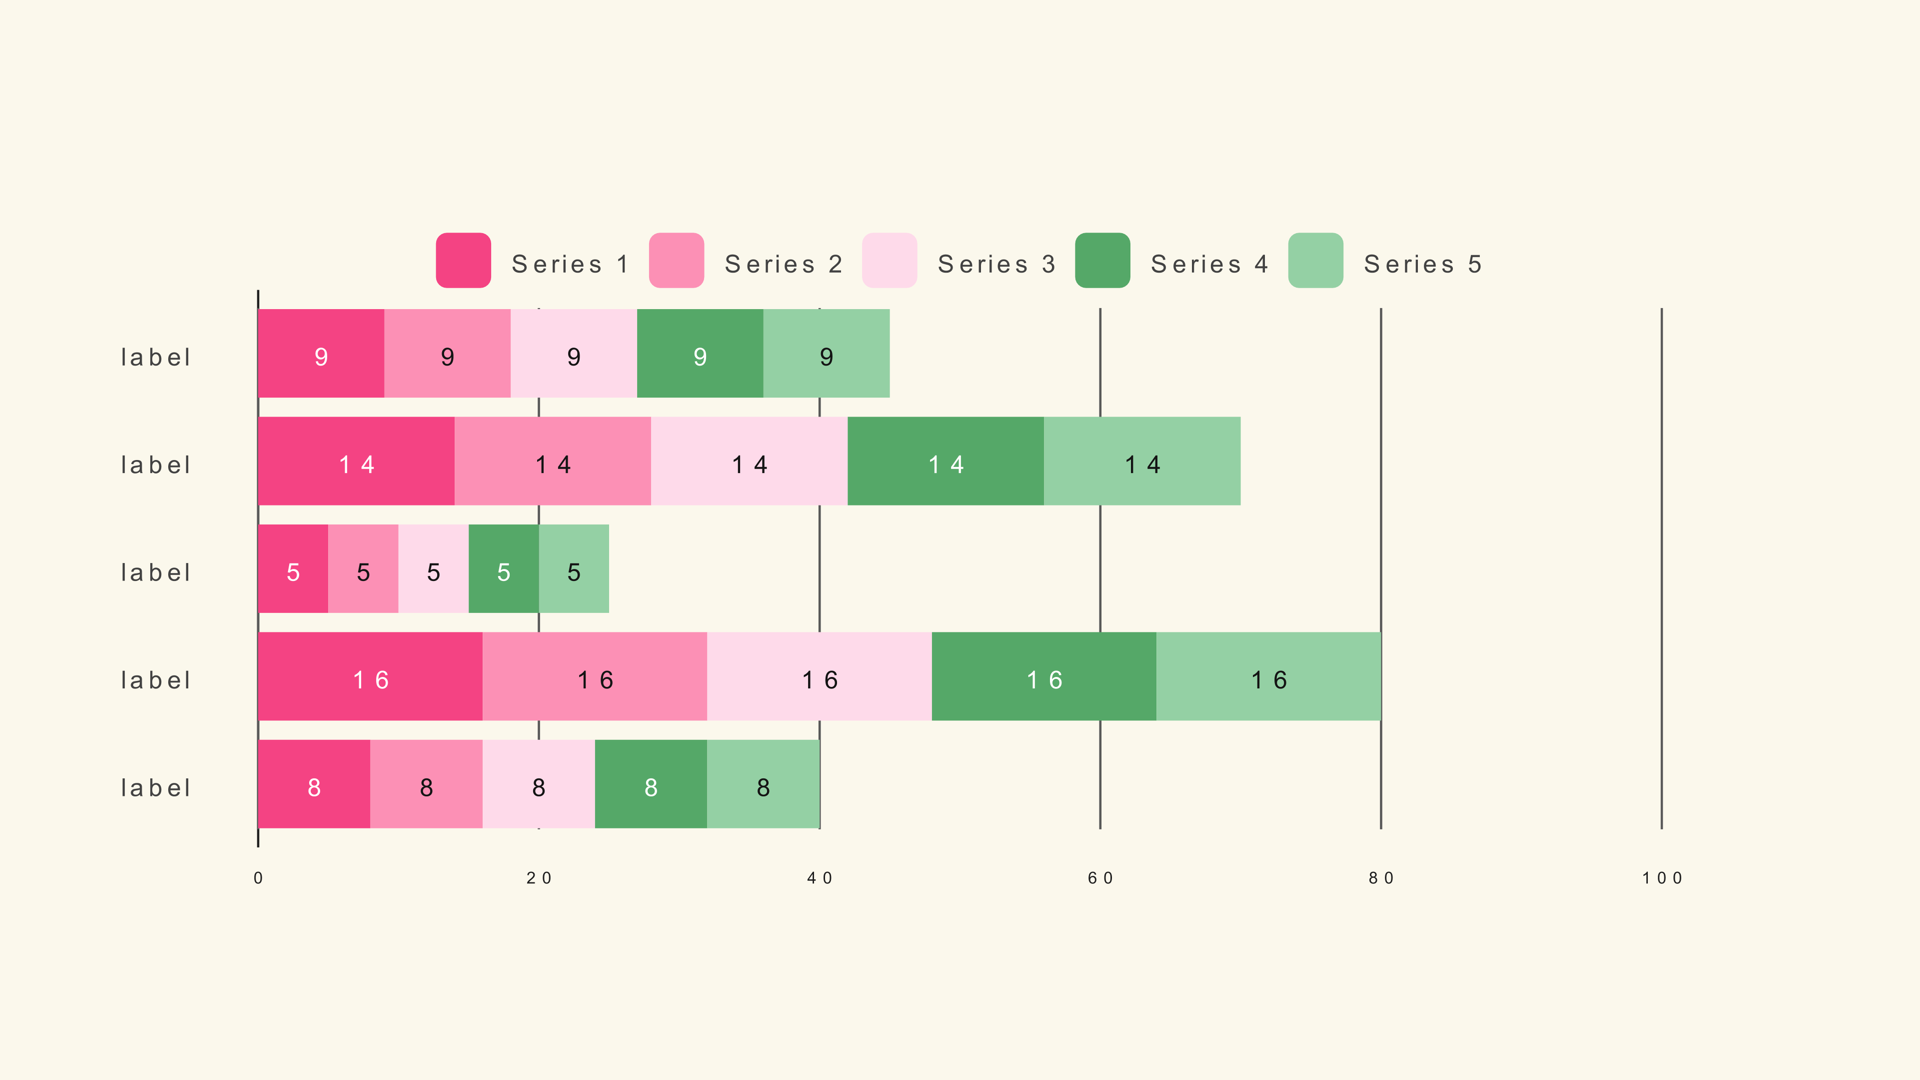
Bar family · bar-stacked-horizontal
Noyris multi-series stacked horizontal bar chart generator (Bars + Series sliders, 1..10 each, default 5).
Trends over time. Best for continuous data where direction and shape matter.
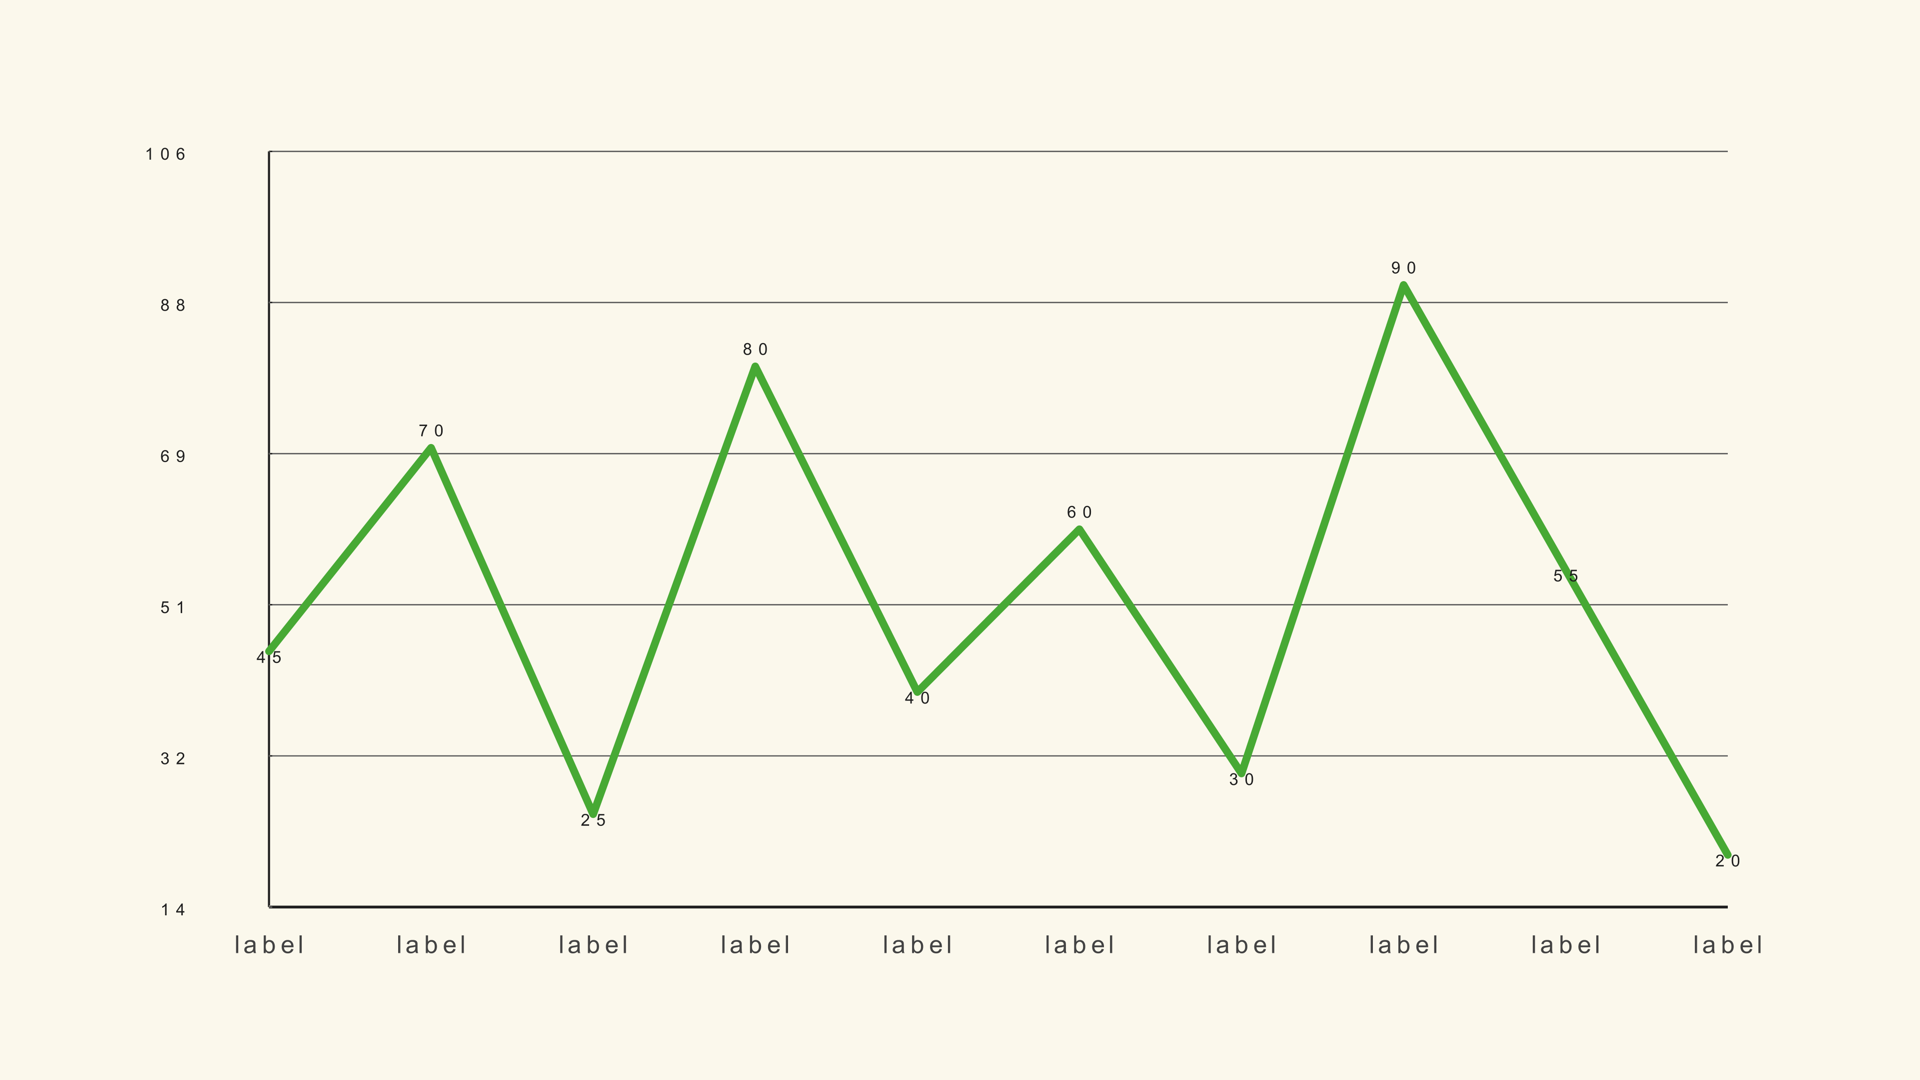
Line family · line-basic
Noyris single-series line chart generator (up to 100 points).
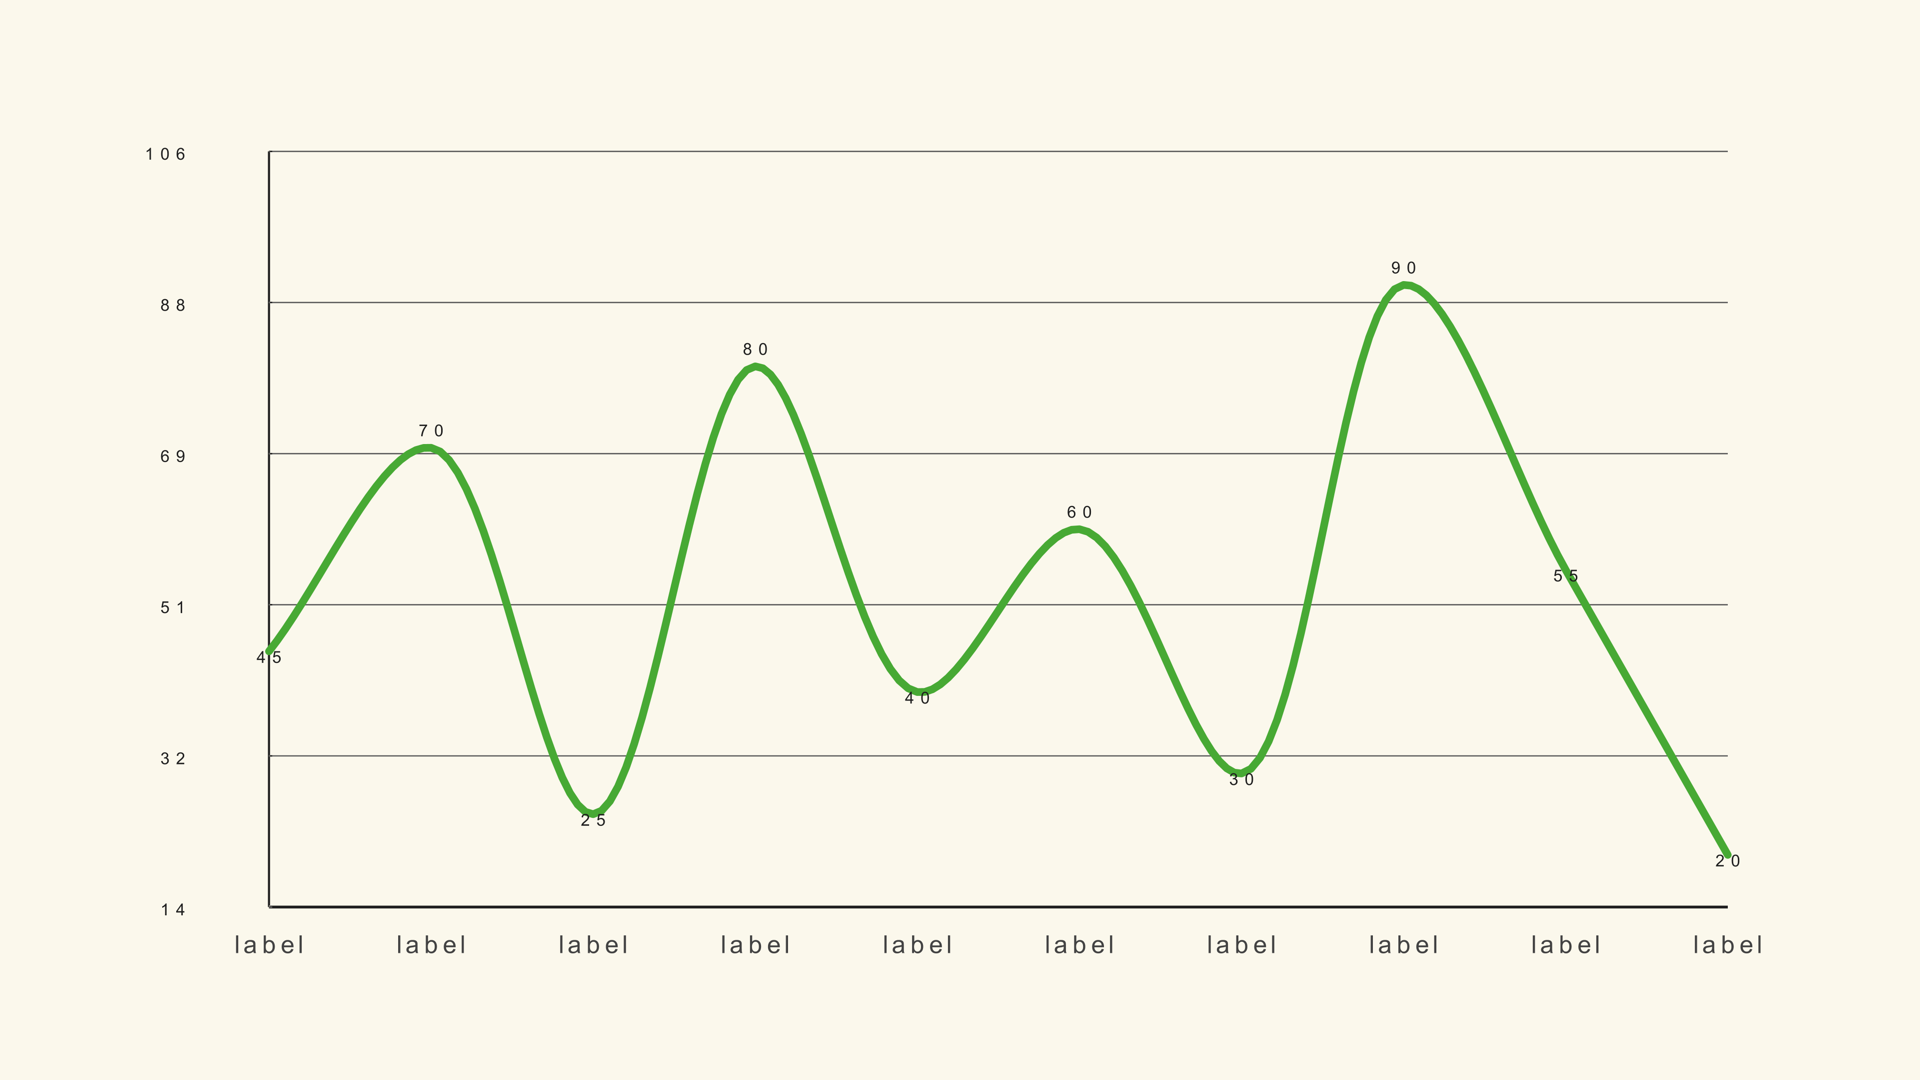
Line family · line-smooth
Noyris smooth single-series line chart generator (Catmull-Rom curves, up to 100 points).
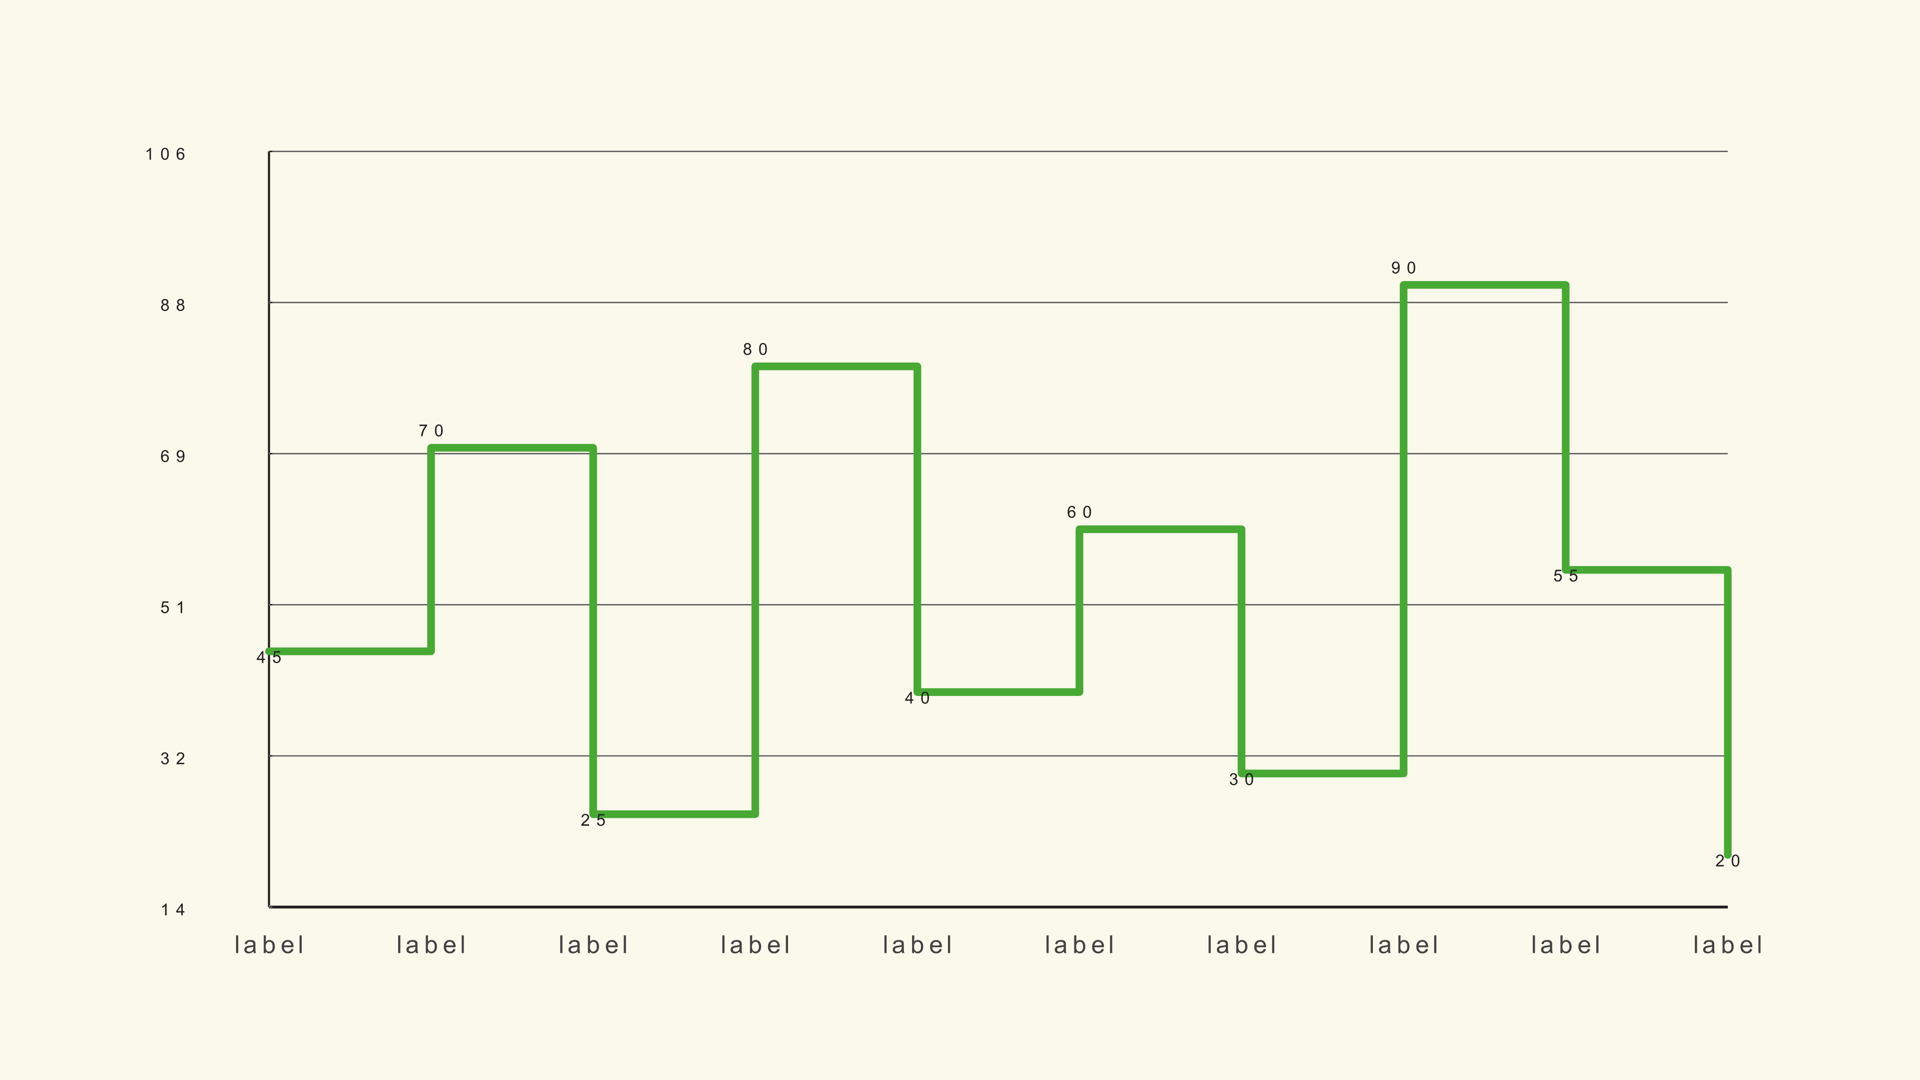
Line family · line-step
Noyris left-step staircase single-series line chart generator (up to 100 points).
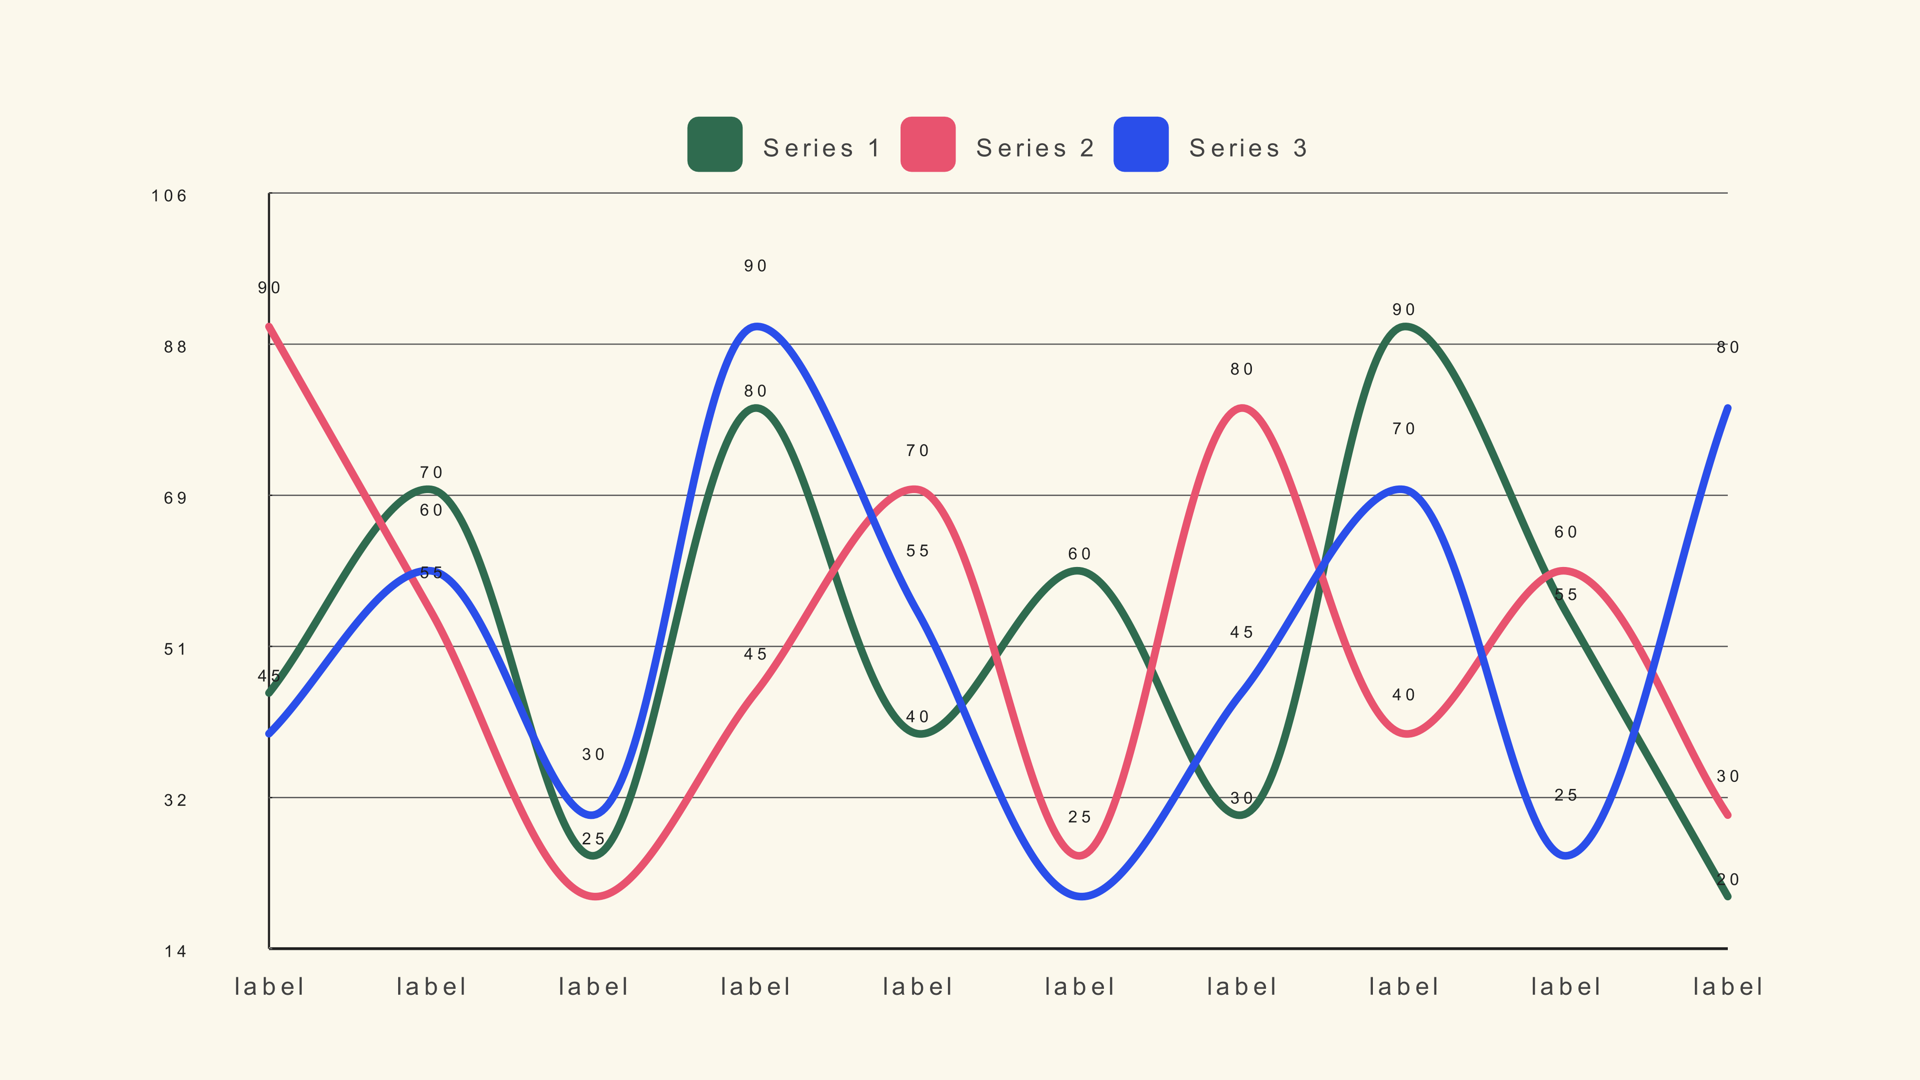
Line family · multi-line
Noyris multi-series line chart generator (up to 5 series, up to 100 points).
Trends with a sense of magnitude. Filled area reads as volume or cumulative weight.
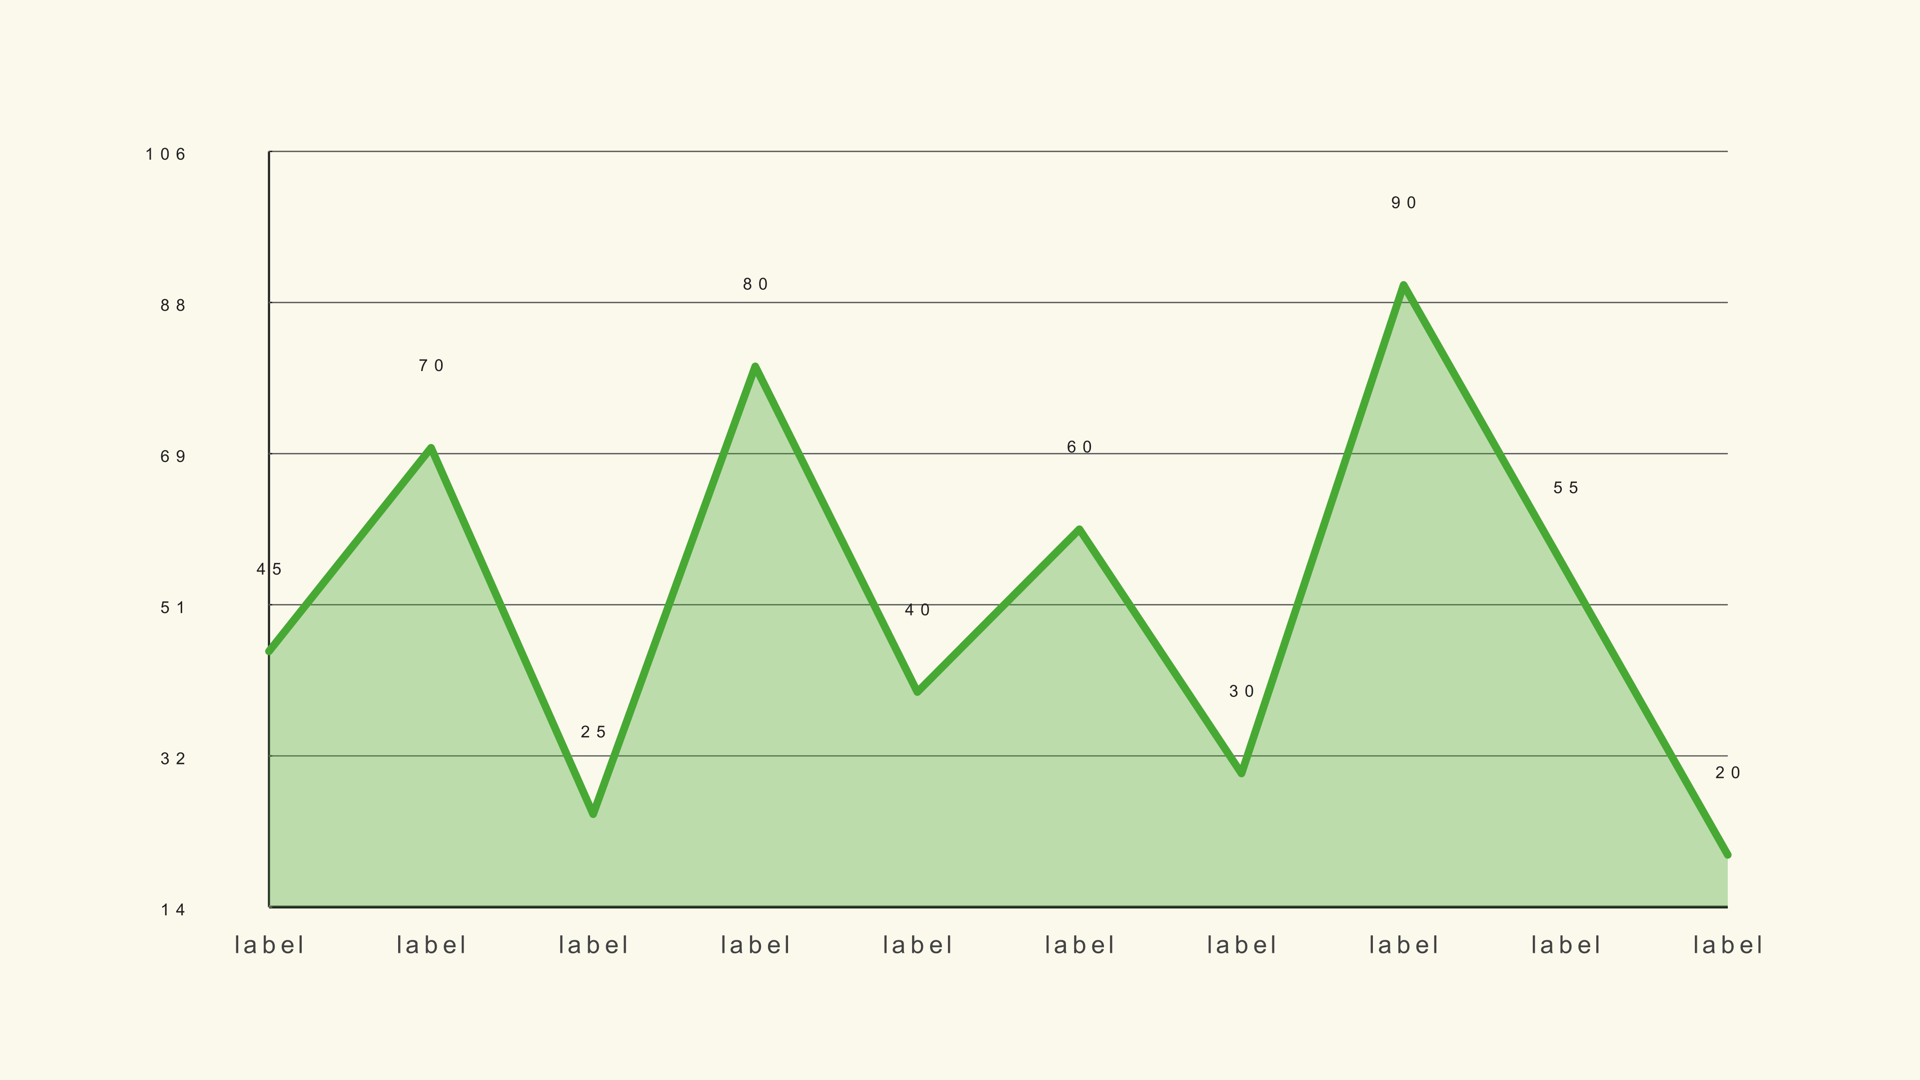
Area family · area-basic
Noyris single-series filled area chart generator (up to 100 points).
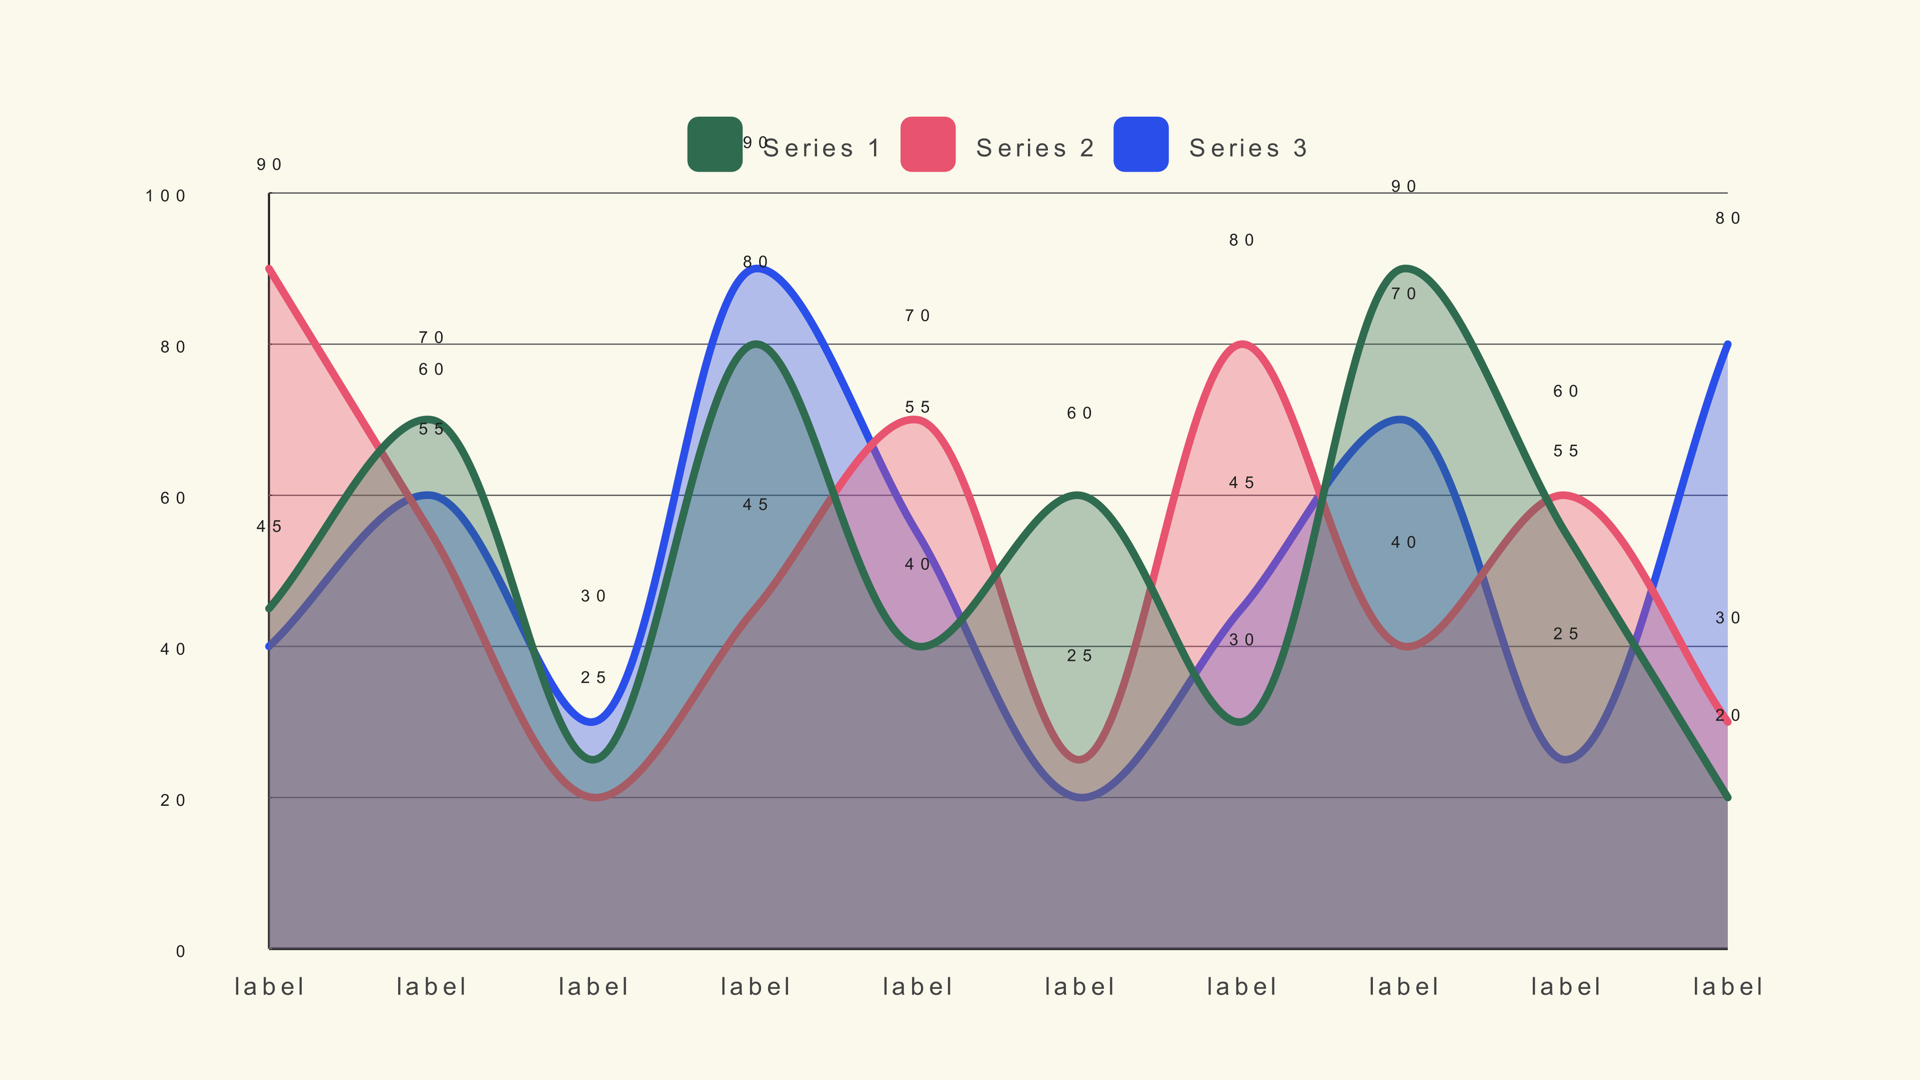
Area family · area-multi
Noyris multi-series (up to 5) stacked filled area chart generator (up to 40 points).
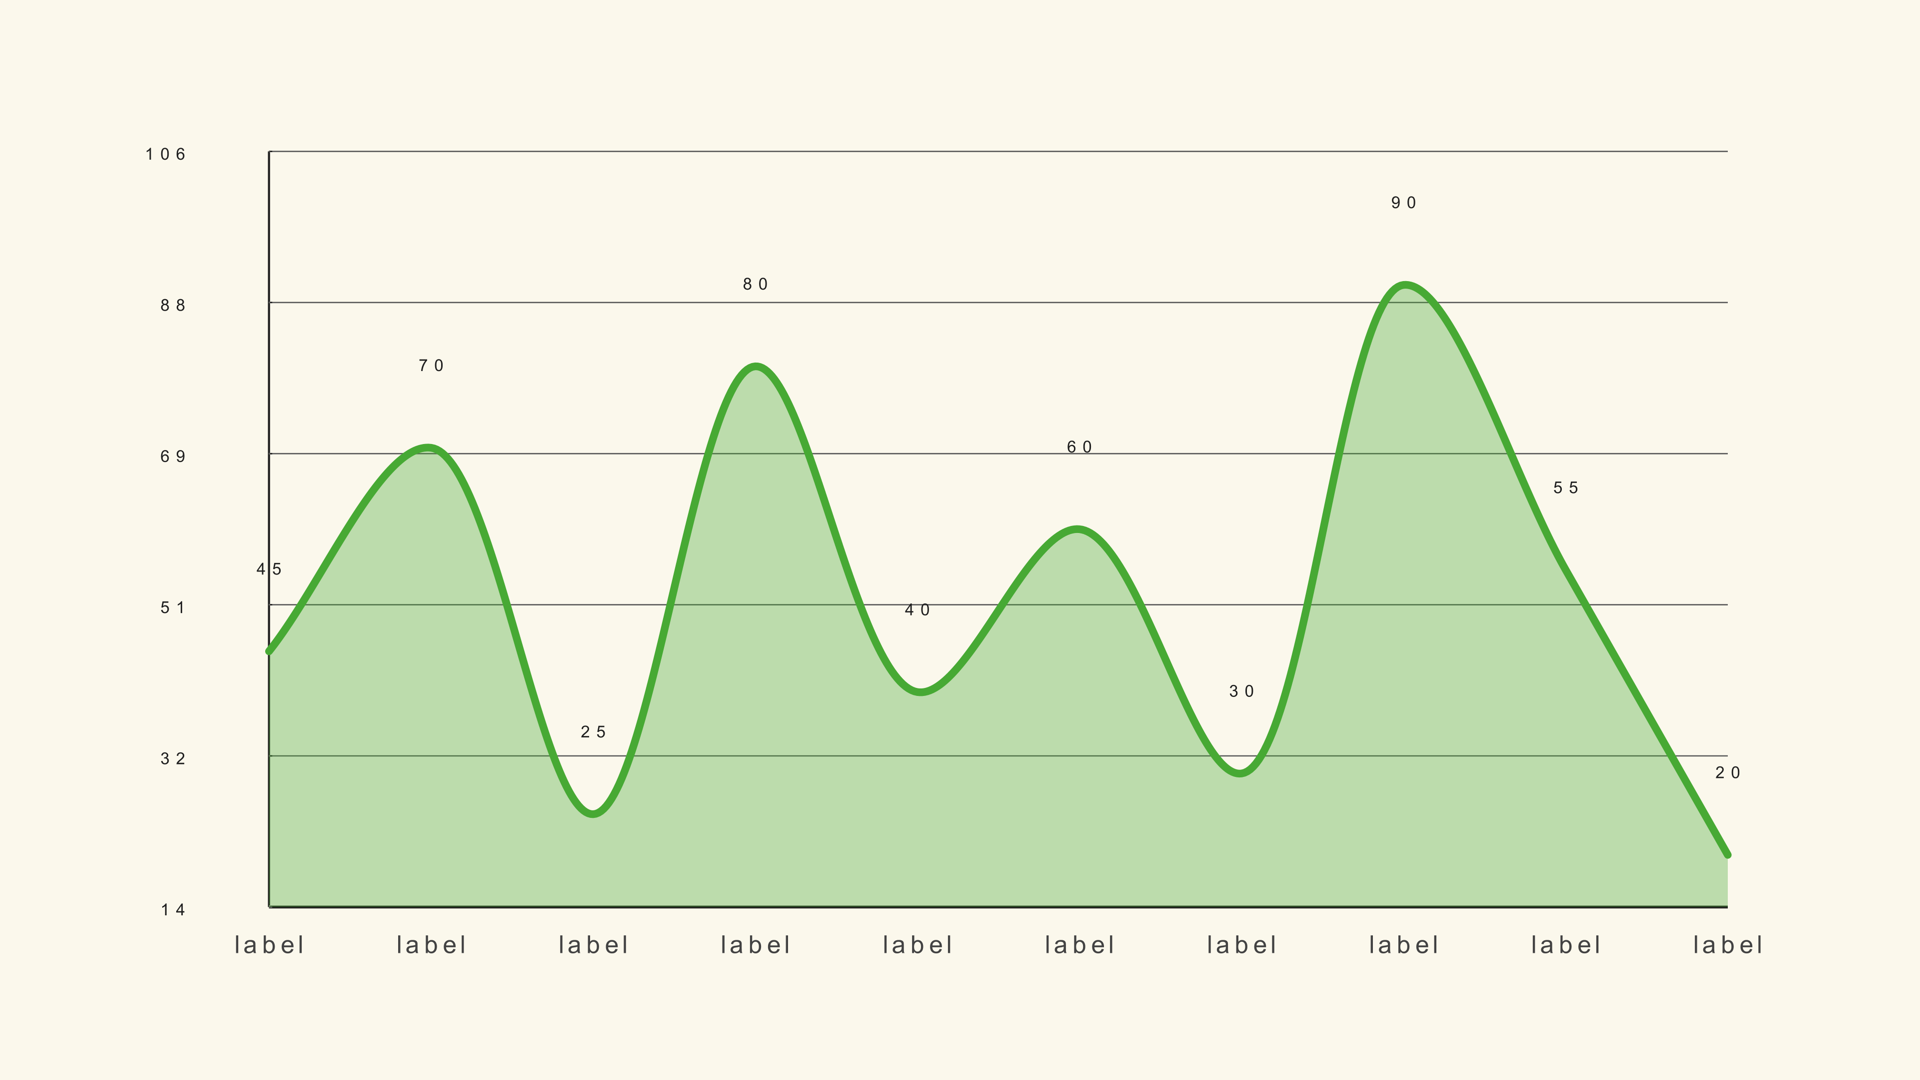
Area family · area-smooth
Noyris single-series smoothed (Catmull-Rom) filled area chart generator (up to 100 points).
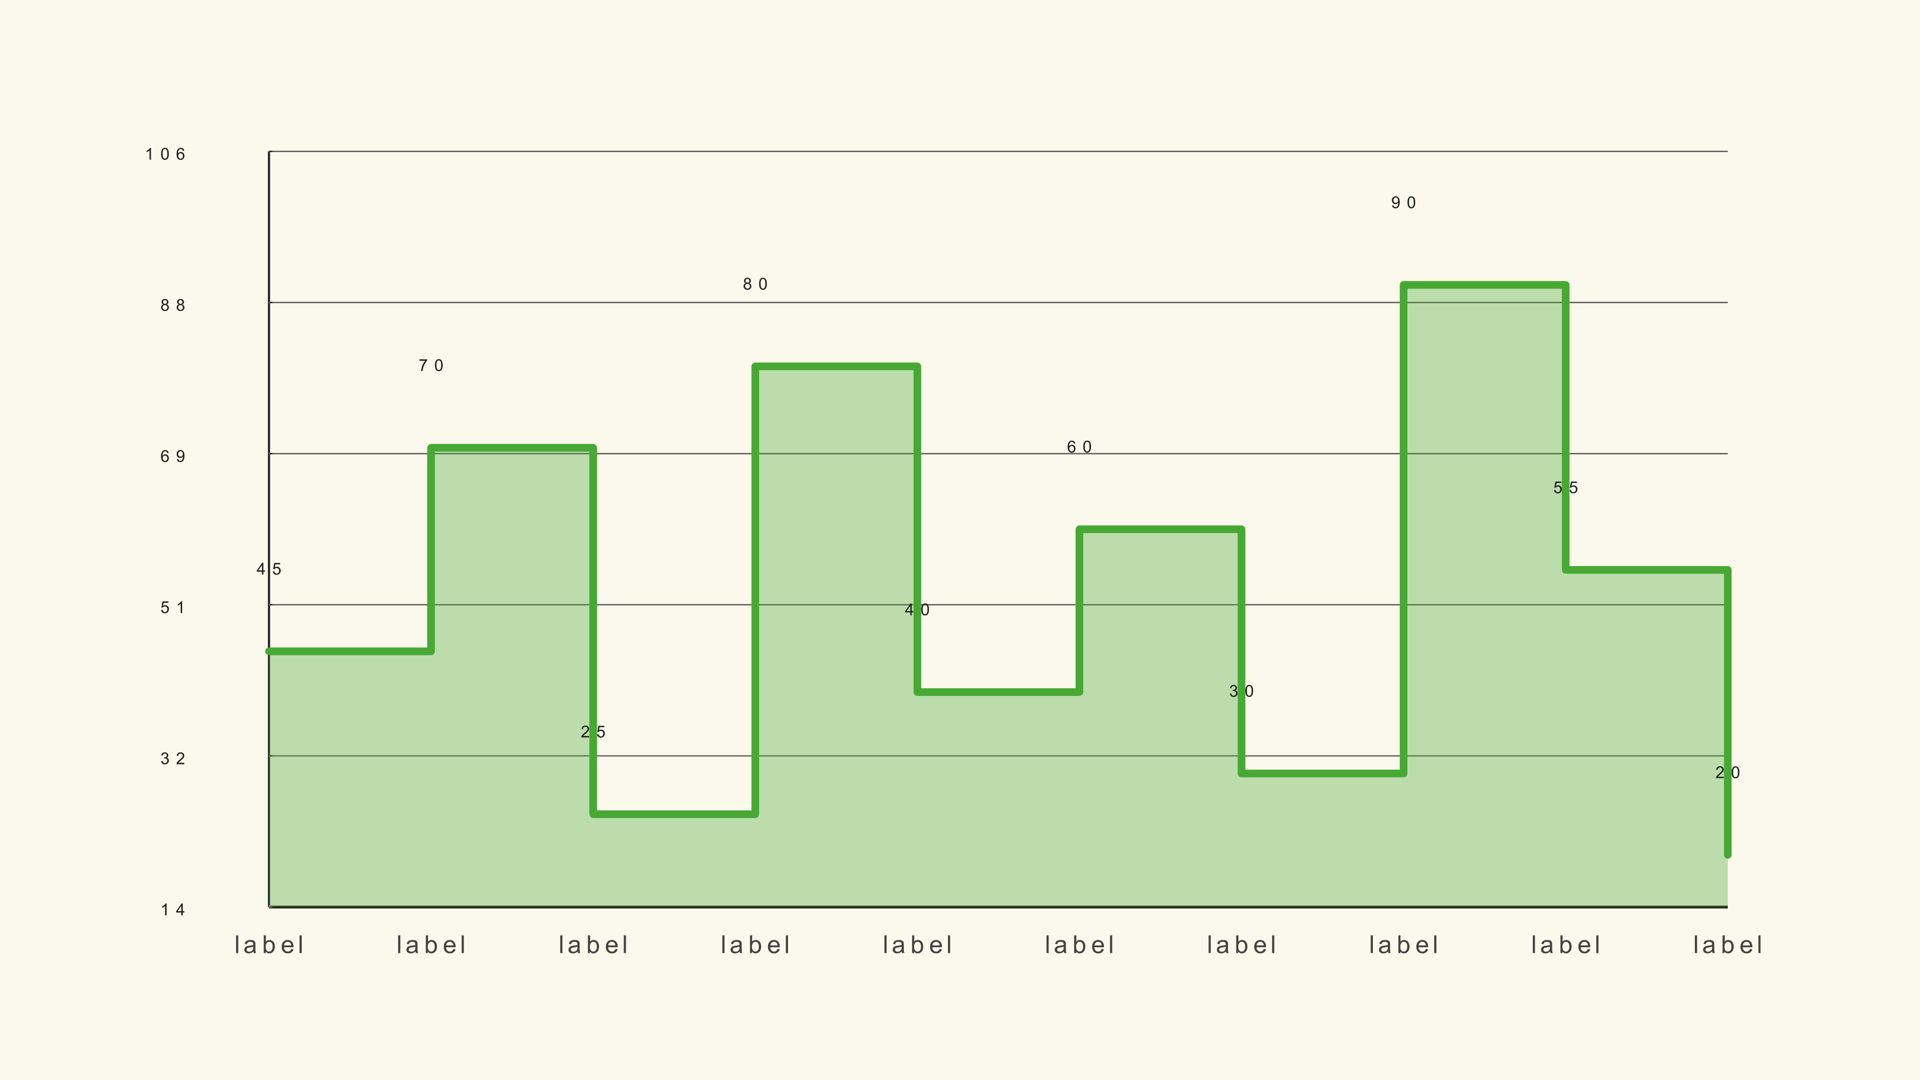
Area family · area-step
Noyris single-series stair-step filled area chart generator (up to 100 points).
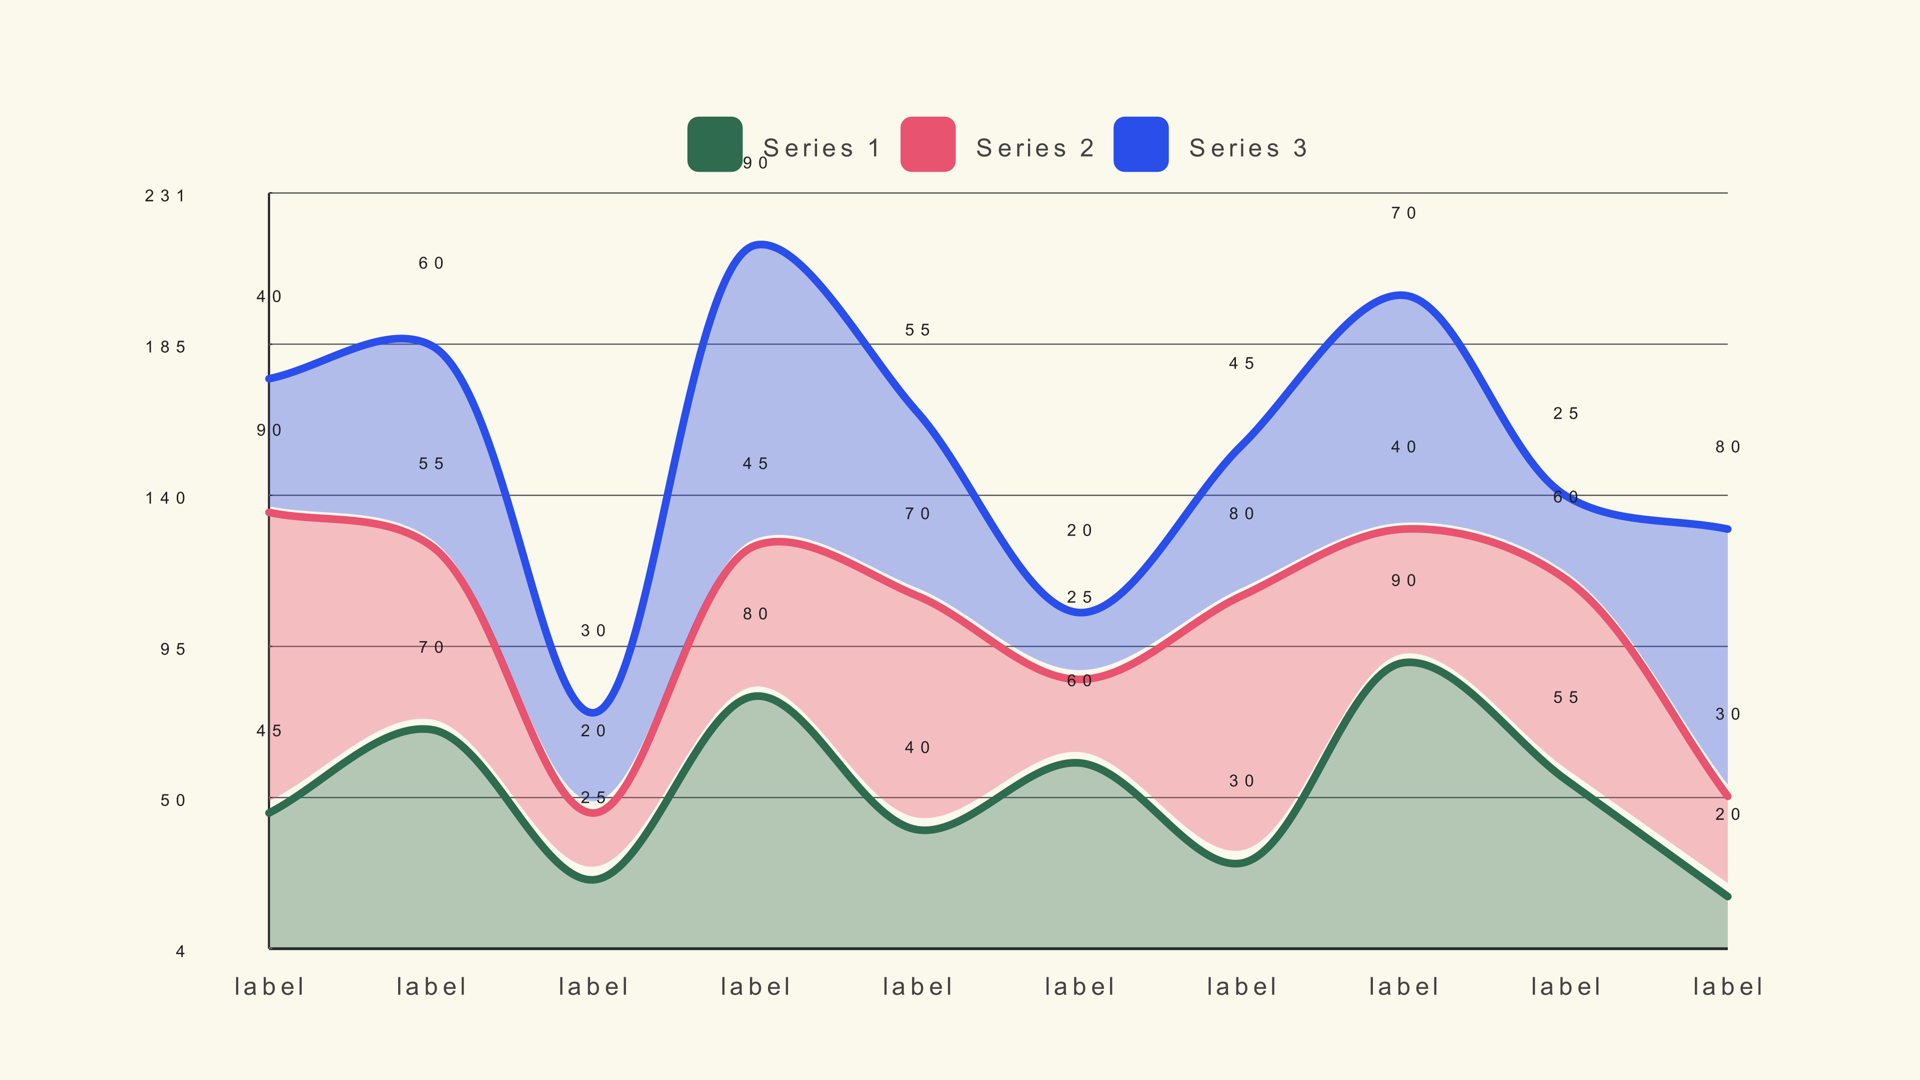
Area family · stack-area
Noyris stacked area chart generator - each series filled to the one below it.
Parts of a whole. Best for a few segments where only total share matters.
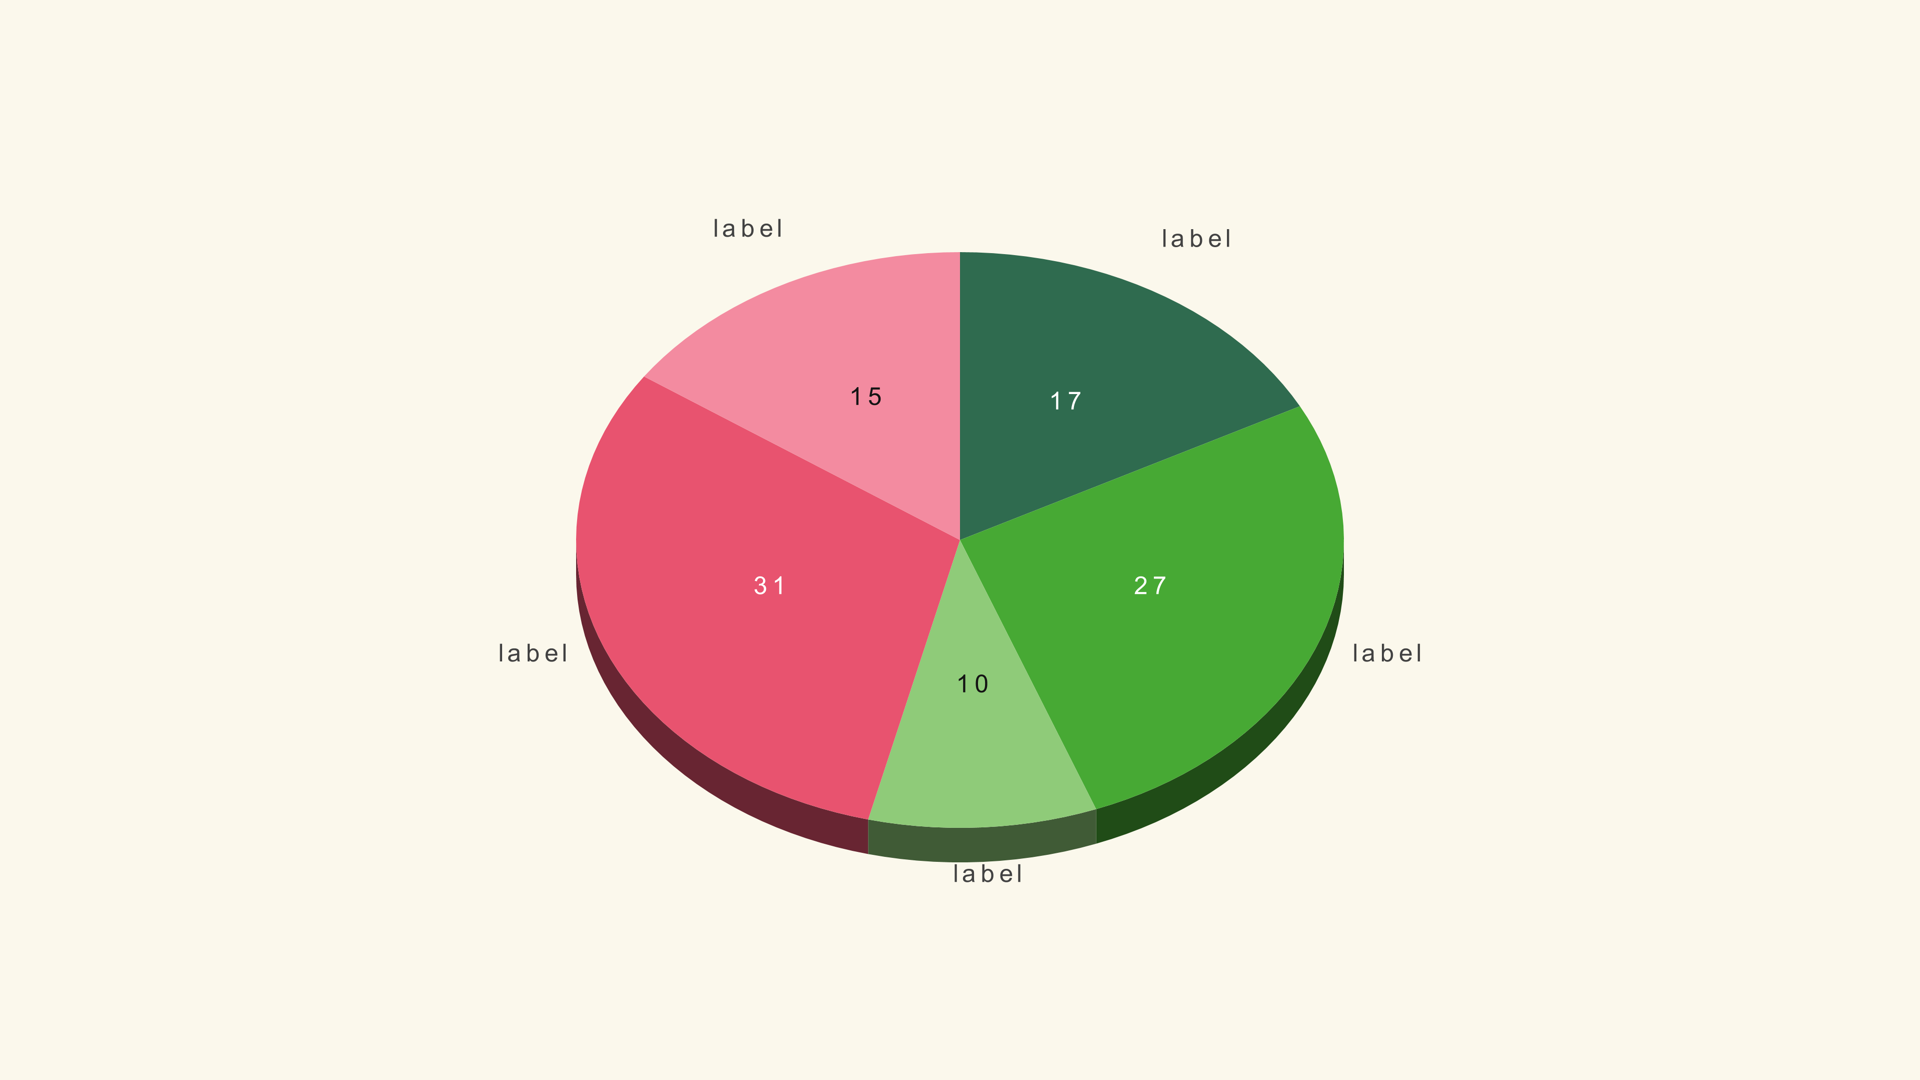
Pie family · pie-3d
Noyris fake-3D extruded pie chart generator (up to 24 slices).
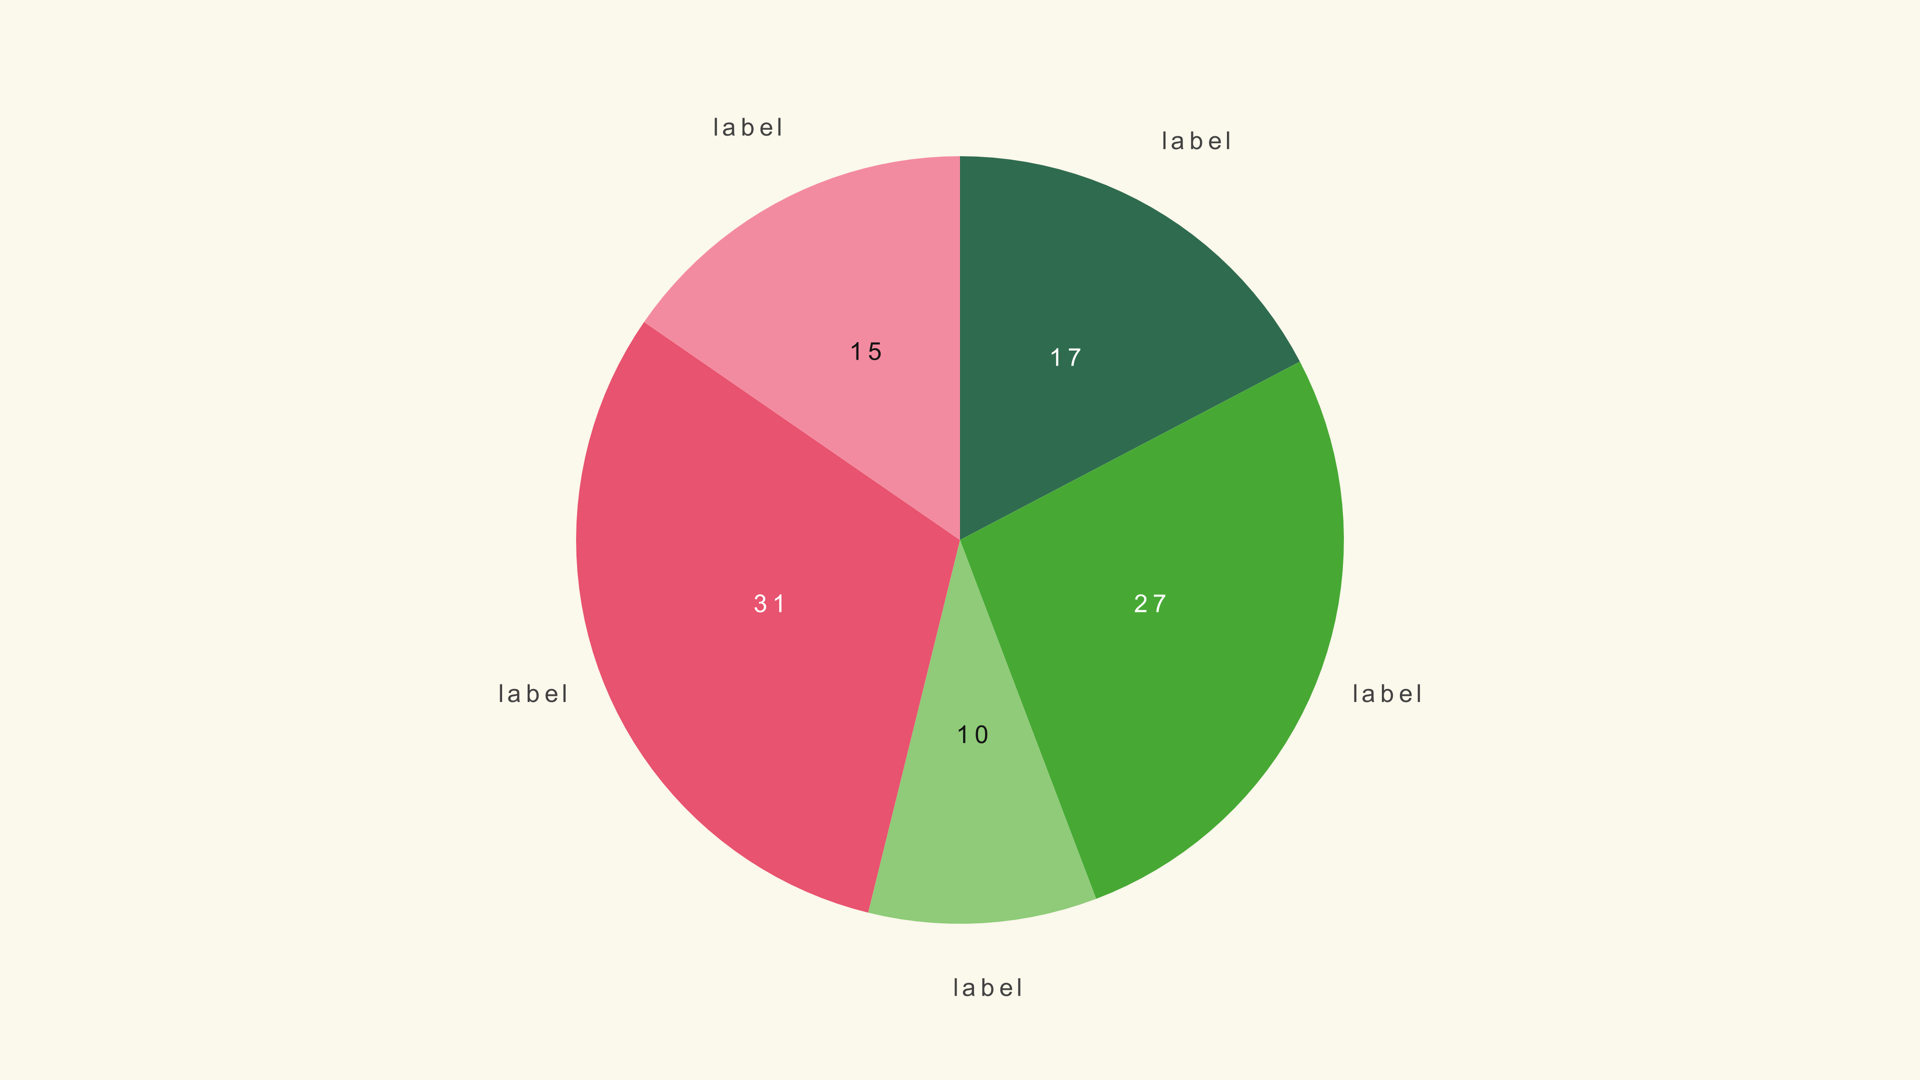
Pie family · pie-basic
Noyris pie / donut chart generator (up to 24 slices).
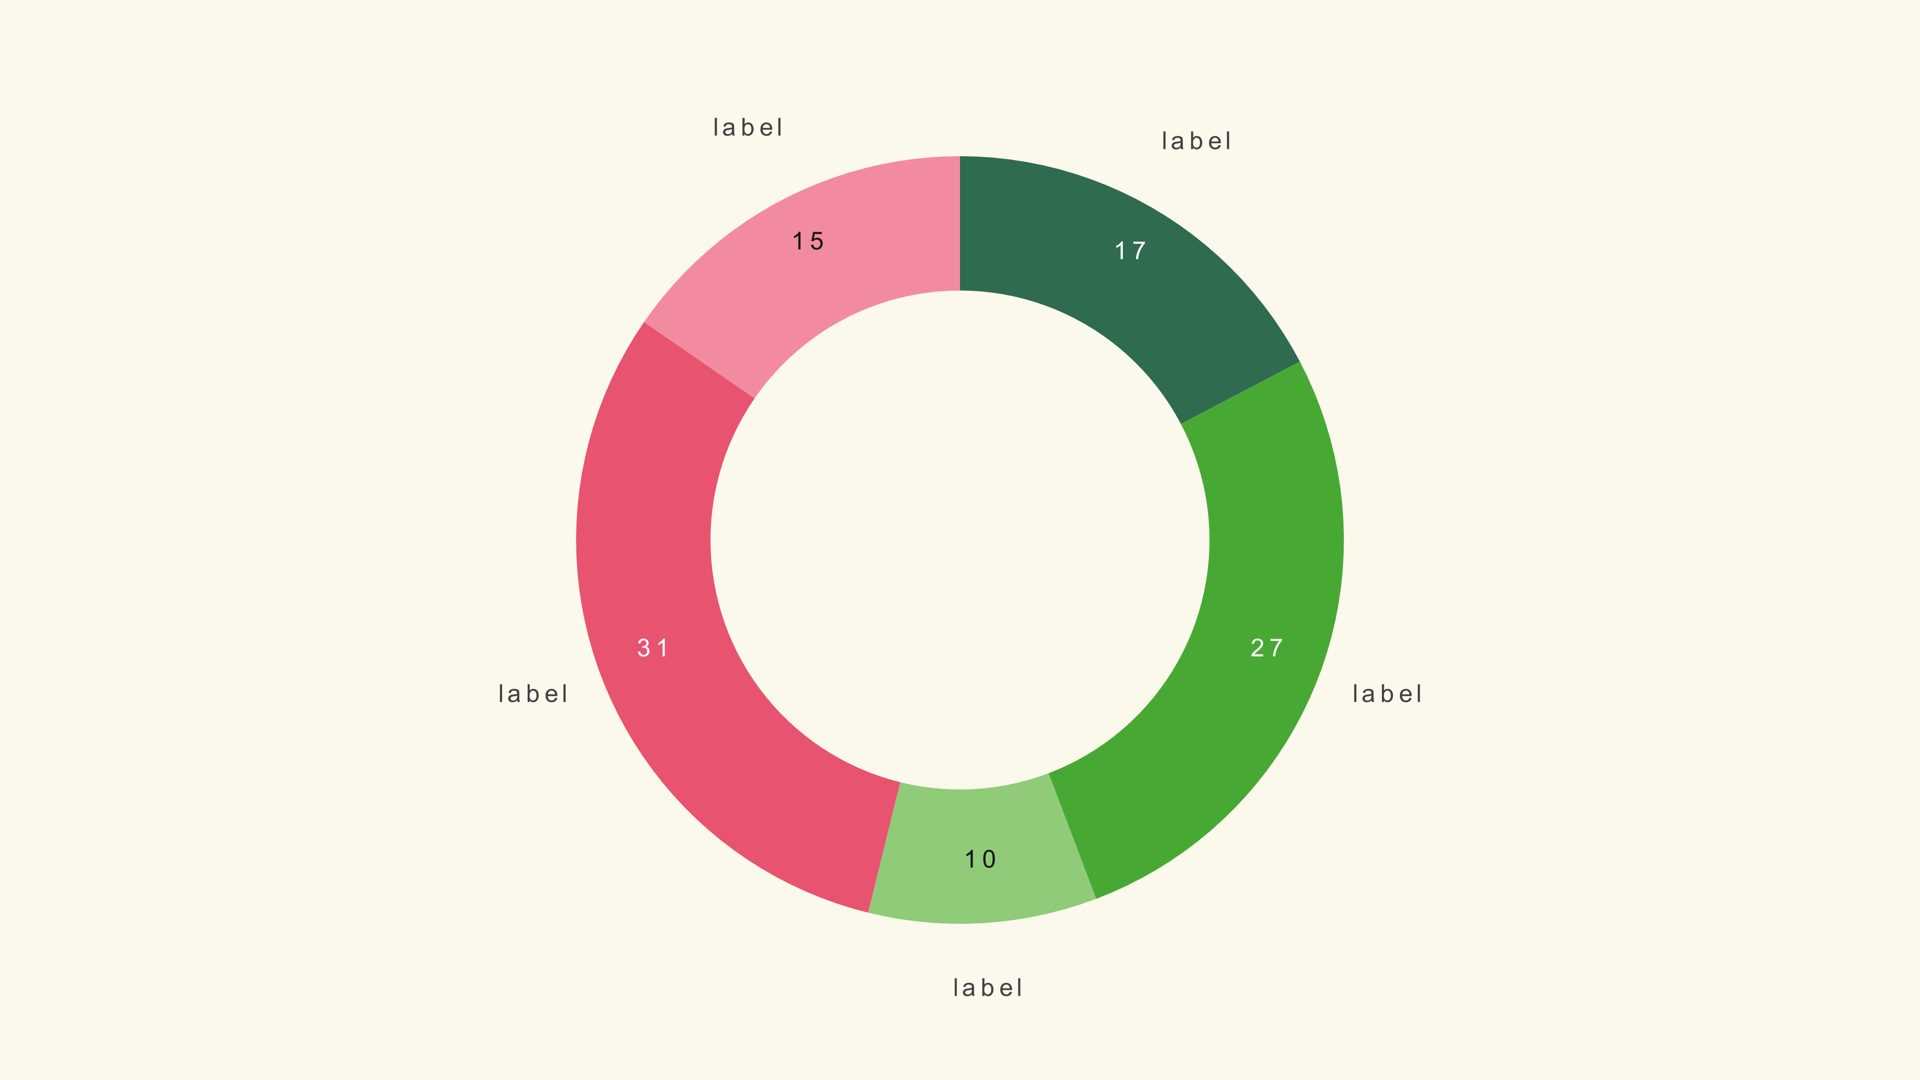
Pie family · pie-donut
Noyris pie donut chart generator (up to 24 slices).
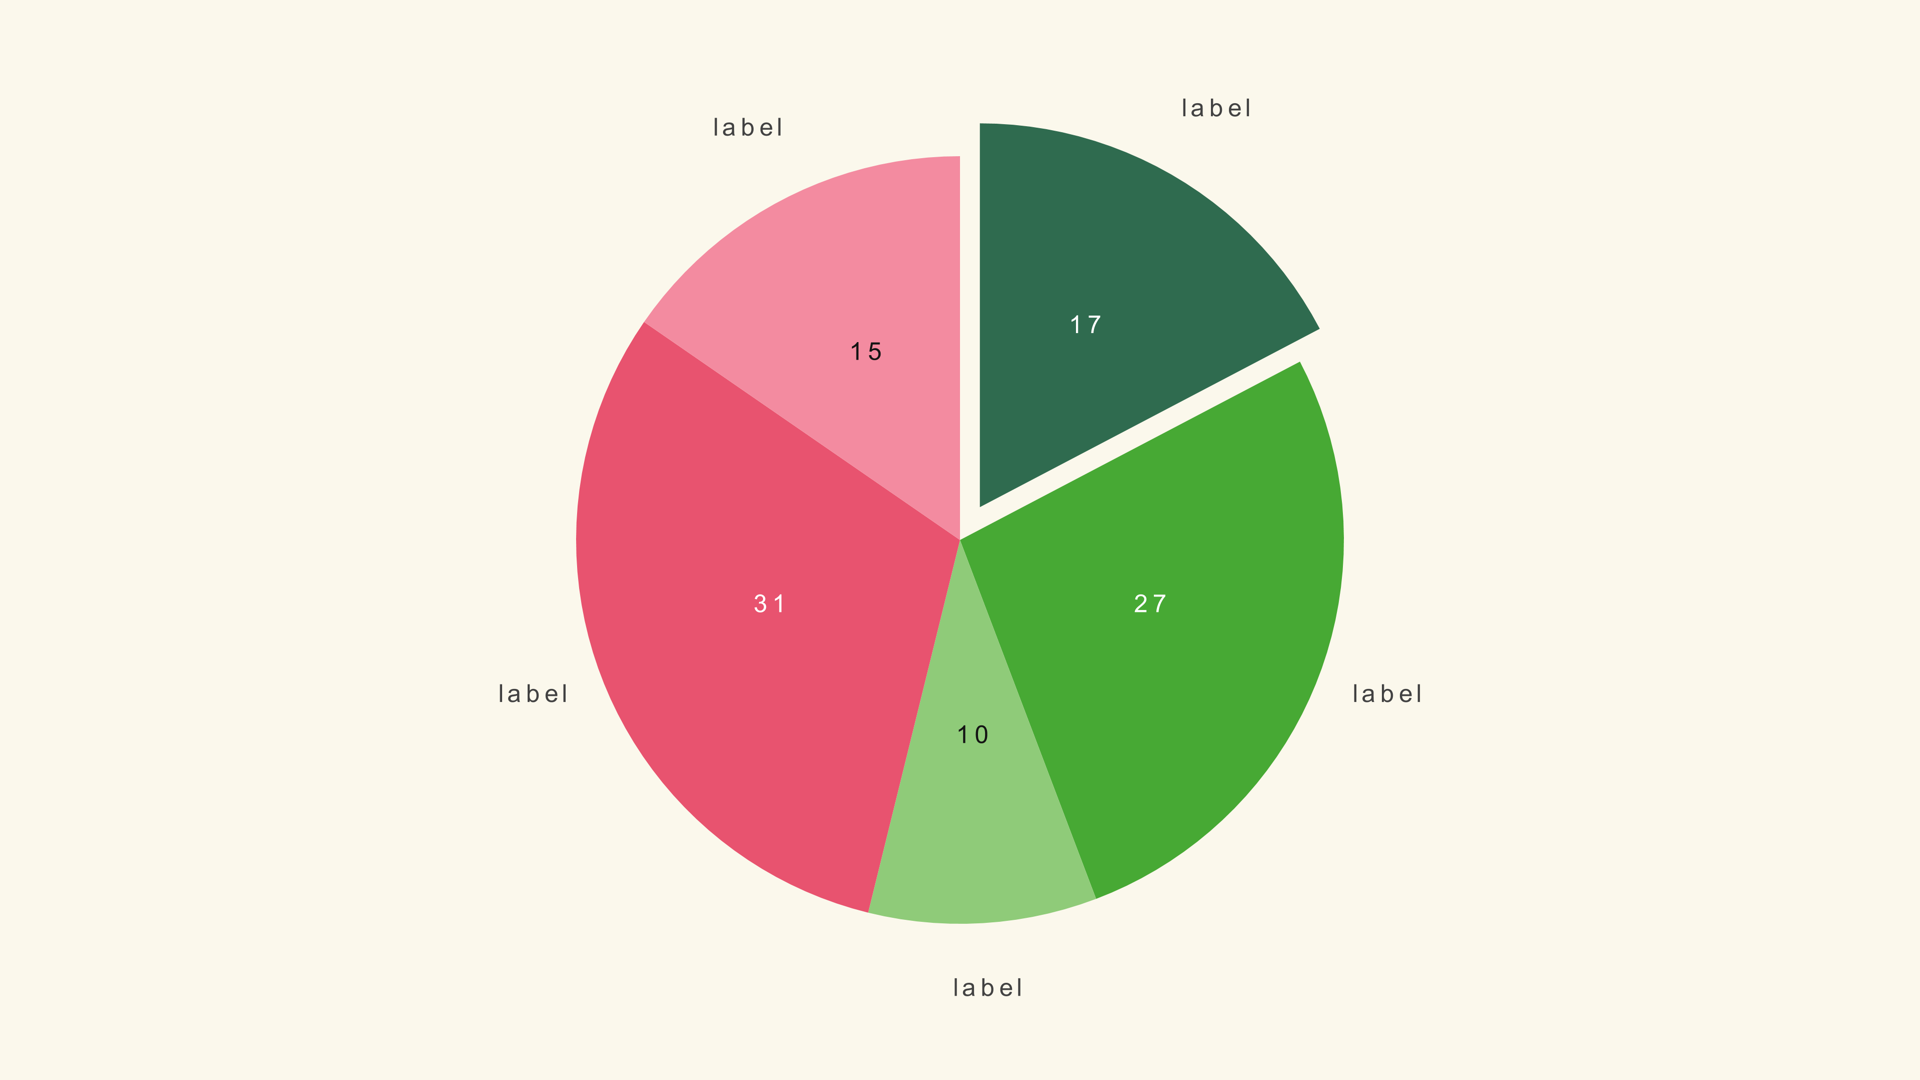
Pie family · pie-exploded
Noyris exploded pie chart generator (up to 24 slices).
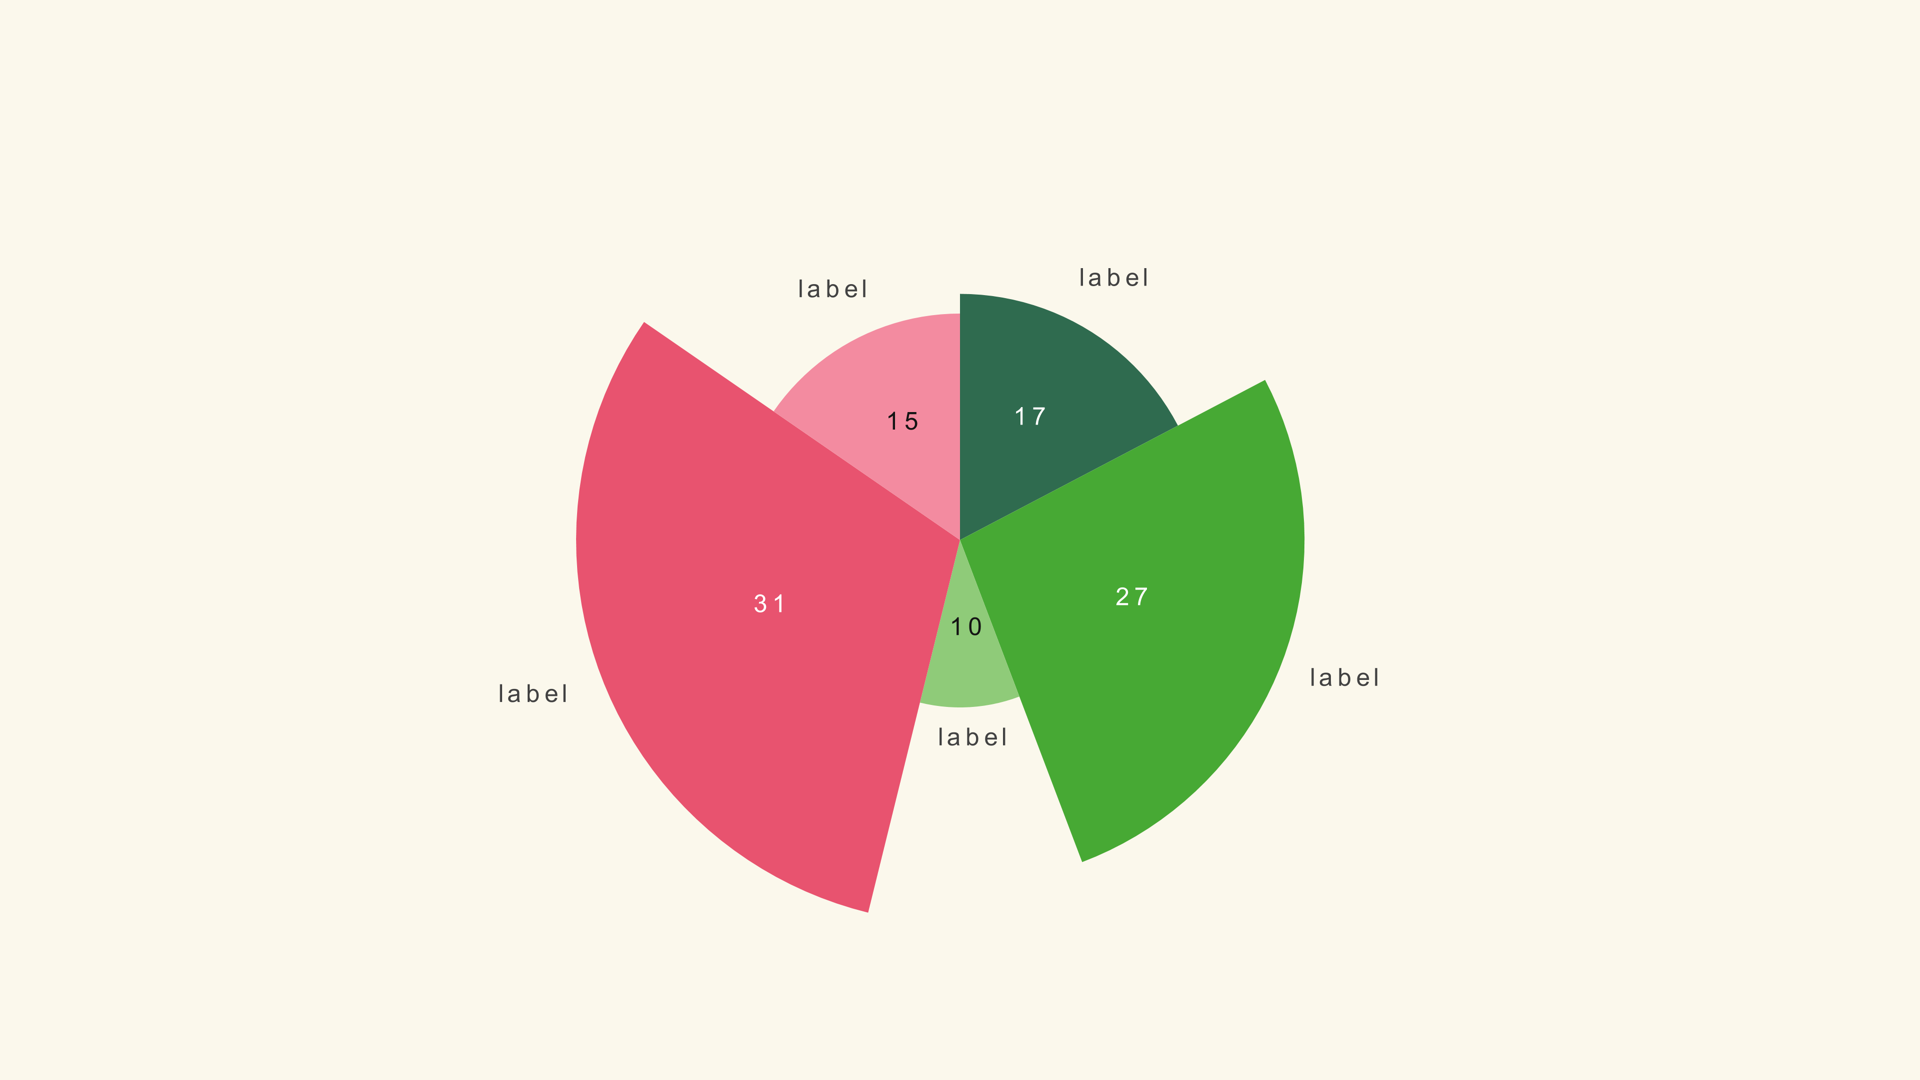
Pie family · pie-rose
Noyris polar-area (Nightingale rose) pie generator - radial height per value (up to 24 slices).
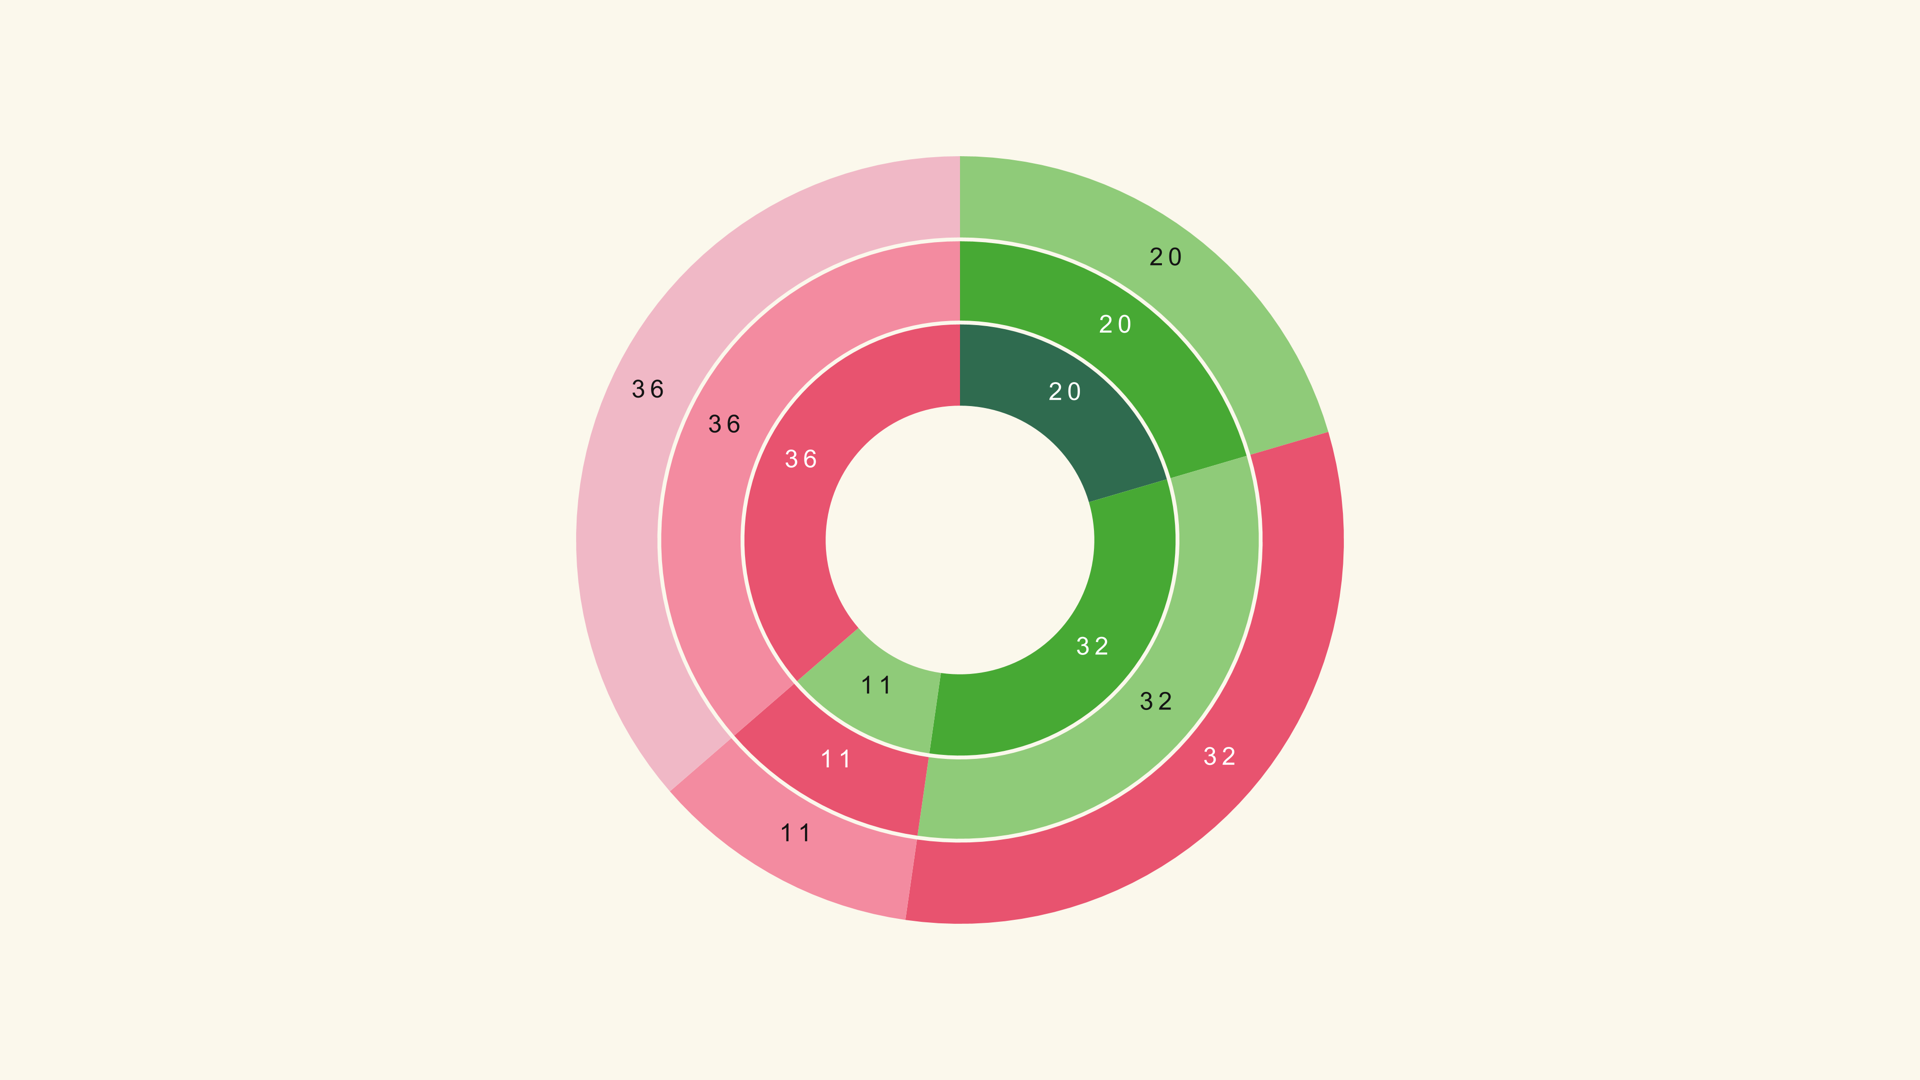
Pie family · radial
Noyris multi-ring radial chart: up to 5 rings, each with up to 10 slices.
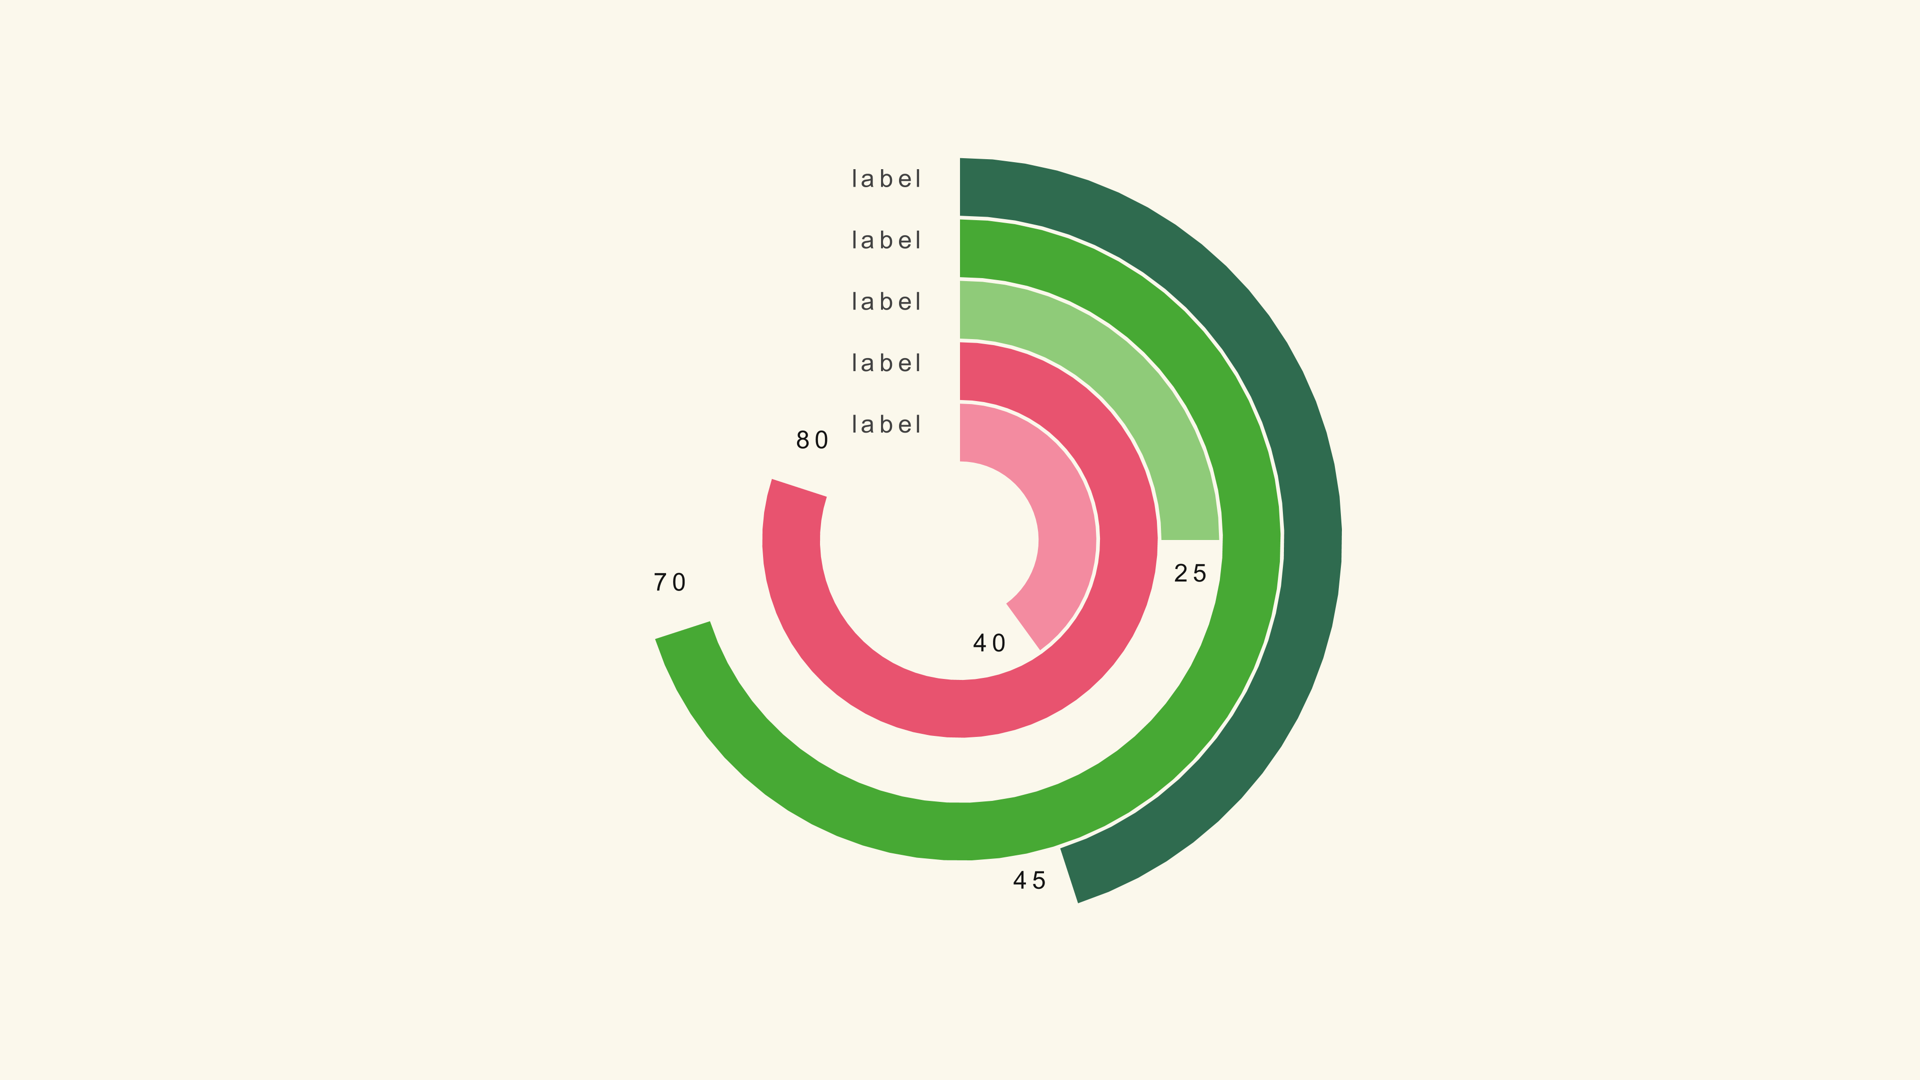
Pie family · ring-gauge
Noyris concentric ring gauge (multi-ring arcs from 12 o'clock).
Three dimensions at once x, y and size. Best for dense multivariate datasets.
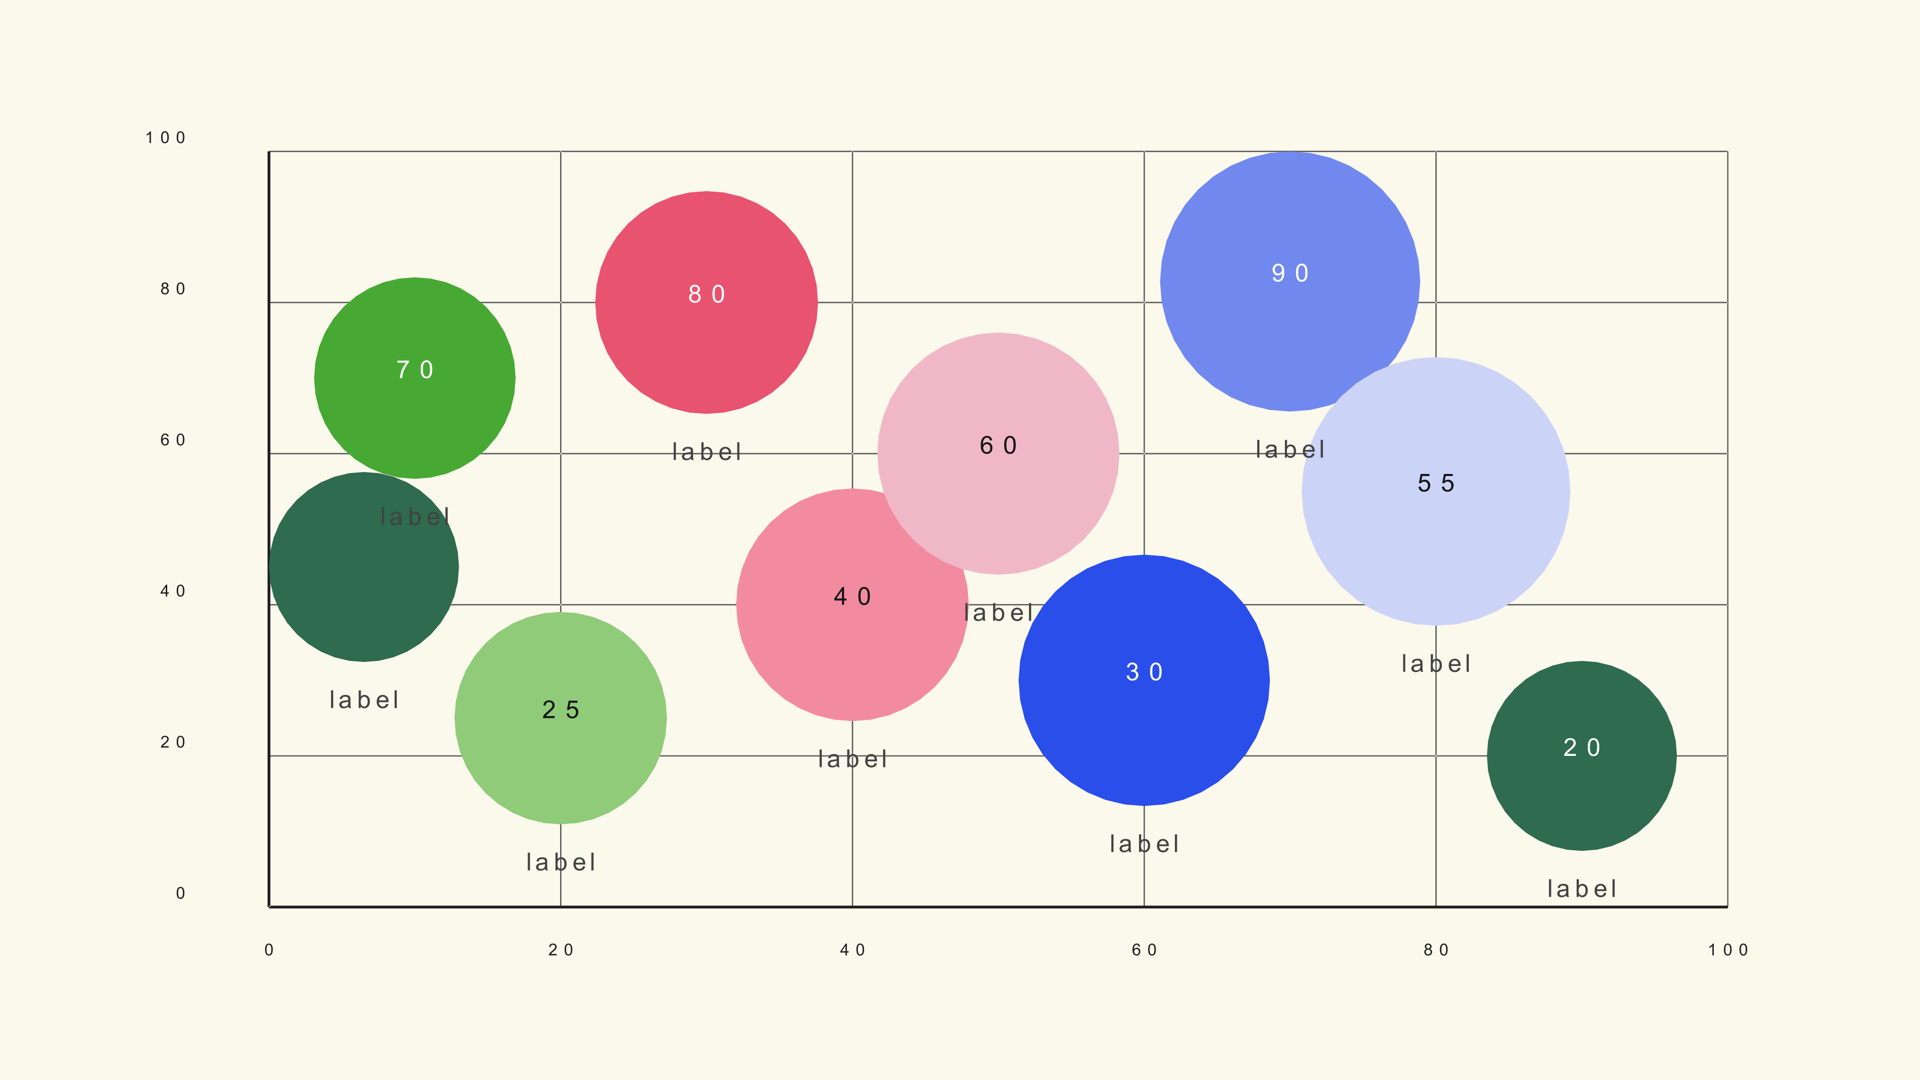
Bubble family · bubble
Noyris bubble/scatter chart generator (up to 100 points, numeric X/Y, area-proportional size).
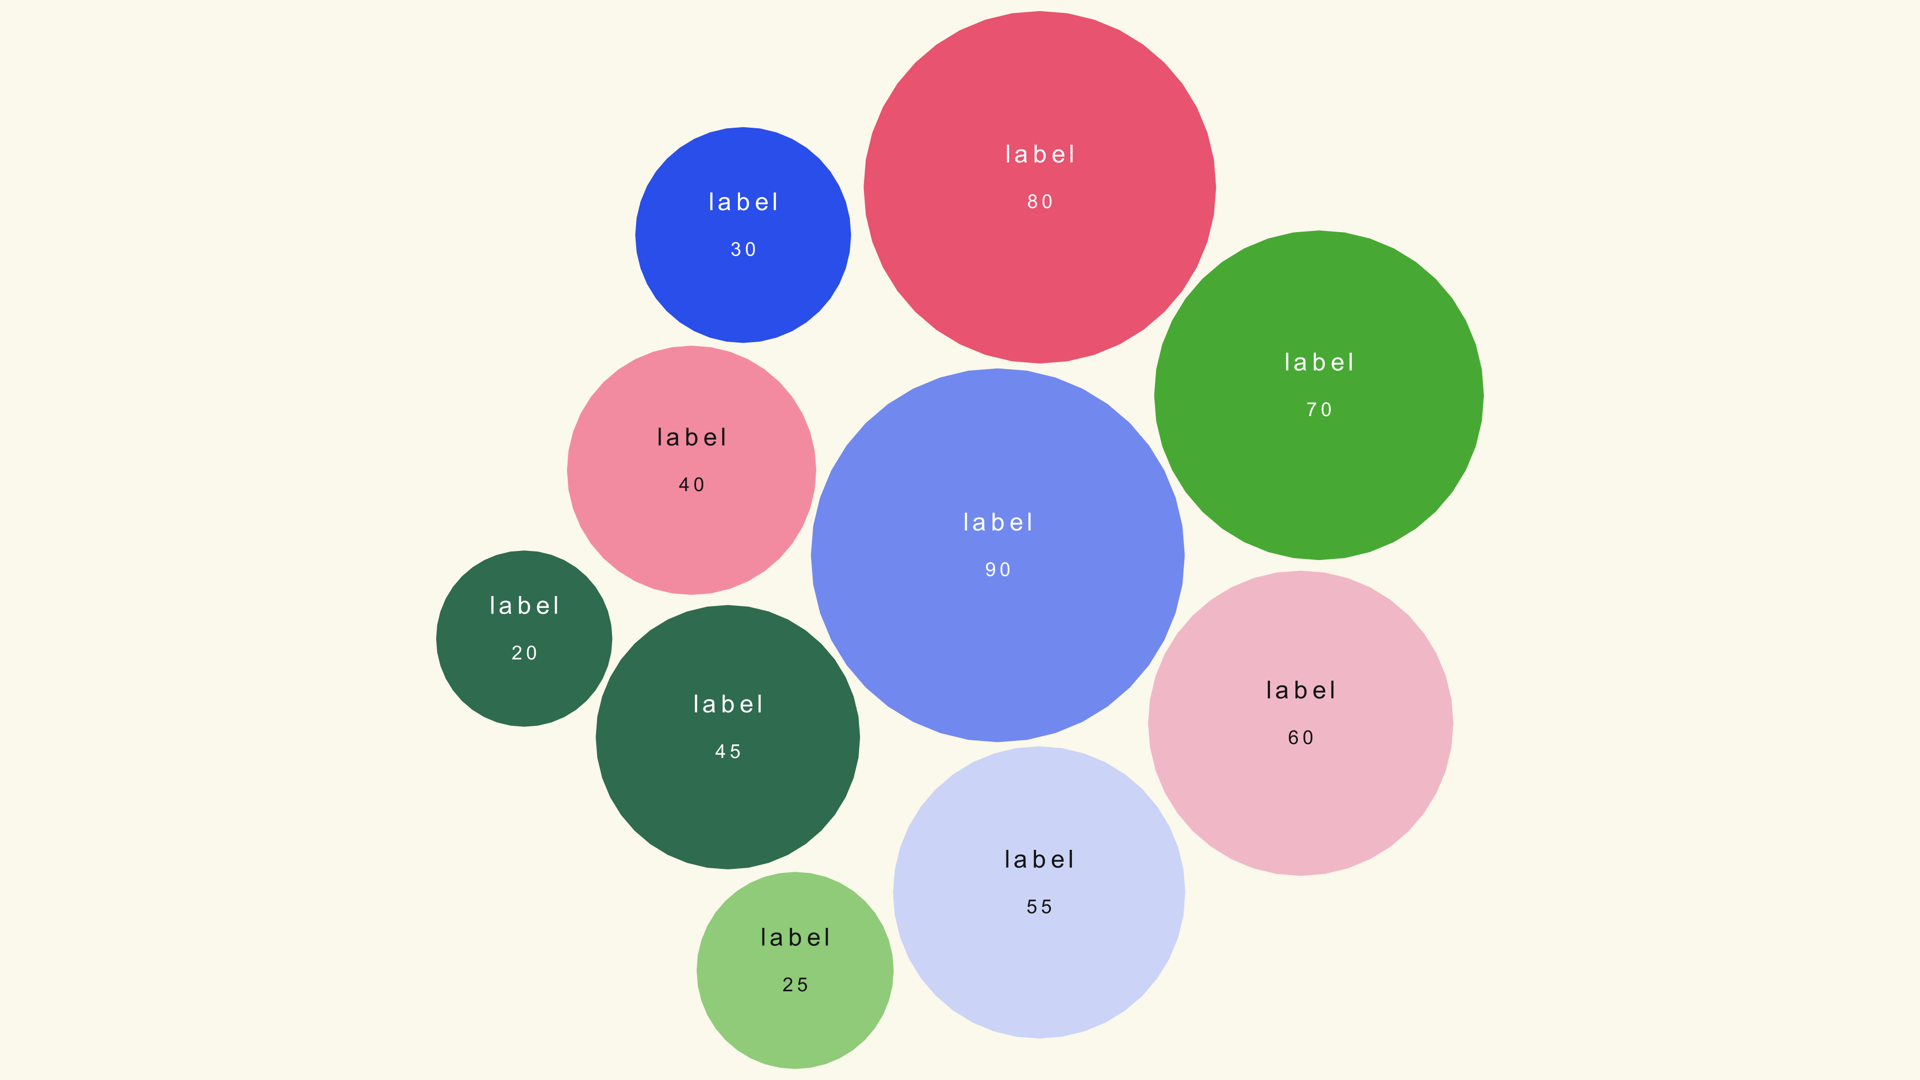
Bubble family · bubble-cluster
Noyris cluster bubble chart generator - tight onion packing, area-proportional bubble radii, kingpin center mode, prefix/suffix value labels.
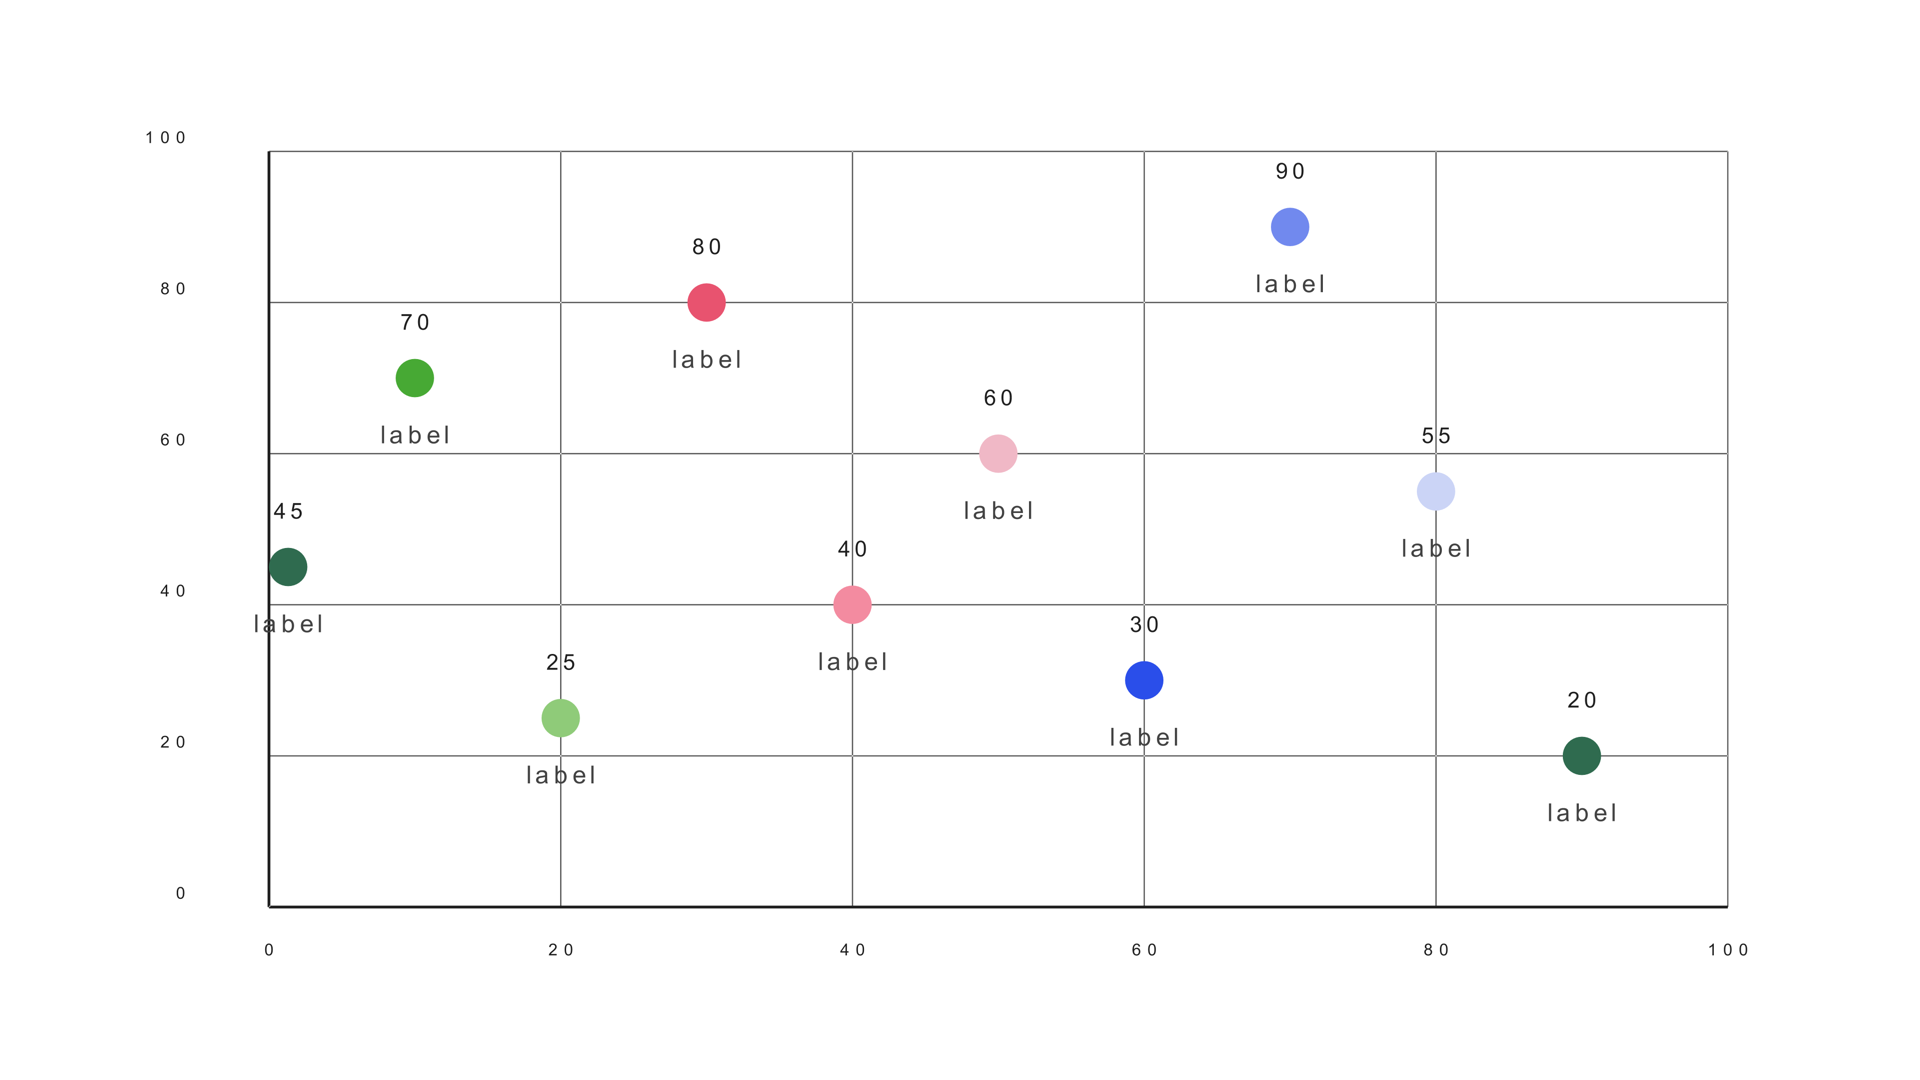
Bubble family · scatter-plot
Noyris scatter plot generator (up to 100 points, numeric X/Y, fixed-radius markers, per-point colors and shapes).
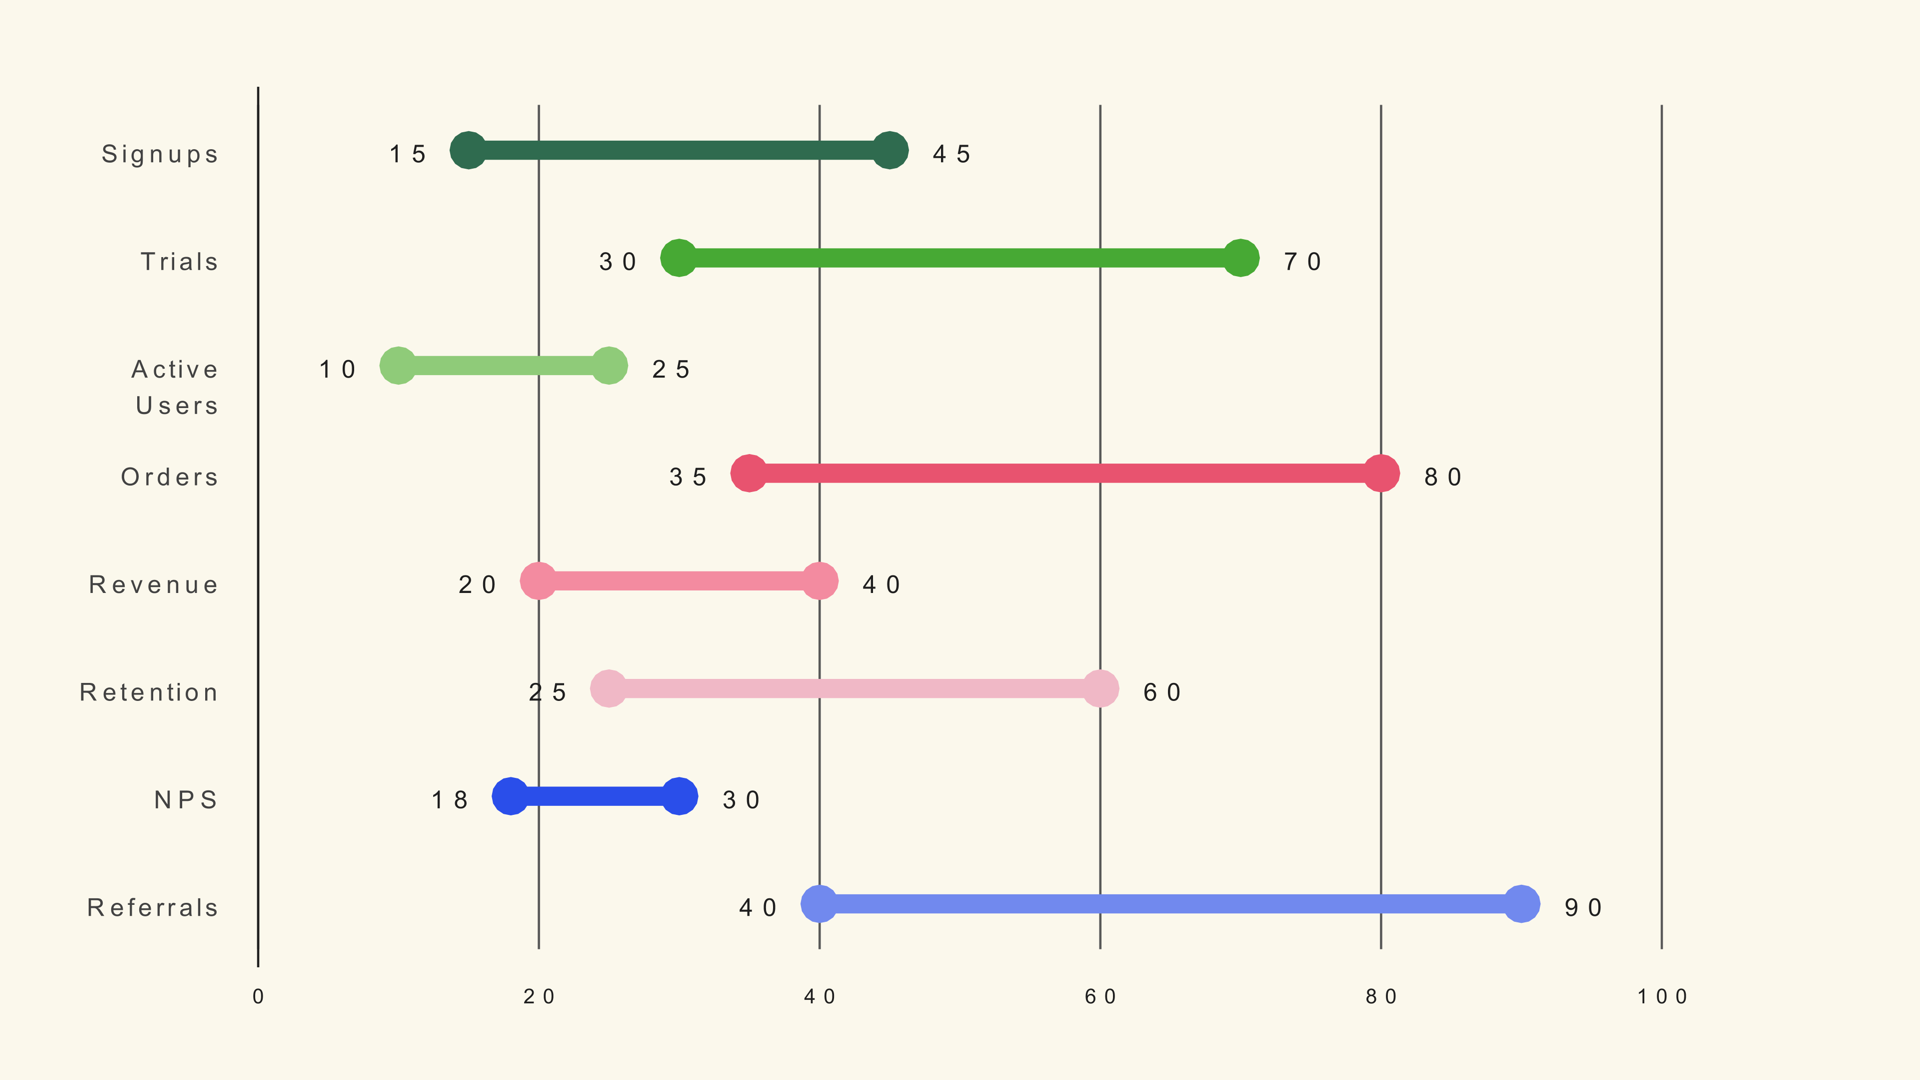
Bubble family · range-dumbbell
Noyris range dumbbell generator - one dot per row with a span between the low and high ends.
Comparing subjects against the same metric set. Best for profiles and rankings.
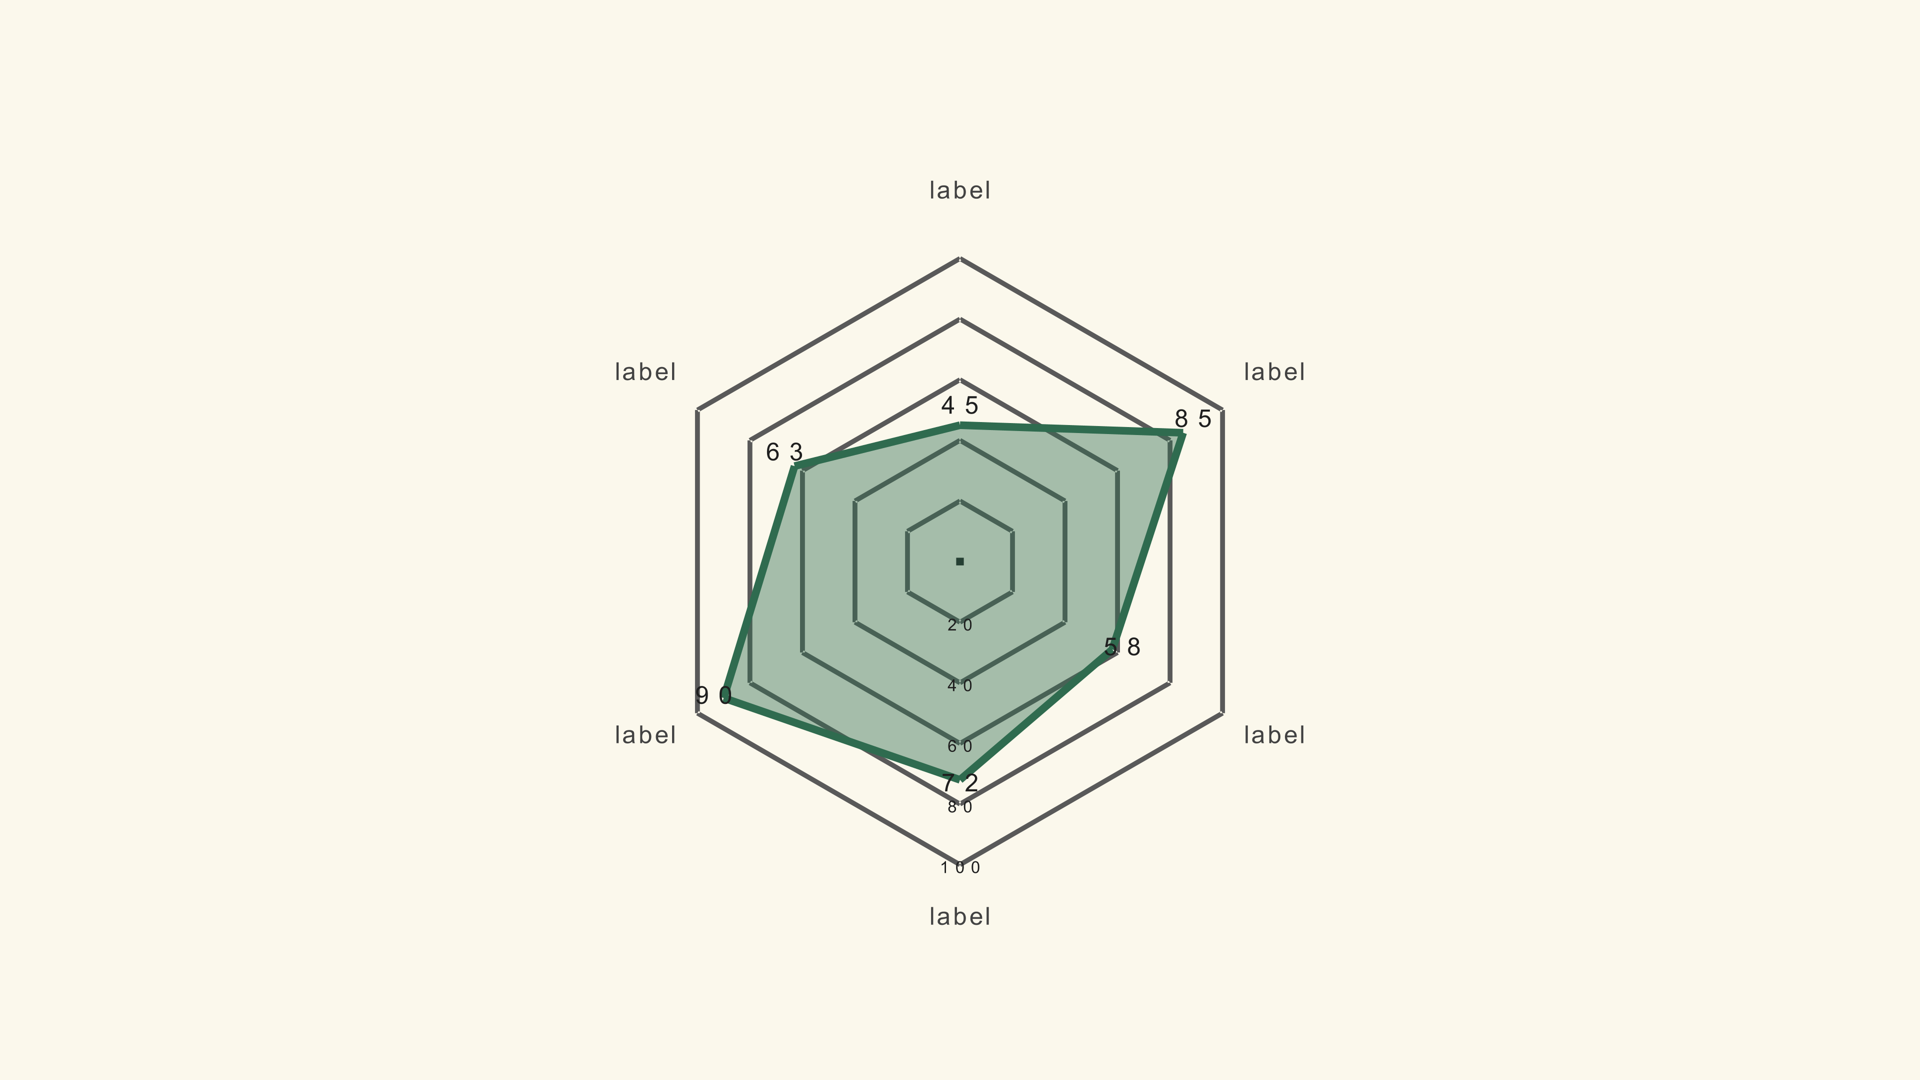
Radar family · radar-basic
Noyris single-series radar with a prominent area fill (dark default theme, demo data).
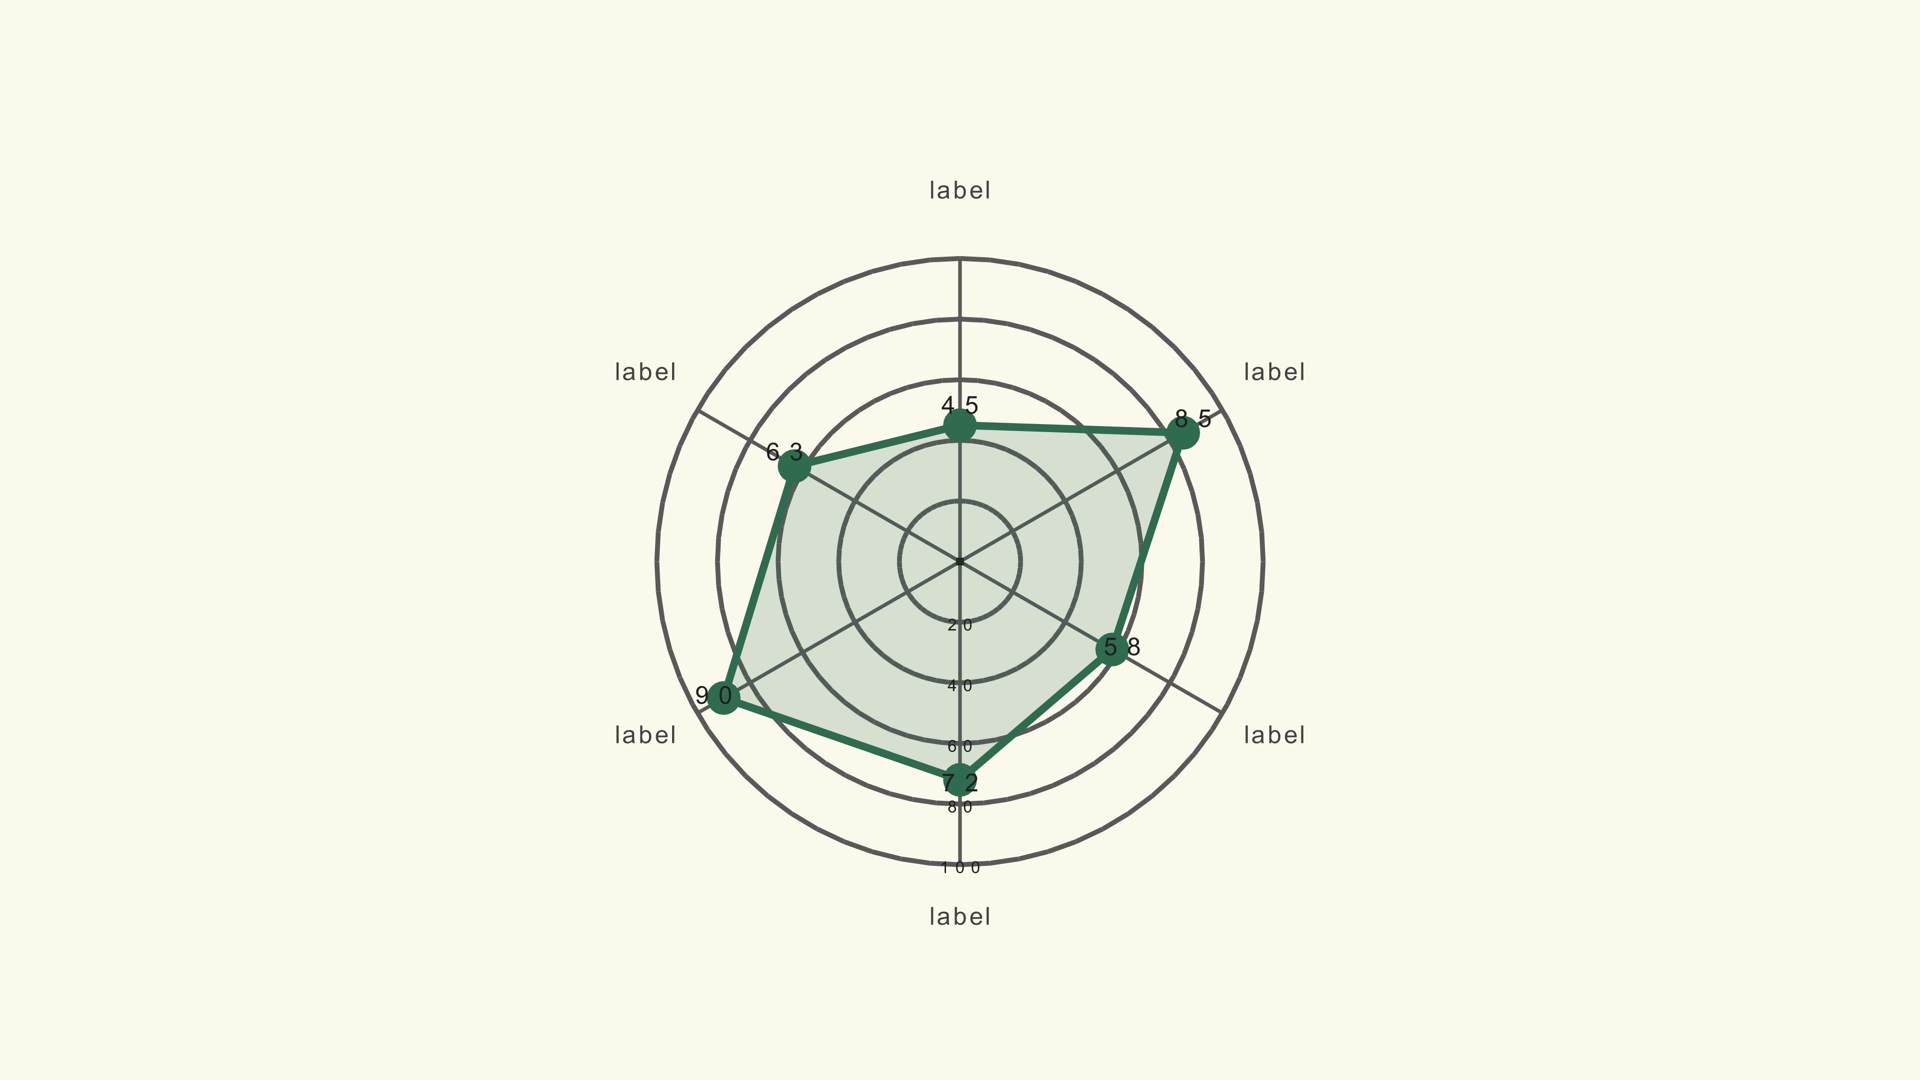
Radar family · radar-circular
Noyris multi-series radar with smooth circular grid rings (segmented Active Series switch, dark default, demo data).
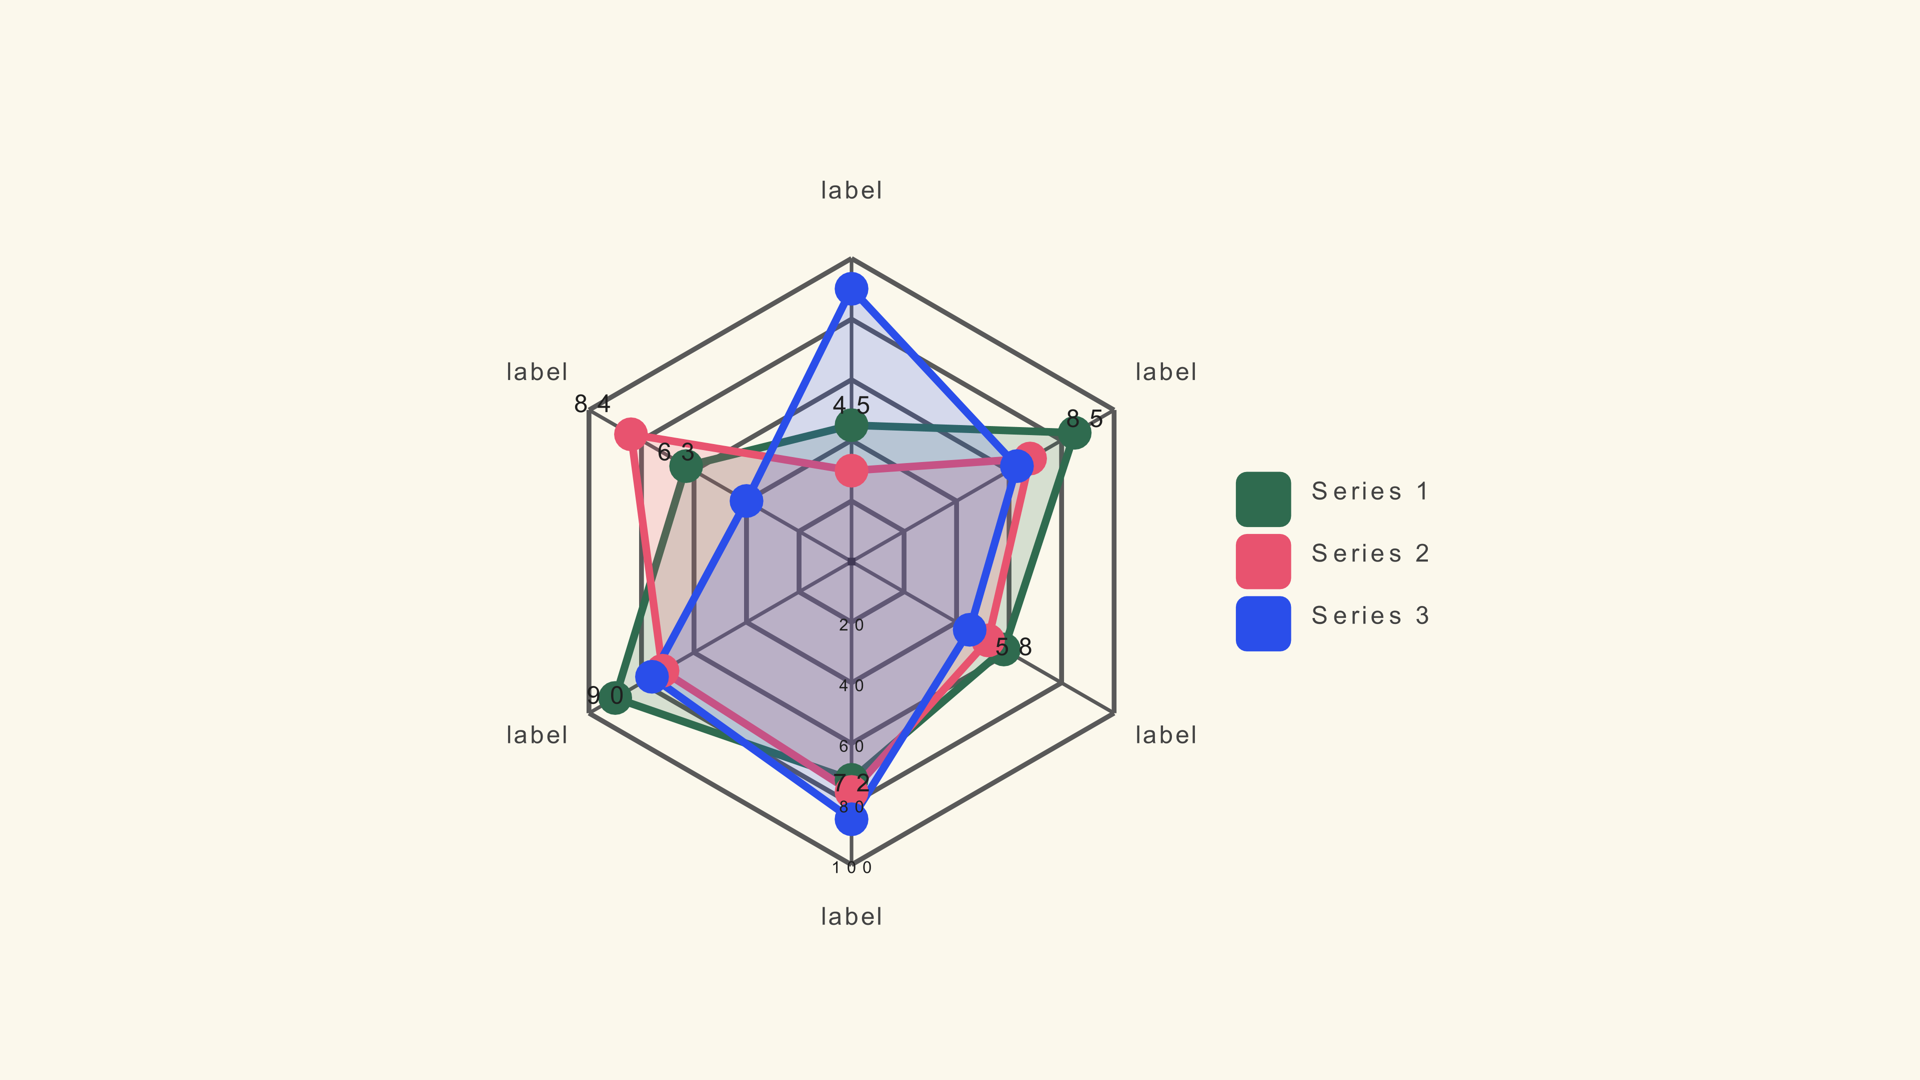
Radar family · radar-multi
Noyris multi-series radar with a segmented Active Series switch (up to 5 series, dark default, demo data).
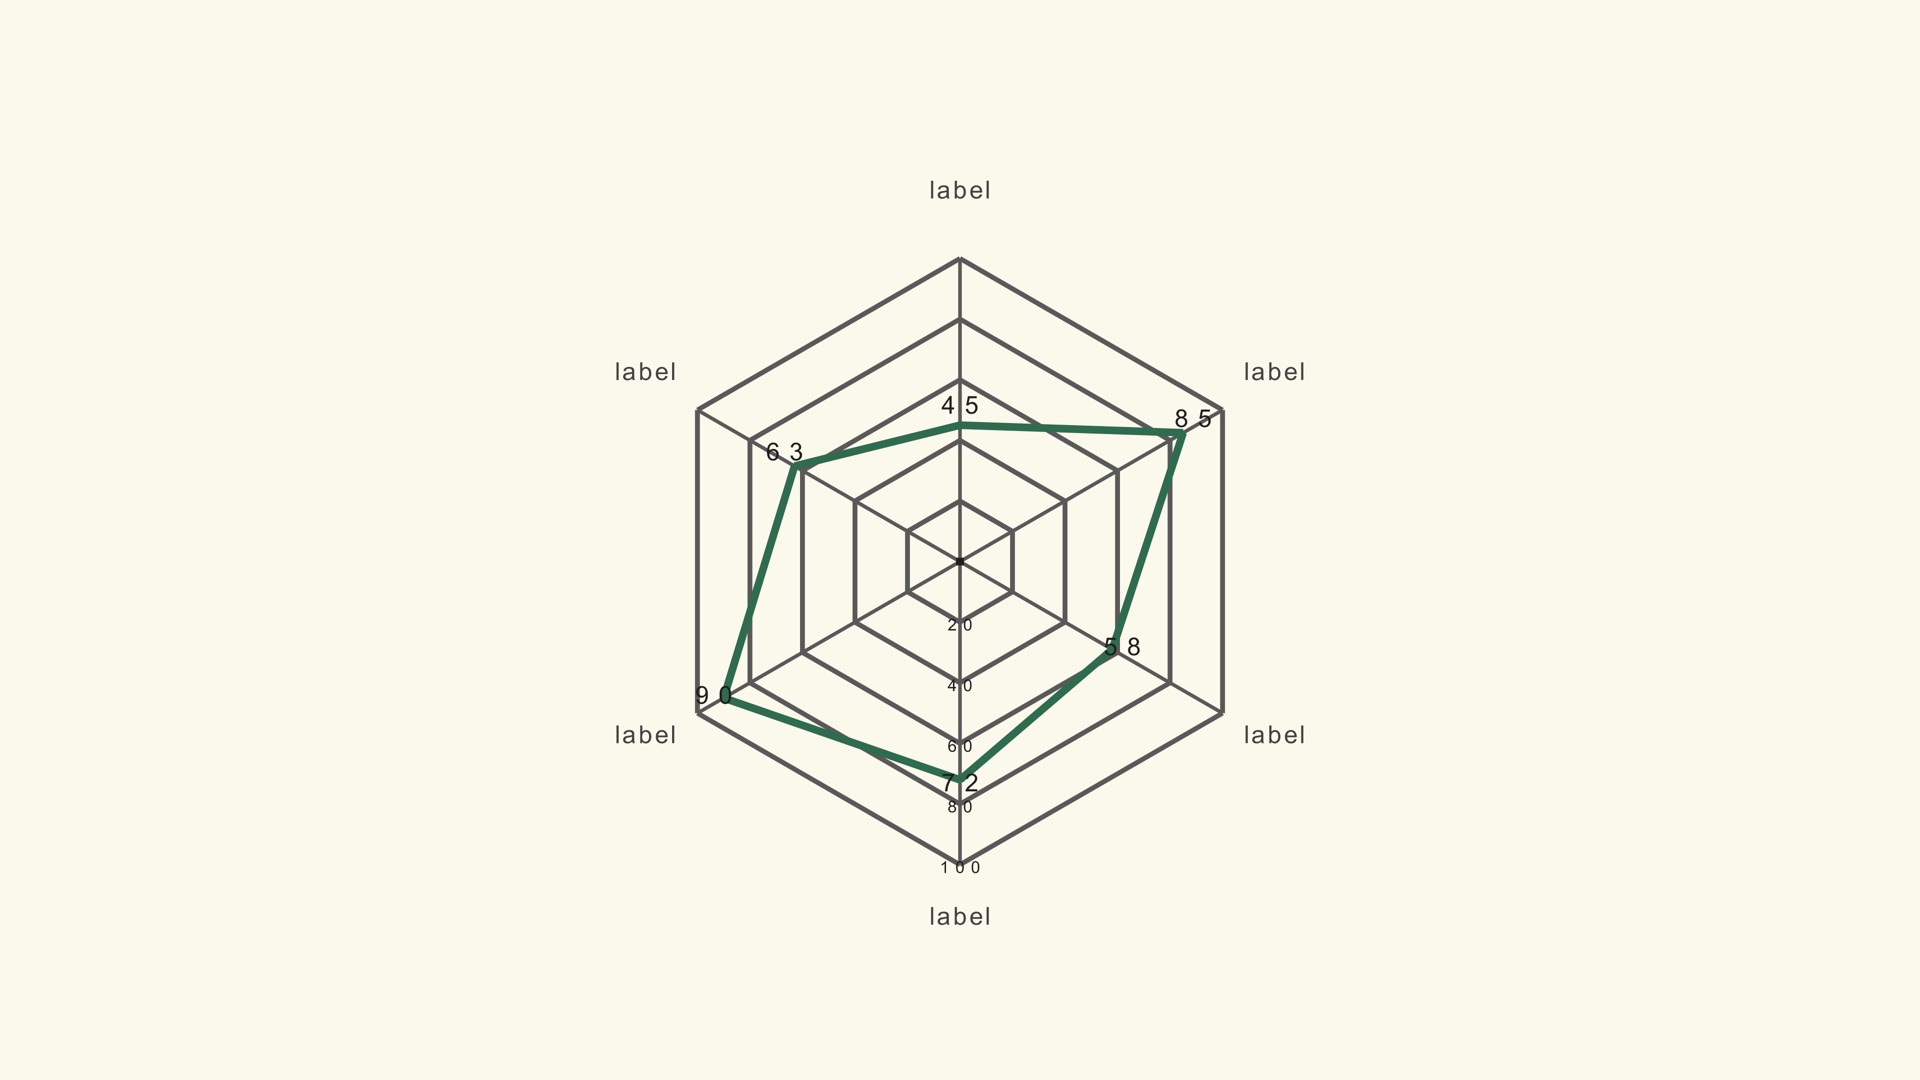
Radar family · radar-outline
Noyris multi-series wireframe radar (clean polygon outline, no fill, segmented Active Series switch, dark default, demo data).
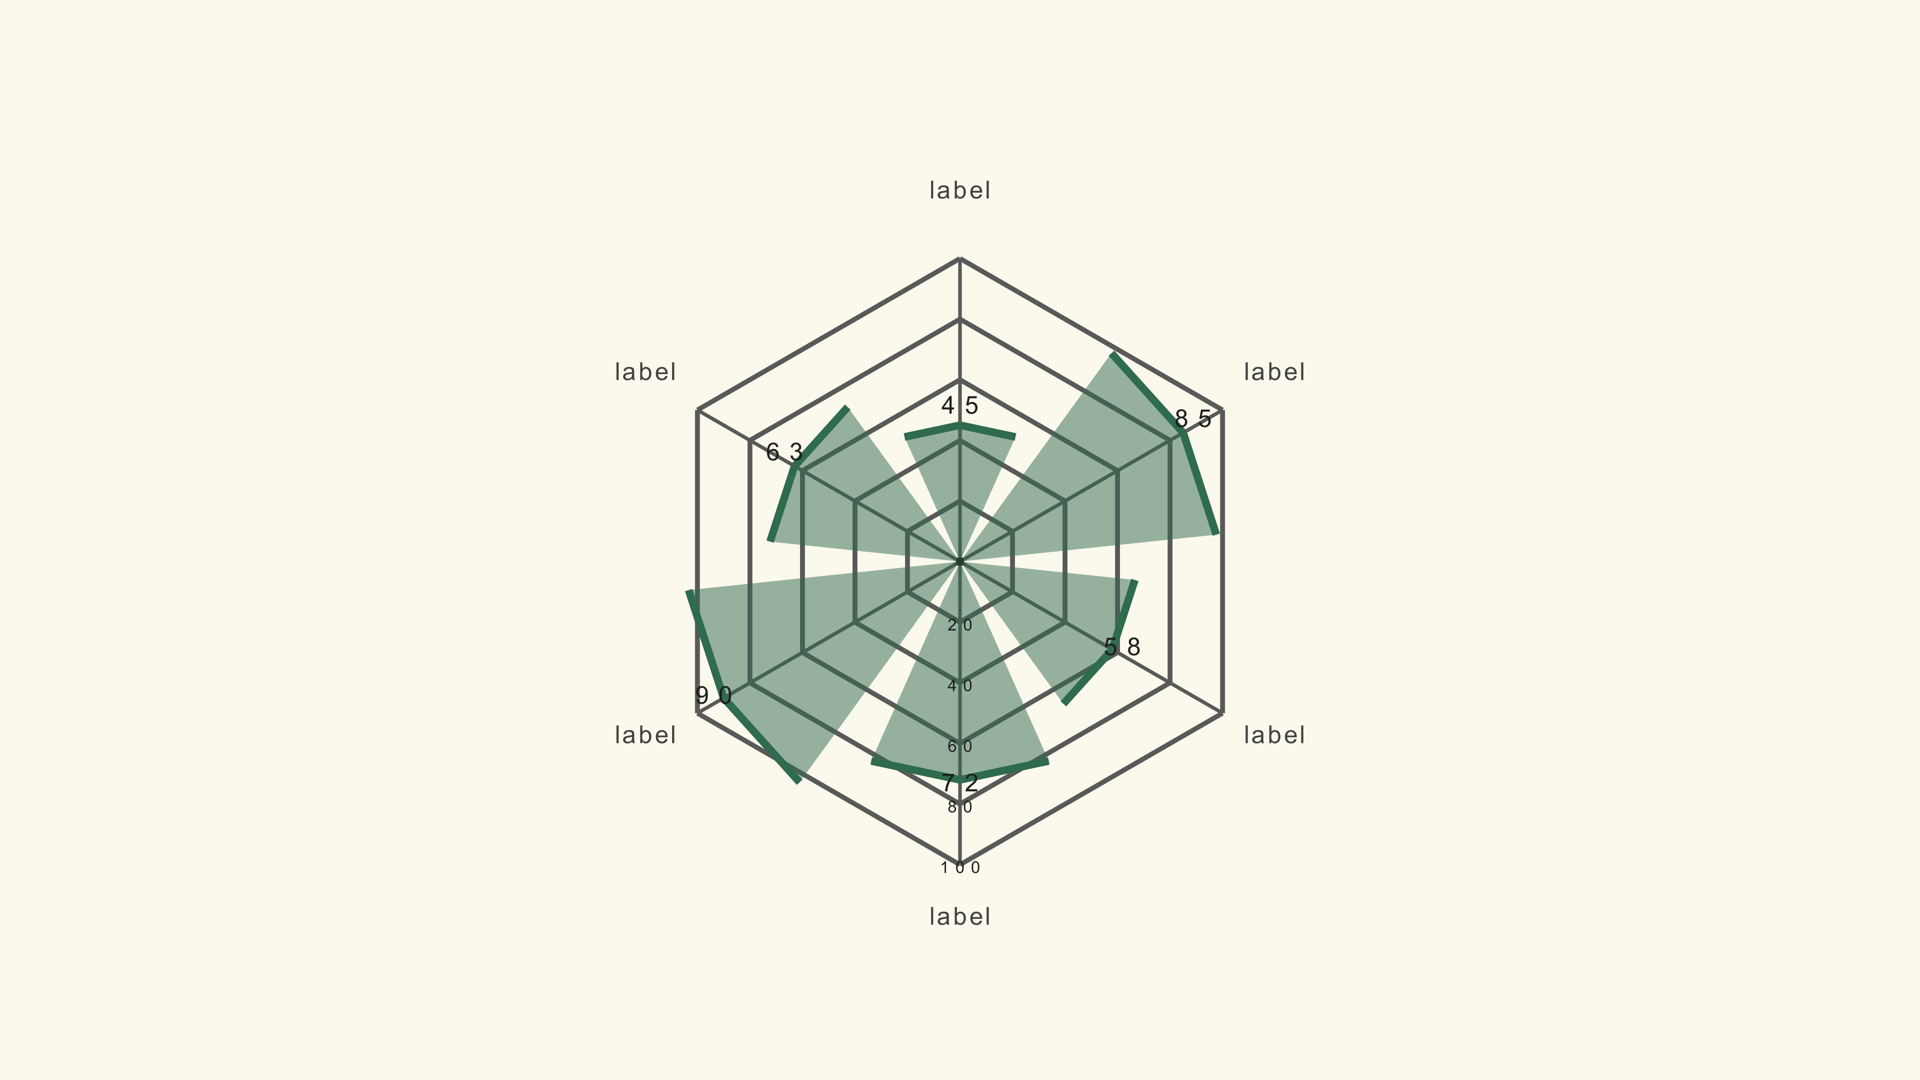
Radar family · radar-polar
Noyris polar-bar radar (per-axis wedges instead of a closed polygon, dark default theme, demo data).
Hierarchy and share of a whole at scale. Best for large nested category sets.
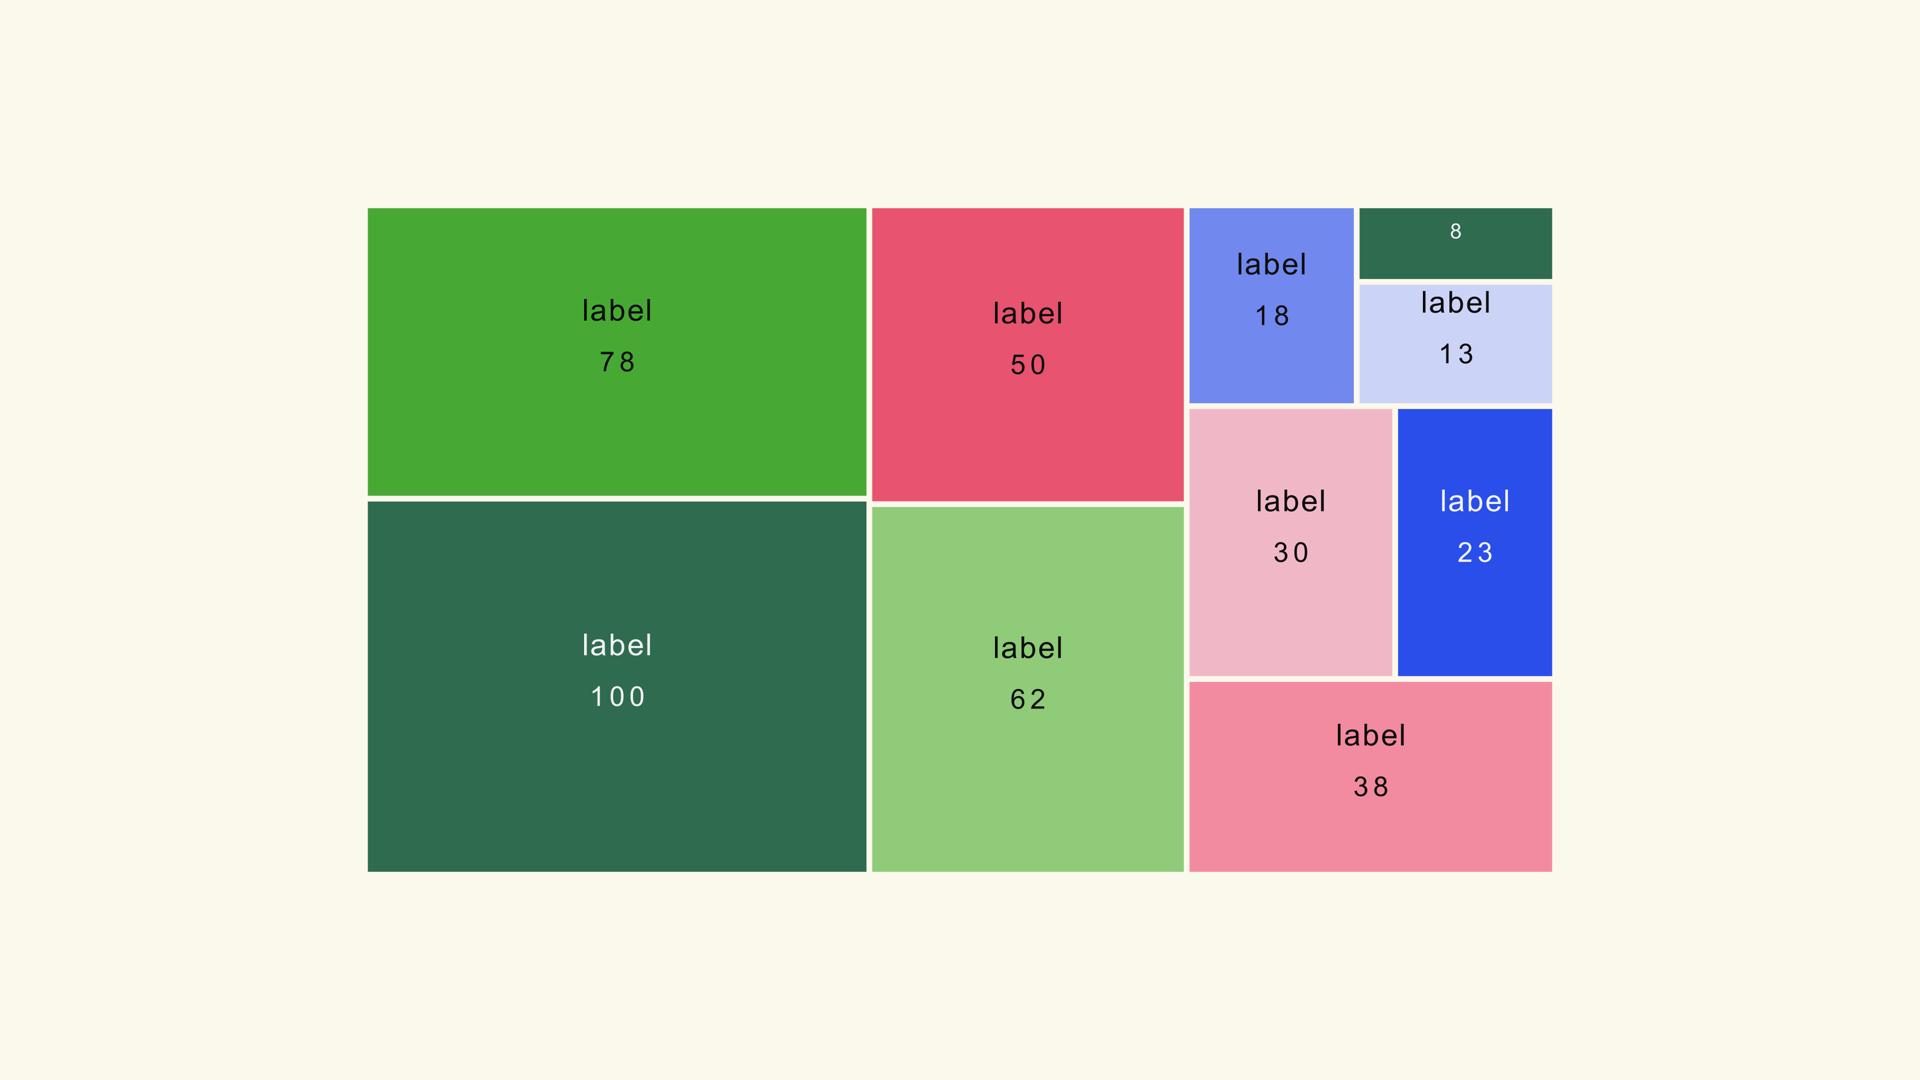
Treemap family · treemap-basic
Noyris squarified flat treemap generator (up to 100 tiles).
Price movement over time. Best for OHLC series where open and close must both read.
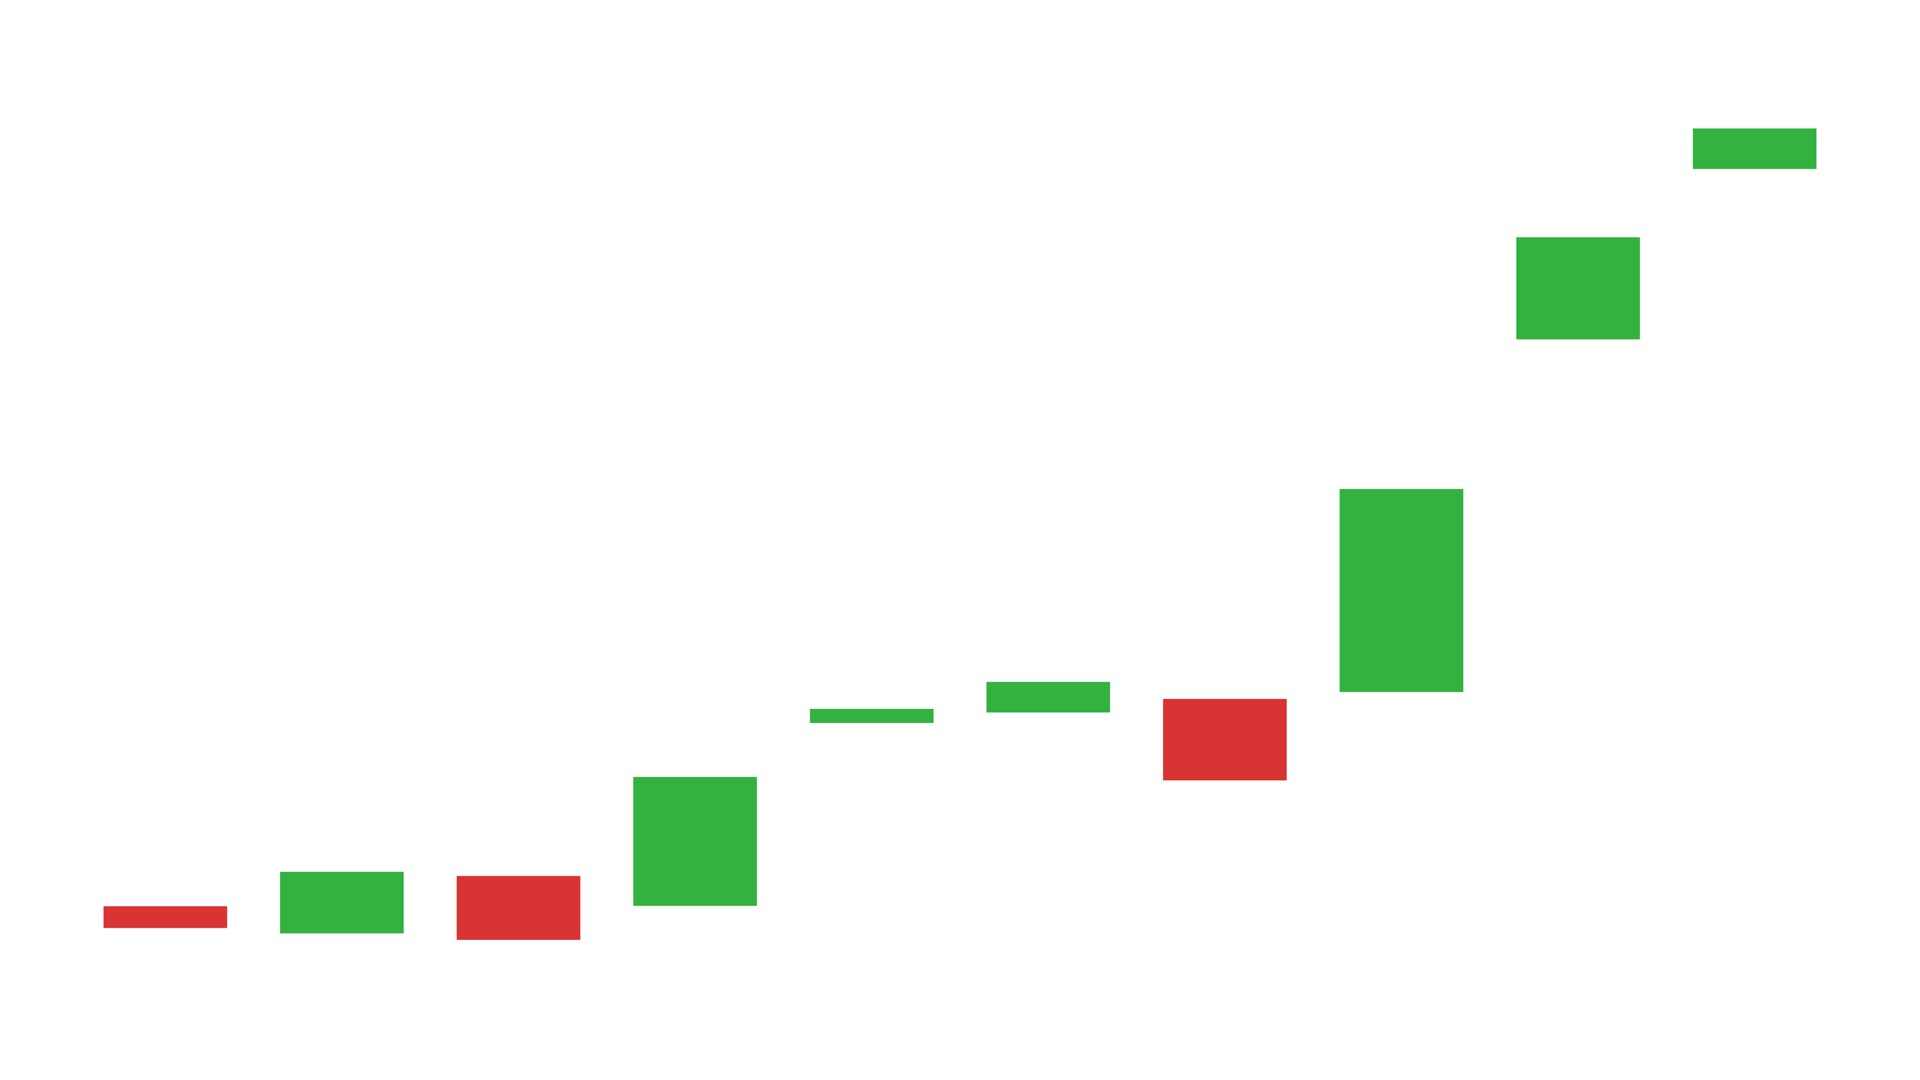
Candle family · candle-body
Noyris candlestick chart generator - body drawn from Open to Close with an optional High/Low wick.
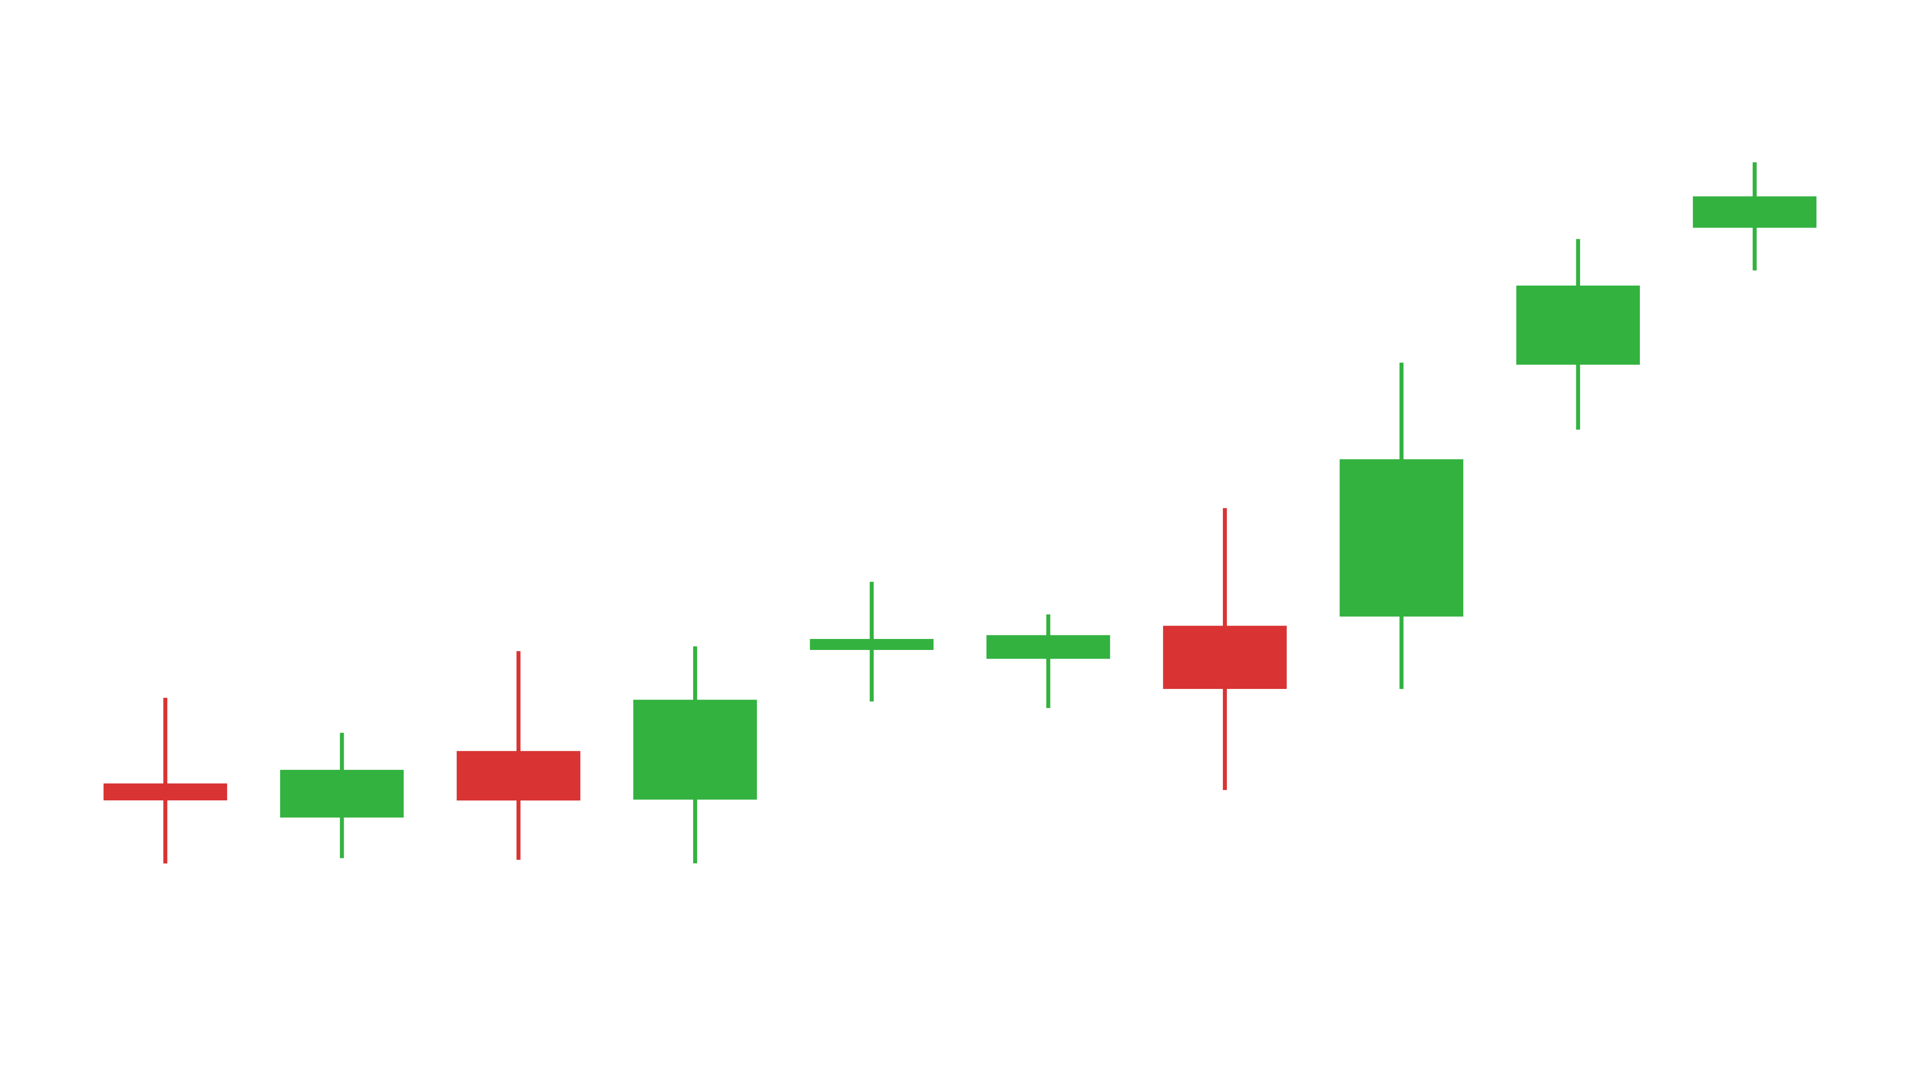
Candle family · candle-wick
Noyris candlestick chart generator (body Open..Close plus High..Low wicks). Every candle sits on its own slot; data lands as open/close gaps on a deterministic random-walk default series, and you pick which CSV columns are Open/High/Low/Close. Bull green, bear red - no grid, no axes, no labels for a clean documentary look.
Ordered shares of a whole. Best when rank matters as much as size.
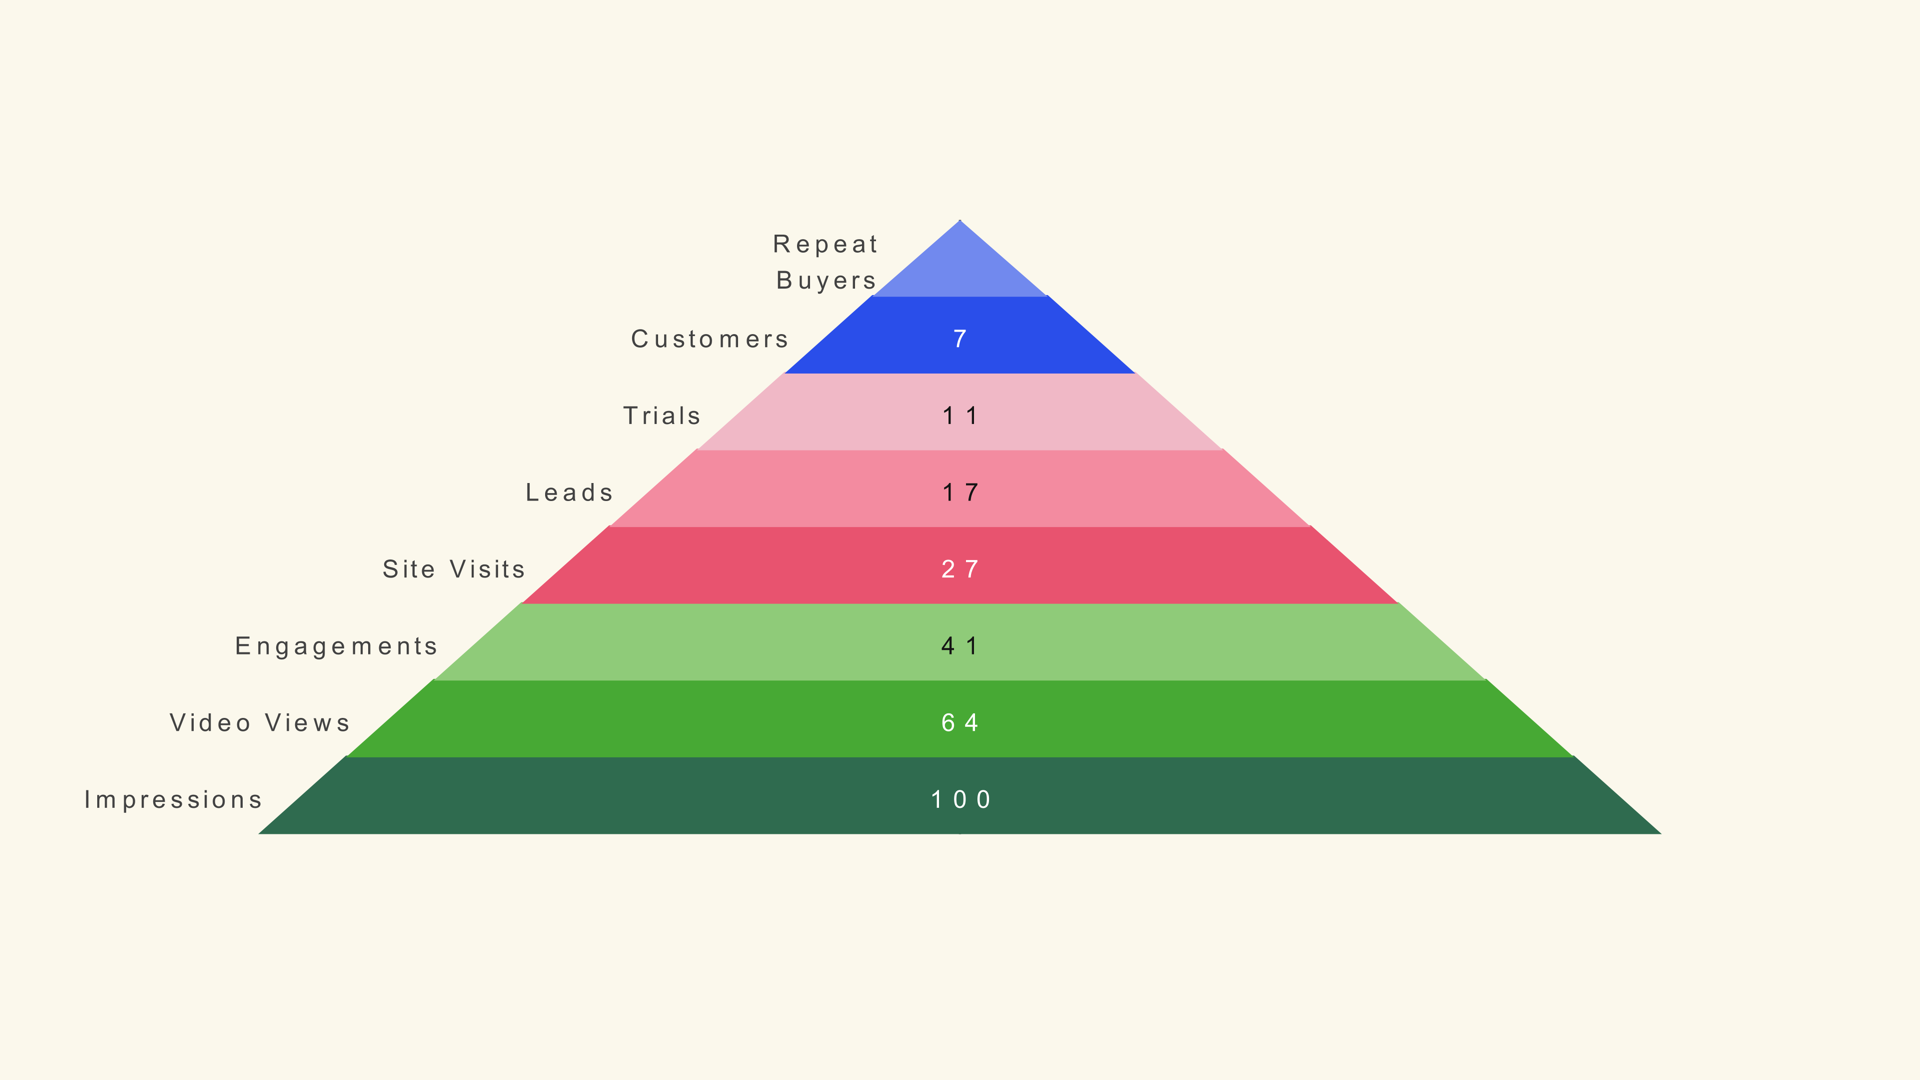
Pyramid family · pyramid
Noyris pyramid chart generator - value-driven sloped trapezoid bands that join into ONE continuous triangle (up to 100 bands). Each band's Value sets its width; Apex Up reads as a population pyramid, Apex Down as an inverted funnel. CSV import, per-band overrides, 204 themes and a built-in grow/stagger animation.
Flow between stages. Best for showing how volume is split, lost and carried through.
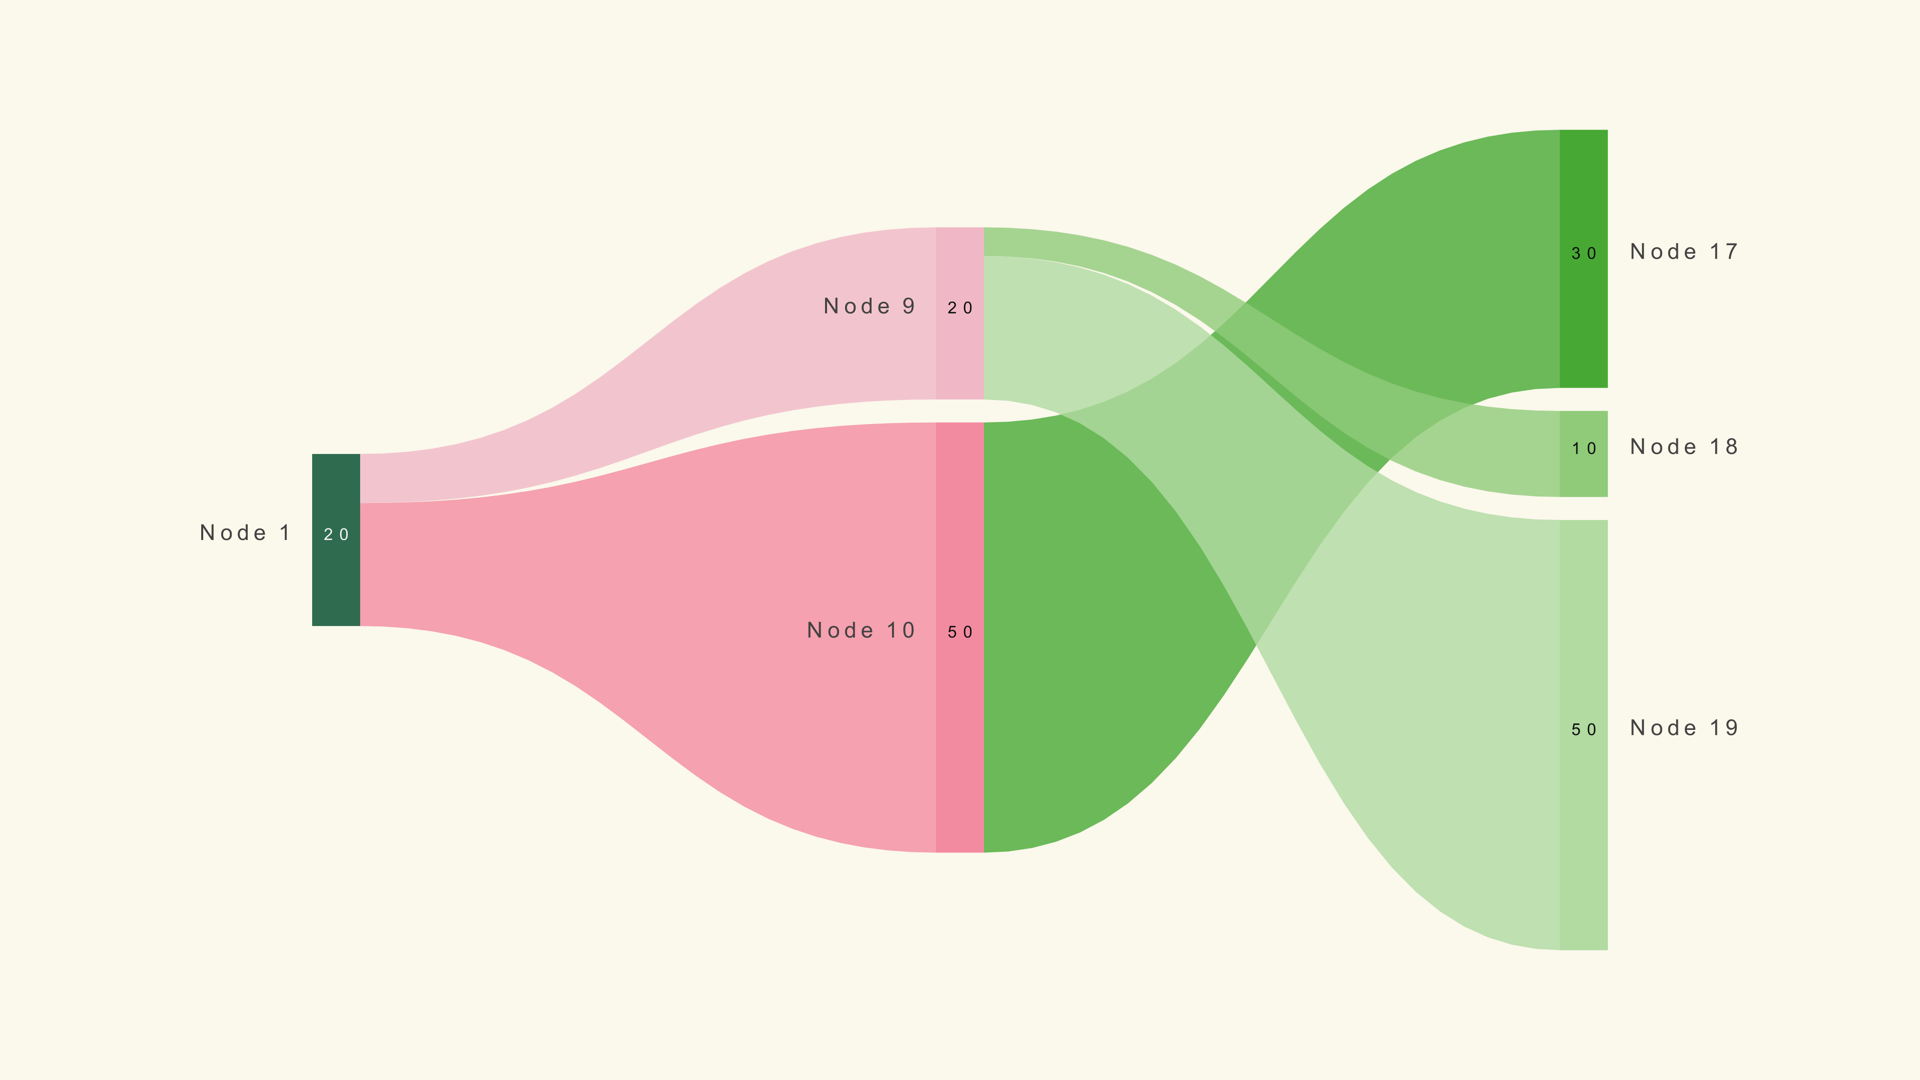
Sankey family · sankey
Noyris sankey flow diagram - ribbons between nodes across up to 8 stage columns, ribbon width proportional to flow value with smooth S-curve ribbons colored by origin group. Manual-only (no CSV): every node is driven by per-column Data-detail controls and links are derived from node parent links. Sugiyama barycenter ordering minimises crossings.
How a starting value becomes an ending value. Best for bridges, deltas and movements to target.
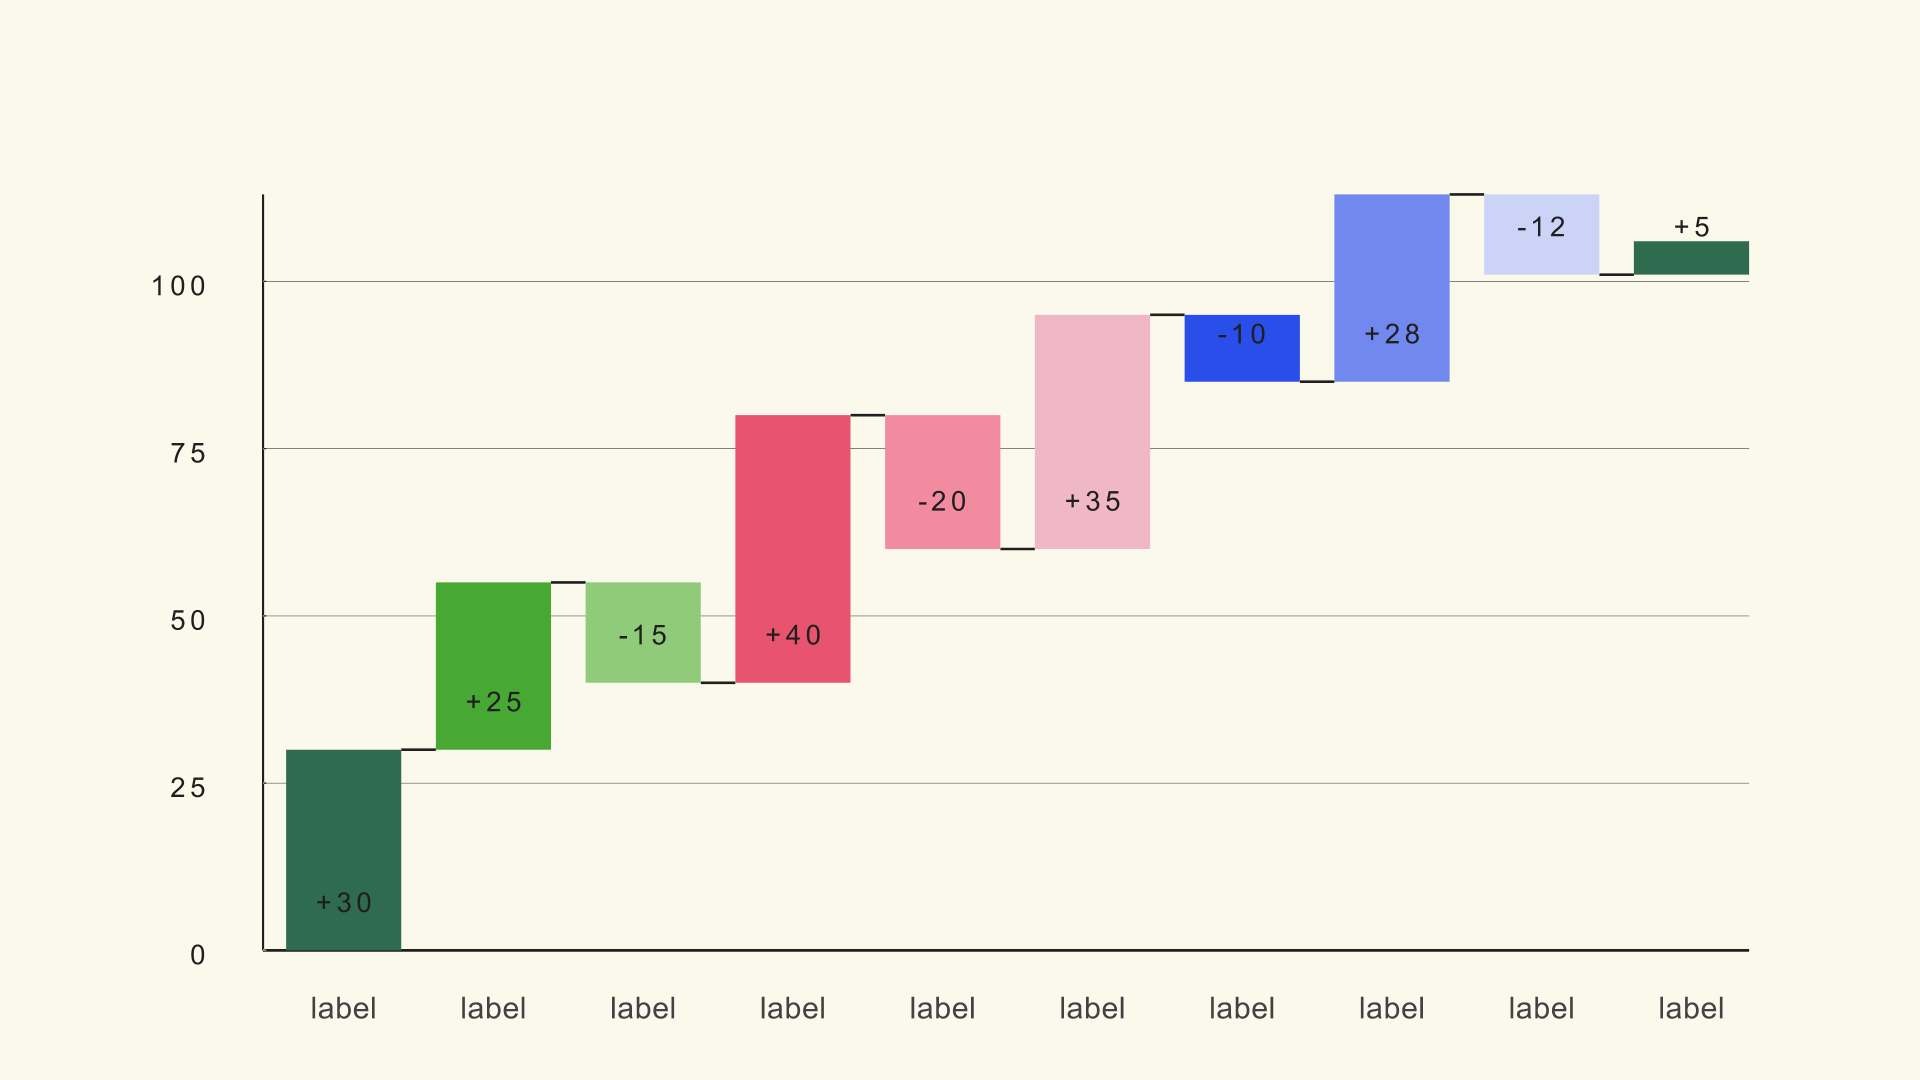
Waterfall family · waterfall
Noyris waterfall chart generator - running-total steps up to 100 bars, each bar spanning from the previous cumulative level to its own and colored by direction (Increase / Decrease / Total). Per-bar DELTA values, optional level connectors, a level-based value axis that auto-fits negative steps, 204 themes and a grow/stagger animation.
Seat share of a legislature. Best for election results where each seat is one vote.
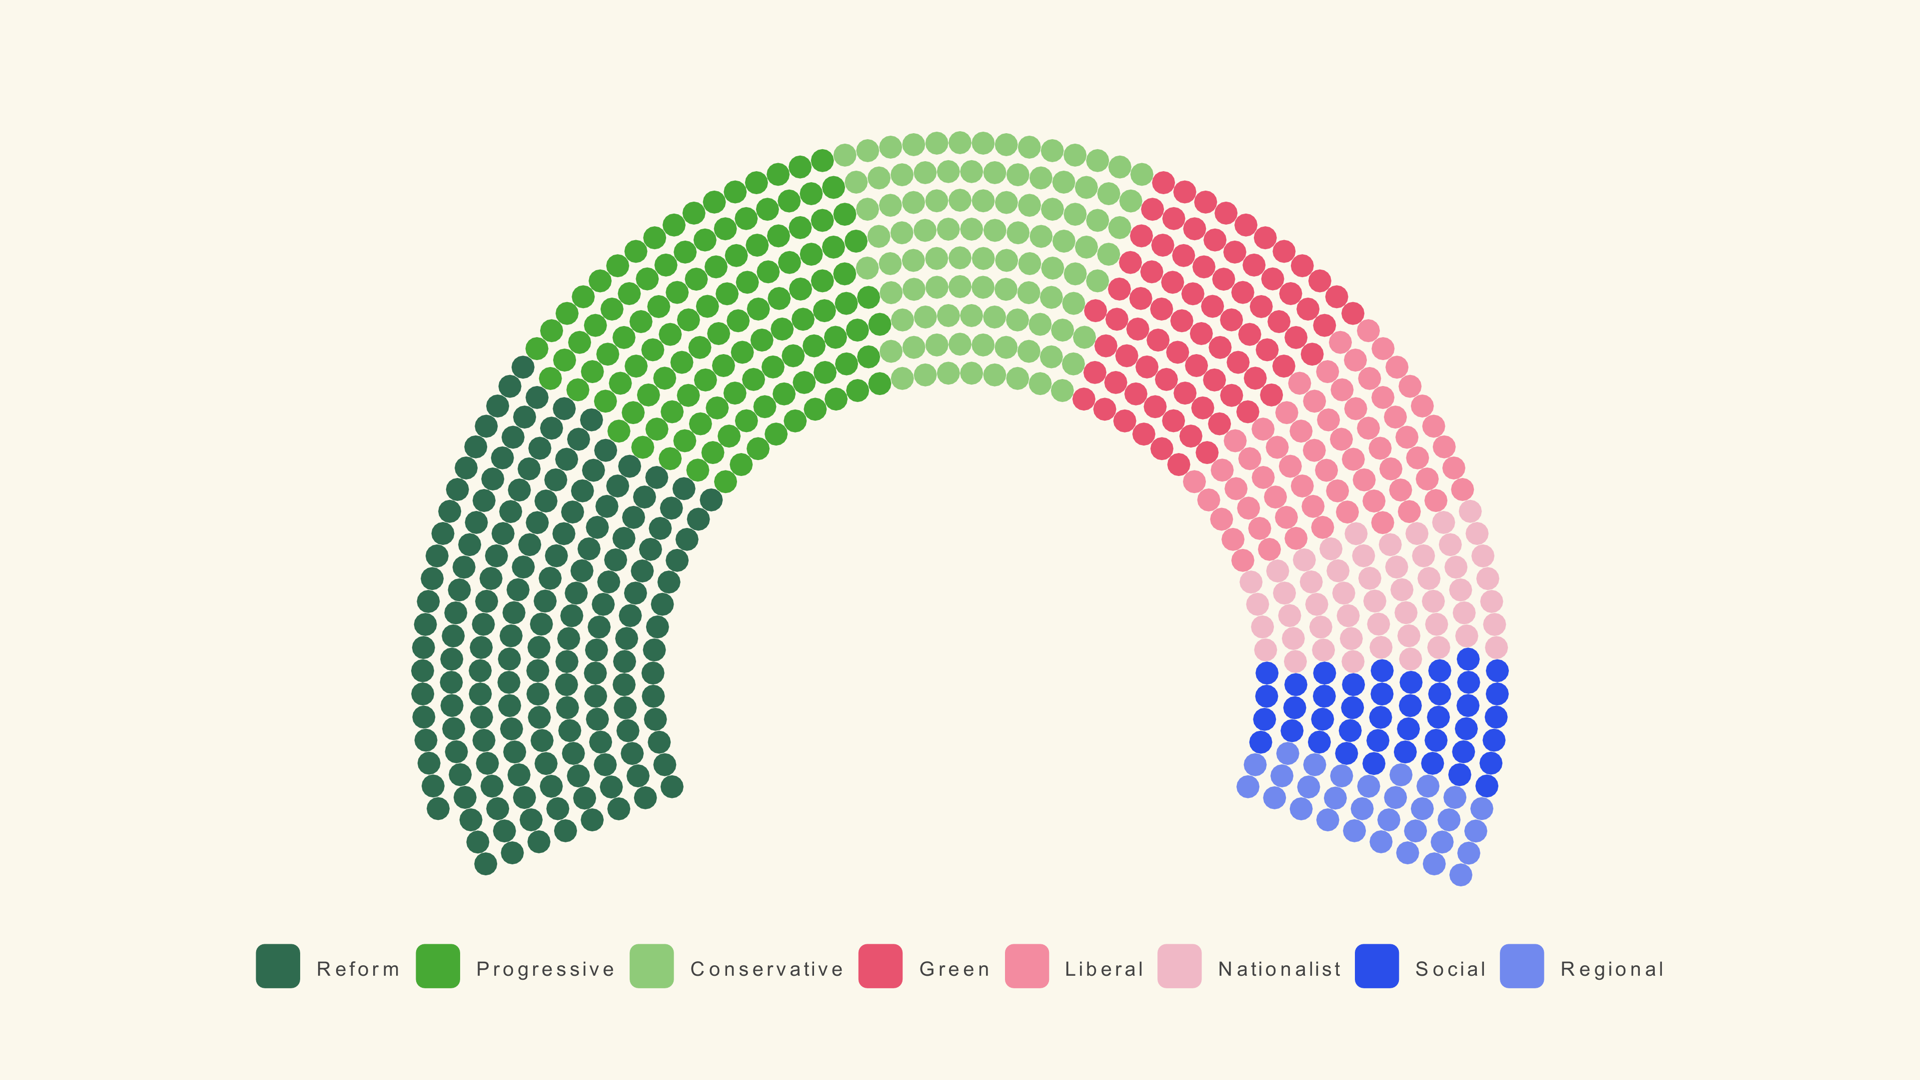
Parliament family · parliament
Noyris parliament chart generator - semicircular seats filled by party share.
Every chart inherits a theme. Themes define the canvas color, the accent, and a 9-color data palette. Apply any of the 204 built-ins instantly, or add your own.
123
Light themes
81
Dark themes
Theme anatomy
{
  name: "Amber Midnight",
  scheme: "dark",          // "light" | "dark"
  bg: "#2a1f1a",           // chart canvas (hex)
  accent: "#f2aa5a",       // highlight accent (hex)
  palette: [...9 colors]   // ink ramp, data ramp, tint ramp
}
The same bar chart, twenty-four themes
Every chart ships in all 204 themes. Below is Bar Basic re-skinned with twenty-four themes from the library - the bars take the data ramp, the labels and grid follow the canvas contrast of the theme, and the accent shows as the dot under each chart.
Acid Breezelight
Aqua Glowlight
Amber Midnightdark
Aqua Duskdark
Azure Dawnlight
Berry Eclipsedark
Berry Mistlight
Bubblegum Glowlight
Chartreuse Mistlight
Cherry Dawnlight
Cherry Morninglight
Cobalt Midnightdark
Copper Morninglight
Copper Nightdark
Crimson Morninglight
Gold Velvetdark
Indigo Dawnlight
Iris Dawnlight
Lagoon Glowlight
Magenta Dawnlight
Marigold Morninglight
Marigold Nightdark
Persimmon Morninglight
Seafoam Morninglight
Sample the palette
Every chart shares the same four Inspector pages - Data, Layout, Style, Animation - and the same plain-English controls. These appear on nearly every chart in the pack; the per-chart tables above list everything else that is specific to a generator.
| Control | On how many charts | What it does |
|---|---|---|
| Animate | 41 of 41 | Turns the intro animation on or off. When off, the chart appears fully drawn right away. |
| Animation Style | 41 of 41 | How the chart appears - grow up from the baseline, or slide in from the side. |
| Background Color | 41 of 41 | Which theme color fills the background (usually the sheet or tint color). |
| Chart Position | 41 of 41 | Moves the plot inside the frame, away from the centre. |
| Duration | 41 of 41 | Total animation length in seconds (the whole reveal). |
| Easing | 41 of 41 | The feel of the motion - soft in and out, or a snappy ease-out. |
| Stagger (s) | 41 of 41 | Wait between each element's animation start. A bigger wait makes a more drawn-out wave. |
| Stagger Order | 41 of 41 | The order the elements appear in - left to right, from the middle outwards, or shuffled. |
| Start | 41 of 41 | Frame/time (seconds) at which the animation begins. |
| Chart Size | 40 of 41 | How much of the frame the plot fills, from a small inset to edge to edge. |
| Apply Theme | 39 of 41 | Turns theming on or off. When on, every chart color comes from the selected theme; when off, the manual color controls are used. |
| Background Color Mode | 39 of 41 | Which theme color fills the background (usually the sheet or tint color). |
| Clip Labels to Reveal | 39 of 41 | Labels mask in with their element instead of appearing all at once. |
| CSV File (optional) | 39 of 41 | Load a .csv to populate the chart in one click - rows are read as label,value (mapping set below). |
| Custom Progress Curve | 39 of 41 | Switch on the custom handles when you need a specific, non-standard curve. |
| Easing Curve | 39 of 41 | Use a ready-made easing curve, or shape your own curve with the handles below. |
| Exaggeration | 39 of 41 | How far the animation pushes past its final position - none, or a strong bounce. |
| Font | 39 of 41 | Font used for all chart text. |
| Handle 1 X | 39 of 41 | Moves the first curve handle sideways to change the timing of the animation. |
| Handle 1 Y | 39 of 41 | Moves the first curve handle up or down to change how much progress happens at that point. |
| Handle 2 X | 39 of 41 | Moves the second curve handle sideways to change the timing of the animation. |
| Handle 2 Y | 39 of 41 | Moves the second curve handle up or down to change how much progress happens at that point. |
| Header Row First | 39 of 41 | Skip the first CSV row (treat it as column names). |
| Label Animation | 39 of 41 | How the labels appear - fade in, or pop in with the element. |
| Letter Spacing | 39 of 41 | Tracking (letter-spacing) for chart labels. |
| Settle | 39 of 41 | How long the overshoot takes to settle into final position (seconds). |
| Show Background | 39 of 41 | Fills the whole frame with the theme/mood background color. Turn off for full transparency over your footage. |
| Style | 39 of 41 | Font style variant (Regular / Bold / Italic). |
| Theme | 39 of 41 | Choose one of the built-in color themes. Each theme has a matching palette of colors. |
| Value Label Color | 39 of 41 | Color of the value labels. |
| Value Label Color Mode | 39 of 41 | Color of the value labels. |
| Value Label Gap | 39 of 41 | Distance between the data element and its value label. |
| Value Label Size | 39 of 41 | Font size of the value labels. |
| Visible | 39 of 41 | Shows or hides this data element (bar / slice / point / series) on the chart. |
| Category Label Color | 38 of 41 | Color of the category labels. |
| Category Label Color Mode | 38 of 41 | Color of the category labels. |
| Label | 38 of 41 | The text shown on or next to this element (category name, slice label, axis name). |
| Number Format | 38 of 41 | How numbers are written - plain, shortened (like 1.5k), or grouped with separators and decimals. |
| Show Value Labels | 38 of 41 | Draws the numeric value label on each data element. |
| Category Label Gap | 37 of 41 | Distance between the data element and its category label. |
| Category Label Size | 37 of 41 | Font size of the category labels. |
| Decimals | 37 of 41 | How many decimal places value labels show. |
| Label Column (0=first) | 37 of 41 | Which column of the CSV file holds the element labels. |
| Prefix | 37 of 41 | Text prepended to every value label (e.g. '$'). |
| Show Category Labels | 37 of 41 | Draws the category / element name next to each data element. |
| Suffix | 37 of 41 | Text appended to every value label (e.g. 'pt'). |
The full per-chart picture - every control, its default, its min–max range, and what it does - is one Controls click away on each chart card.
Everything in the pack is a native Fusion generator - nothing to learn, nothing to compile, nothing that breaks when Resolve updates.
41 Fusion chart generators
One native CT_SourceTool generator per chart type, across 12 families - bars, lines, areas, pies, bubbles, radars, treemap, candle, pyramid, sankey, waterfall and parliament. Each renders as a generator and exposes every control in the Inspector.
204 curated color themes
204 hand-tuned themes (123 light, 81 dark). Apply Theme drives every fill and element color; switch it off and per-element overrides take over.
One shared control system
Every chart has the same four Inspector pages - Data, Layout, Style, Animation - with plain-English controls plus a family's own extras. Learn one chart and every chart behaves the same way.
A built-in animation engine
Grow, slide and stagger reveals with Start / Duration / Stagger timing, per-family styles (bars shake in, lines draw, pies sweep). Animate is a single checkbox, default off.
A CSV import engine
Point any chart at a CSV and it maps columns to values - 0-based columns, header-row skipping, and per-series column picking on multi-series charts.
Installer + manual install + thumbnails
The one-click NoyrisCharts_Installer.lua, a no-script manual zip that mirrors your Fusion folder layout, and a RenderThumbs script that renders just the thumbnails that are missing or out of date.
There is no export step inside the charts - they render where they live, on your timeline.
Render like any other generator
Charts live on the timeline as ordinary Fusion generator clips, so you hand them off exactly like your footage - add them to your timeline and use the Deliver page with any preset, in Resolve Free or Studio.
Animation runs on timeline time
The Animation tab's Start, Duration and Stagger are in seconds, driven by the timeline. Animate defaults to off, so expect to switch it on and set a Start before the reveal shows.
Rerender when data changes
A chart redraws when its inputs or the frame change, so scrub or reopen after editing values. There is no stale cache to clear.
Keep color consistent across charts
Turn Apply Theme on and every chart in the timeline sits in the same theme. Export with an alpha-safe format if you lay charts over background footage.
Resolves to the issues that actually break a first run - everything else is a slider away in the Inspector.
Quit Resolve fully (Cmd+Q / Ctrl+Q) after installing - Resolve scans Fuses only at startup. Confirmed the files landed in the Fusion folder? On macOS that is ~/Library/Application Support/Blackmagic Design/DaVinci Resolve/Fusion/Fuses, not the Preferences folder. When in doubt, rerun NoyrisCharts_Installer.lua, which places everything itself.
Run Workspace → Scripts → Comp → RenderThumbs once. It renders only what's missing, broken, or whose .fuse changed, so it is fast and safe to rerun after edits.
Animate defaults to off on every chart. Open the Animation tab, switch Animate on, set a Start, and check Duration and Stagger.
Generators evaluate when their inputs or the current frame change. Scrub the playhead to the chart - if a value looks stale, move the playhead or reopen the Inspector.
Columns are 0-based: Value Column defaults to 1 (the second column), Label Column to 0 (the first). Multi-series charts read the next columns per series. Turn Header Row First on to skip a header row. Values are percentages of Chart Max by default.
Apply Theme defaults to off, so per-element overrides seed from a neutral brand palette rather than the hovered theme. Switch Apply Theme on to force the theme's colors everywhere.
One purchase, forever
A single $59 payment. Noyris Charts is not a subscription - you keep the files and get every future chart and theme update at no extra cost.
Commercial use included
The license covers client projects, monetized video and paid social content. No attribution required, no per-project fees.
7-day guarantee
If a chart does not do what is documented here, contact us within 7 days of purchase for a full refund.
Support
Every Inspector control is documented on its chart page, and the Troubleshooting section above covers first-run issues. For anything else, reach out through the store and we reply with a fix or a workaround - not boilerplate.
Yes. Every chart is a native Fusion generator and runs in both Resolve Free and Resolve Studio - no Studio-only features required.
DaVinci Resolve 18 through 21 on macOS and Windows.
No. It is a one-time $59 payment. You keep the files forever and get every future chart and theme update free.
Yes. The commercial license covers client projects, monetized video and paid social content. No attribution required.
No. Everything is exposed as simple Inspector controls - you never need to open the node graph.
If a chart does not do what is documented here, contact us within 7 days for a full refund.