On this page
All 41 charts
Click a chart to open its page
Bar9
Treemap1
Candle2
Pyramid1
Sankey1
Waterfall1
Parliament1
Sankey family
Sankey: Flow Diagram for DaVinci Resolve
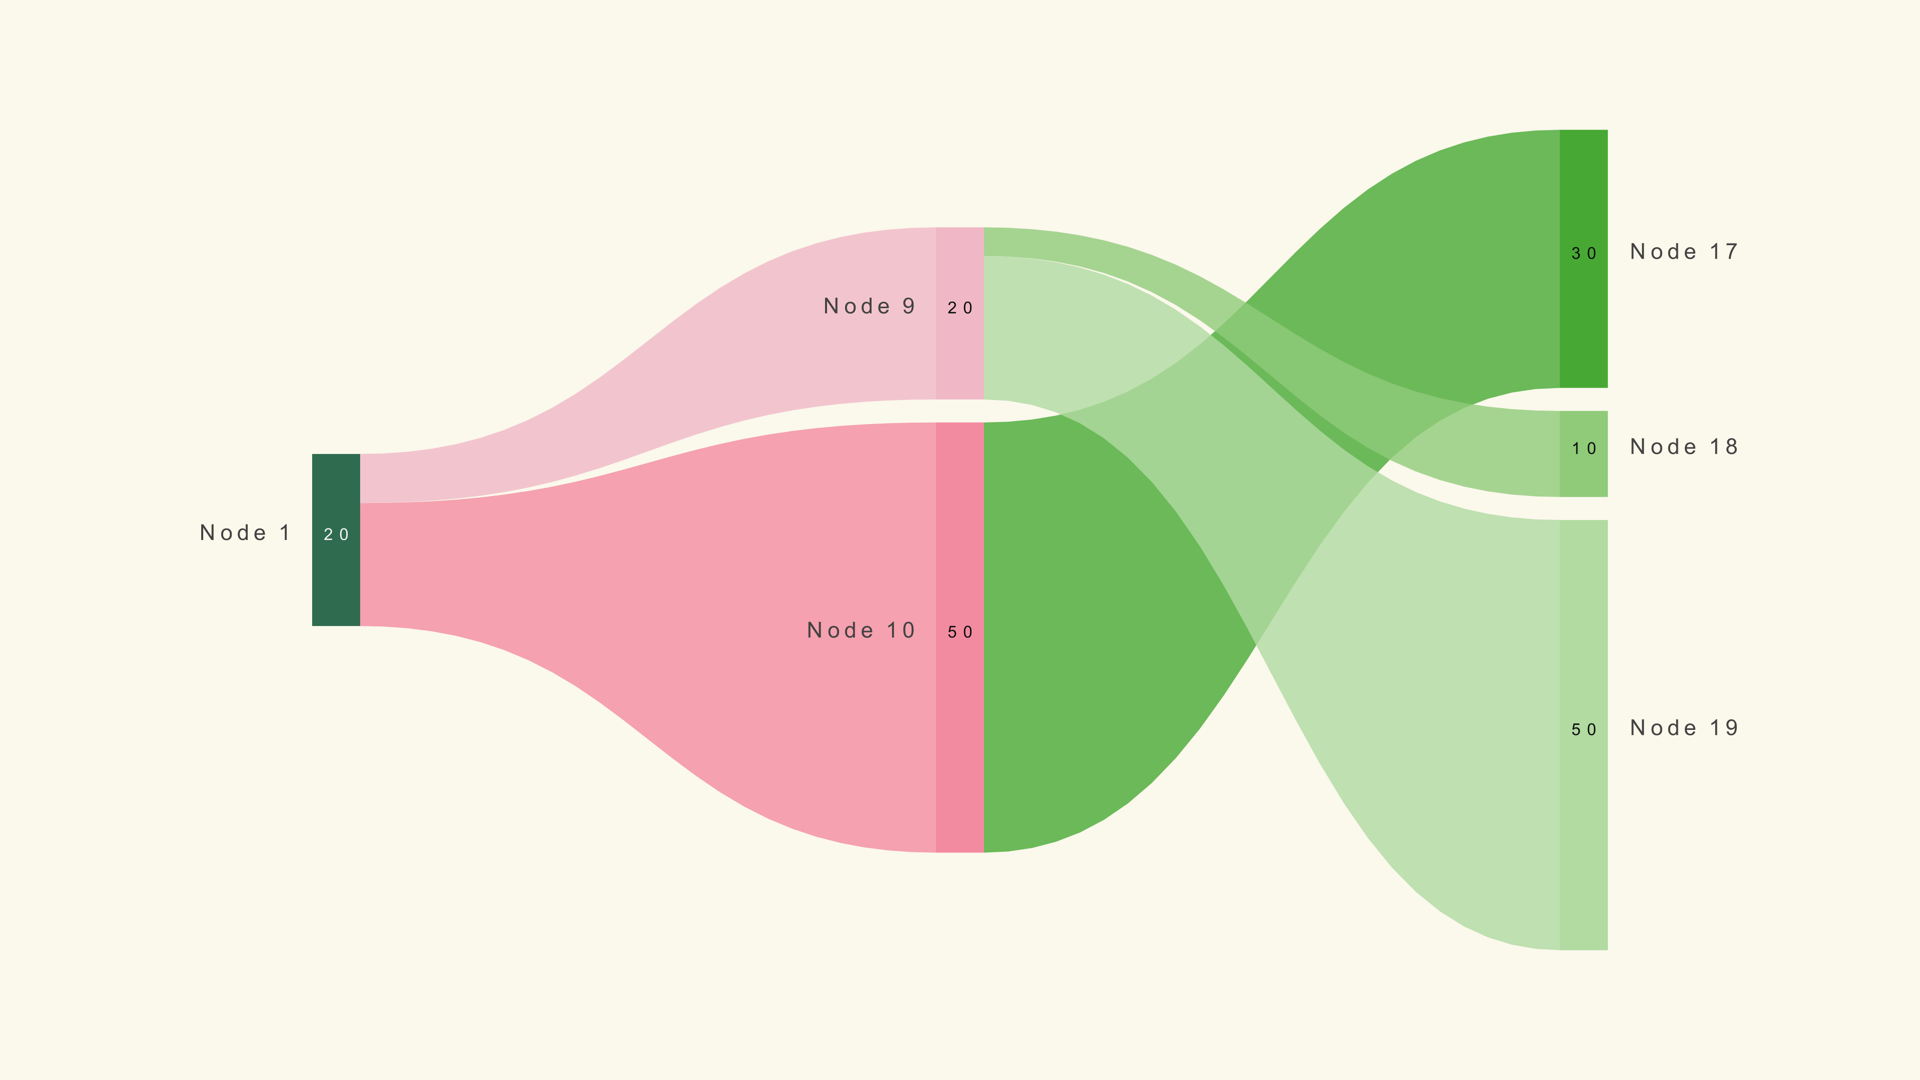
Sankey draws flows between stages so the audience can see where volume enters, splits and leaves. It is built for budgets, energy, supply chains and audience journeys.
Updated November 2026By Noyris Charts TeamTested on DaVinci Resolve 18-21
67
controls
4
Inspector pages
8
columns
100%
Resolve-native
Chart guide
The generator supports up to eight stage columns. Each node has a label and a flow value, and ribbons are derived from the parent links, so a node in a later column draws a ribbon back to the input that feeds it.
This chart is manual-only: there is no CSV feed. That is deliberate. A Sankey needs a small, deliberate set of nodes, and building it directly in the Inspector keeps the flow structure readable.
When to use Sankey
Budget and revenue flows
Show how gross revenue splits into costs, taxes and profit, then how each cost line is allocated across teams.
Energy and production chains
Trace inputs through conversion stages to final output. Flow-weighted ribbons make losses and carry-over visible.
Audience or customer journeys
Map how a starting audience splits across channels and stages, with the ribbon width showing the volume at each step.
Data format and sample file
Sankey is manual-only. Set the number of Columns, choose an Active Column, then give each node a Label, Flow value and Links From parent.
Build the flow in the Data page
| Column | Type | What it holds |
|---|---|---|
| Columns | number | How many stages the flow uses, up to eight. |
| Nodes in Column | number | How many nodes sit in the active stage. |
| Label | text | Name printed beside the node. |
| Flow | number | Volume into the node; ribbon width follows it. |
| Links From | number | Parent input for this node; later columns use the next input group. |
There is no CSV import for this chart. Work left to right and check the ribbons after each stage.
Settings that make it look right
These are the controls worth setting first. Every value can be changed later on the chart's own Inspector pages below.
| Control | Start with | Why |
|---|---|---|
| Columns | 3 | A clear source, split and outcome structure. |
| Nodes in Column | 2-4 | Keeps each stage readable without ribbon overlap. |
| Auto Arrange | On | Lets the layout reduce crossings while you build. |
| Column Gap | 0.3 | Leaves room for node labels between stages. |
| Ribbon Curviness | 1 | A full S-curve reads as a flow rather than a diagram line. |
| Normalize Column Heights | Off | Keeps the ribbon widths honest to the actual values. |
| Duration | 1.2 s | Gives the flow reveal time to follow the path. |
Build it in DaVinci Resolve
1
Set the stages
Decide how many columns the story needs and how many nodes each stage holds. Build the first column before adding downstream nodes.
2
Enter nodes and parents
For each node, set Label, Flow and Links From. Work left to right and check that every ribbon has the parent you expect.
3
Tune the layout
Turn Auto Arrange on to reduce crossings, then adjust Column Gap, Ribbon Curviness and node spacing. Animate after the topology is locked.
Look and feel
This is one of 41 native chart generators.
Get the full Noyris Charts pack for $59, one time.
Frequently asked questions
Can I import a CSV into Sankey?+
No. Sankey is manual-only by design. You build the nodes and parent links directly in the Data page.
How many stages can I show?+
Up to eight columns. Three to five stages is usually enough for a clear story.
How are the ribbons calculated?+
Each node has a Flow value and a Links From parent. The ribbon connects the parent to the node and its width follows the flow.
Why does a ribbon disappear?+
A missing or non-adjacent parent drops the ribbon. Check the Links From value for that node.
Related chart guides
Quick start
- 1Drag the generator from Effects → Generators → Noyris Charts onto your clip.
- 2Enter your values in the Data page (or load a CSV).
- 3Adjust Layout to size and space the chart.
- 4Pick a theme or manual colors in Style.
- 5Check Animate and hit play - the grow-in, stagger and easing are built in.
Inspector reference
All four Inspector pages shown exactly as they look in Resolve · the panel on the left explains every control
Data
Noyris Charts by noyris.com
Graph
Pick a column to edit its nodes. Only the selected column's node rows are shown below; every column keeps its node-count slider. Links From is the parent node's slot number. Column 1 = slots 1-8, Column 2 = 9-16, Column 3 = 17-24, Column 4 = 25-32, Column 5 = 33-40, Column 6 = 41-48, Column 7 = 49-56, Column 8 = 57-64. Flow is the amount travelling down that link.
Columns
How many stages (columns) the flow is drawn across. The stage sliders below keep their node counts even when this is lowered.
Active Column
Which stage's node rows the detail controls below edit. Switching it shows a different column without changing the others' colors or counts.
Options: 1, 2, 3, 4, 5, 6, 7, 8
Column× 8 columns
Nodes in Column
How many nodes the first column holds.
Node× 8 nodes
Visible
Shows or hides this element (bar / slice / point / series) on the chart.
Label
The text printed for this element. Blank means the chart draws no label for it.
Flow
The amount travelling into this node. Ribbon thickness is scaled to the flow, so a larger value draws a wider ribbon.
Links From
Which input feeds this node. The first column uses the first group of inputs, the second column the next, and so on; a missing or non-adjacent parent drops the ribbon.
Node Color
The color this node and its outgoing ribbons are drawn in.
Layout
Noyris Charts by noyris.com
Geometry & Card
Chart Position
Moves the plot inside the frame, away from the centre.
Chart Size
How much of the frame the plot fills, from a small inset to edge to edge.
Node Width
How thick each node block is.
Node Gap
Space between nodes stacked in the same column.
Auto Arrange
Let the layout pack nodes and route ribbons automatically; turn it off to place nodes by hand.
Column Gap
Horizontal space between the stages.
Ribbon Curviness
How curved each ribbon is between nodes - a straight band, or a full S-curve.
Ribbon Samples
How many segments each ribbon is drawn with; higher is smoother on tight curves.
Ribbon Opacity
Opacity of the ribbons where they overlap nodes and each other.
Node Corner Rounding
Rounds the corners of each node block.
Normalize Column Heights
Makes every column the same total height, so stages are compared by share rather than by overall size.
Plot Left Margin
Space kept clear of the frame edge on the left, before the plot area starts.
Plot Right Margin
Space kept clear of the frame edge on the right, after the plot area ends.
Plot Top Margin
Space kept clear of the frame edge at the top, above the plot area.
Plot Bottom Margin
Space kept clear of the frame edge at the bottom, below the plot area.
Value Formatting
Prefix
Text prepended to every printed value, such as a currency symbol.
Suffix
Text appended to every printed value, such as a unit.
Number Format
How numbers are written - plain, with thousands separators, or as a percentage.
Options: Plain, Thousands, Compact (K/M/B)
Decimals
How many decimal places printed values keep.
Labels & Title
Show Value Labels
Print each element's value next to it.
Value Label Size
Size of the printed value labels.
Value Label Gap
Space between an element and its printed value.
Show Node Labels
Print each node's name beside it.
Node Label Size
Size of the printed node names.
Node Label Gap
Space between a node and its printed name.
Show Link Labels
Print each ribbon's flow value on the link.
Link Label Size
Size of the flow value printed on each ribbon.
Font
Typeface used for every label on the chart.
Style
Weight and slant of the chart's type.
Letter Spacing
The spacing between the letters in the labels.
Style
Noyris Charts by noyris.com
Apply Theme
Push the selected theme's palette, type and motion onto the chart in one step, then keep editing from there.
Theme & Color
Push one node and its links forward and dim the rest. 0 turns highlighting off. Ribbons take the Source node's color or the Target node's color.
Theme
The preset look this chart starts from. Applying it resets color, type and motion together.
Node Color Mode
How nodes take color - each column from the theme, or each node from its own override.
Options: Column, Node
Highlight Node
Highlights one node and its links while dimming the rest. Leave it off to turn highlighting off.
Link Color
Whether a ribbon takes the source node's color or the target node's color.
Options: Source, Target
Background
Show Background
Draw the chart's own backing card behind the plot.
Background Color Mode
Choose whether the background color comes from the selected theme, or from the manual swatch below.
Options: Theme, Manual
Background Color
Color of the backing card.
Value Label
Value Label Color Mode
Choose whether the value label color comes from the selected theme, or from the manual swatch below.
Options: Theme, Manual
Value Label Color
Color of the printed value labels.
Node Label
Node Label Color Mode
Choose whether the node label color comes from the selected theme, or from the manual swatch below.
Options: Theme, Manual
Node Label Color
Color of the printed node names.
Animation
Noyris Charts by noyris.com
Animate
Master switch for the entrance animation. Turn it off to render the finished chart immediately.
Animation Style
How the chart enters - drawn on, grown from the baseline, or faded up.
Options: Draw, Grow, Fade, Bounce, Elastic, Pop, Water
Stagger Order
The order elements come in: left to right, right to left, or smallest value first.
Options: Forward, Reverse, Center Out, Random, By Column
Start
When the animation begins, in seconds from the start of the comp.
Duration
How long the whole entrance takes, in seconds.
Stagger (s)
Wait added between each element's start, so they appear one after another.
Easing
How the entrance speeds up and slows down - steady, eased, or springy.
Options: Linear, Ease In, Ease In Out, Ease Out, Smooth, Back, Elastic, Bounce, Spring
Exaggeration
How far past its final position the first element overshoots on a spring entrance.
Settle
How many of the follow-through wobbles are shown before the value rests.
Label Animation
How the labels arrive - with their element, or after everything has settled.
Options: None, Fade, Pop
Clip Labels to Reveal
Keep each label hidden until its own element has grown past it.
Easing Curve
The shape of your custom acceleration curve for the entrance.
Options: None, Snappy, Soft, Liquid
Custom Progress Curve
Replaces the built-in easing with the curve you shape below.
Options: Disabled, Custom
Handle 1 X
Horizontal position of the first curve handle - the ease-in side.
Handle 1 Y
Vertical position of the first curve handle - the ease-in side.
Handle 2 X
Horizontal position of the second curve handle - the ease-out side.
Handle 2 Y
Vertical position of the second curve handle - the ease-out side.
All 41 charts
Bar
Treemap
Candle
Pyramid
Sankey
Waterfall
Parliament