On this page
All 41 charts
Click a chart to open its page
Bar9
Treemap1
Candle2
Pyramid1
Sankey1
Waterfall1
Parliament1
Line family
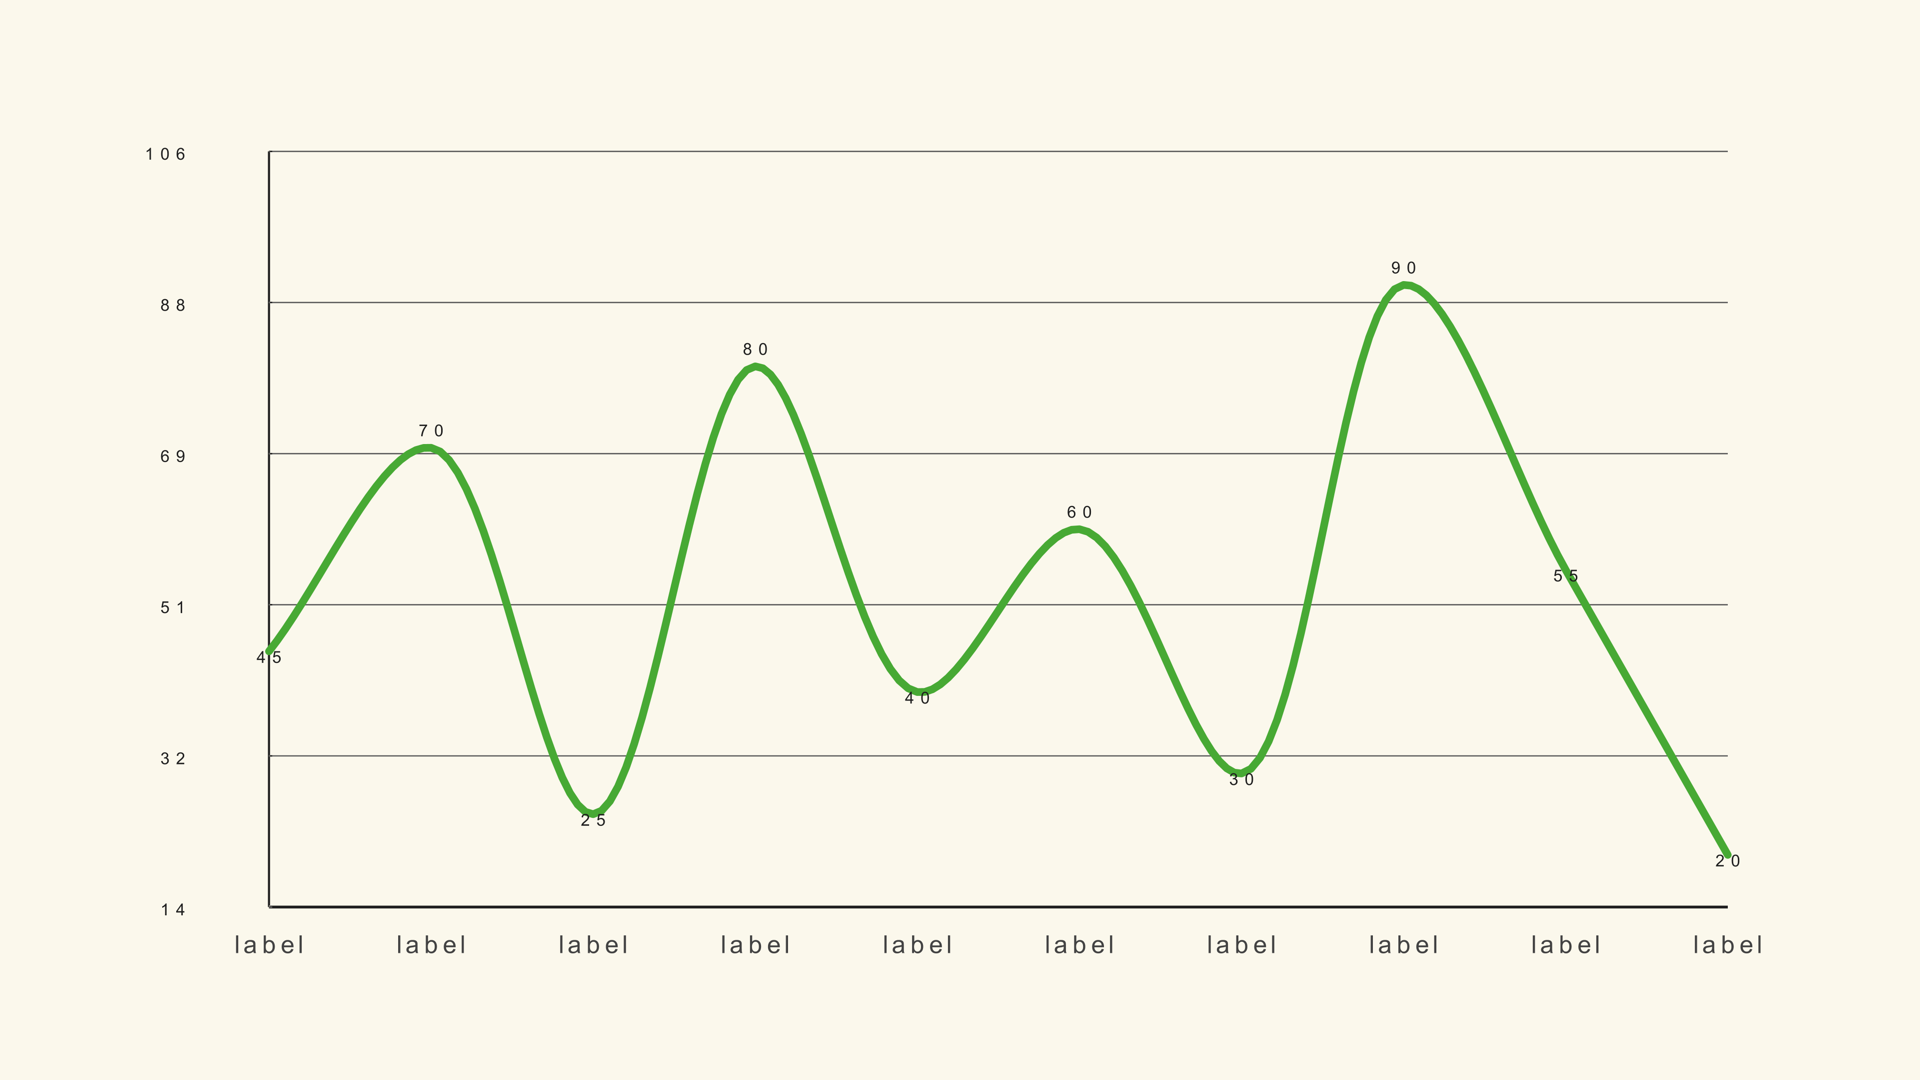
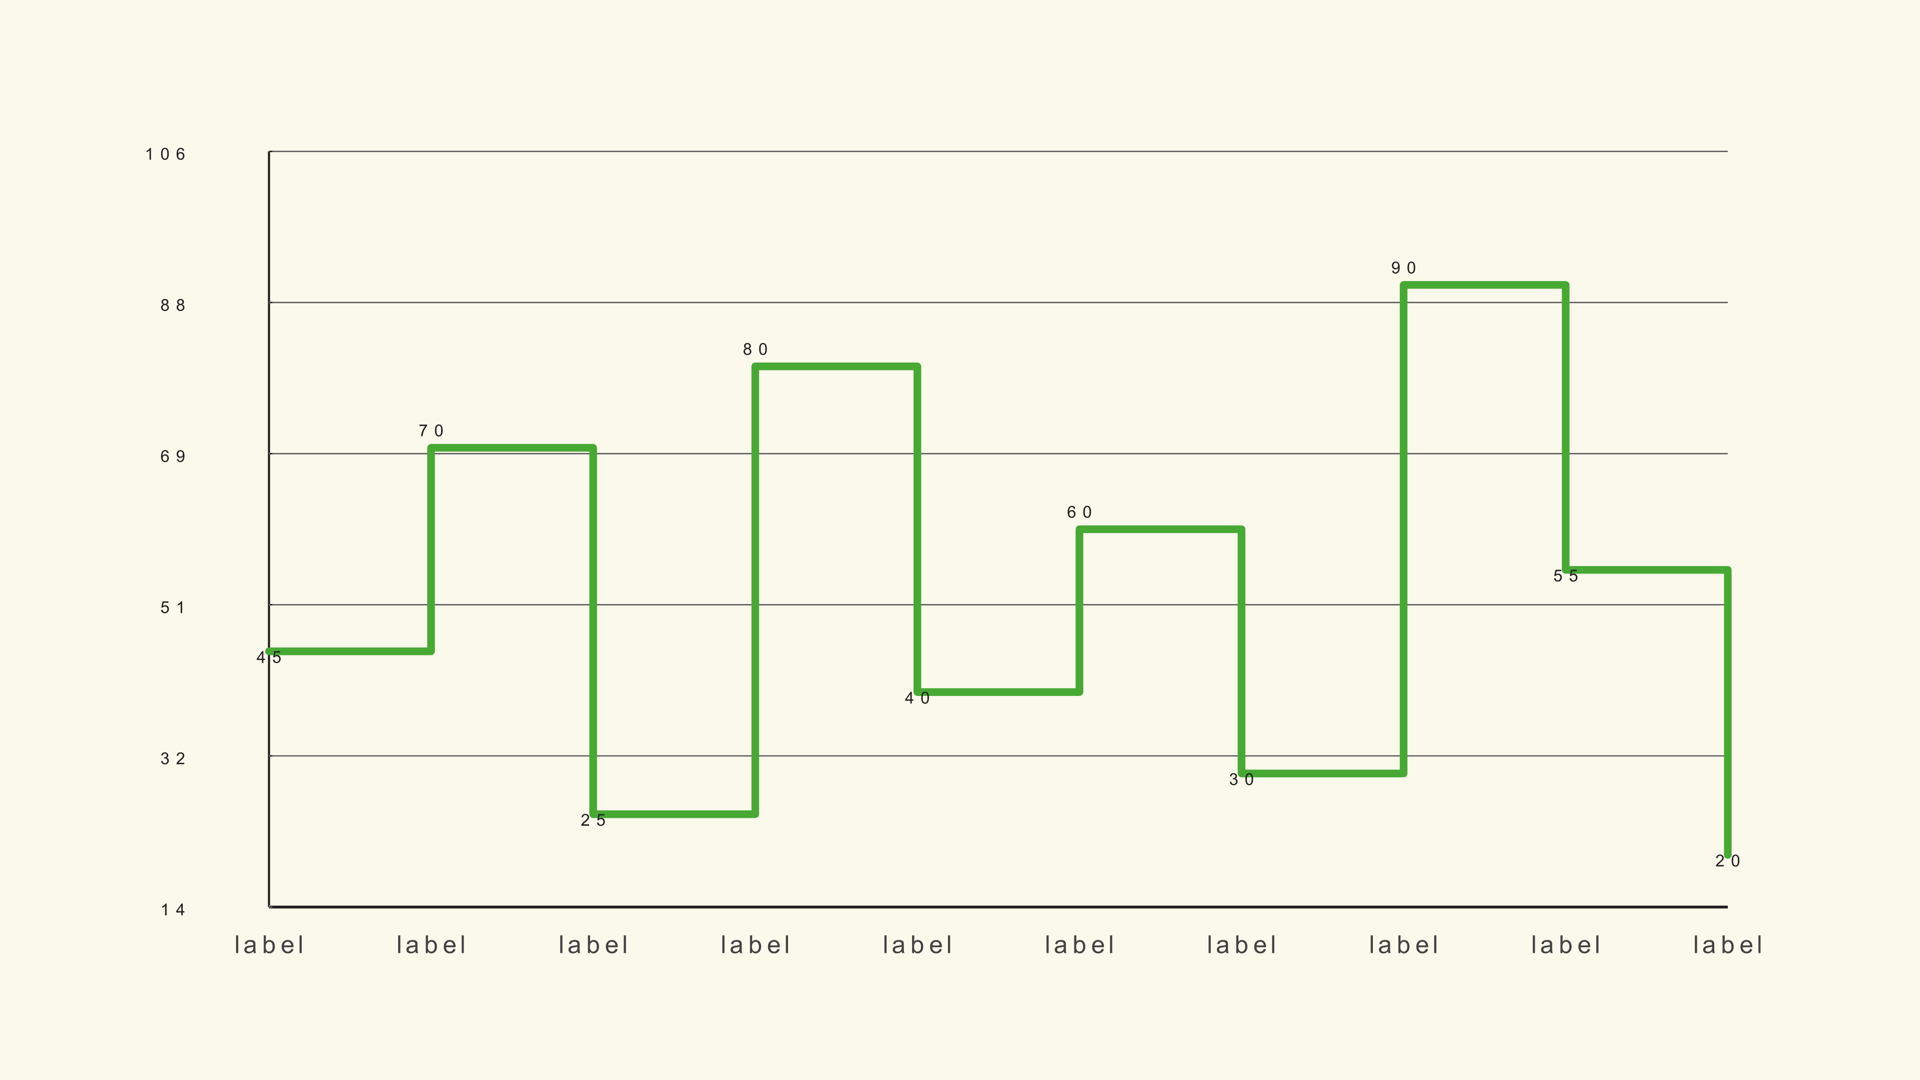
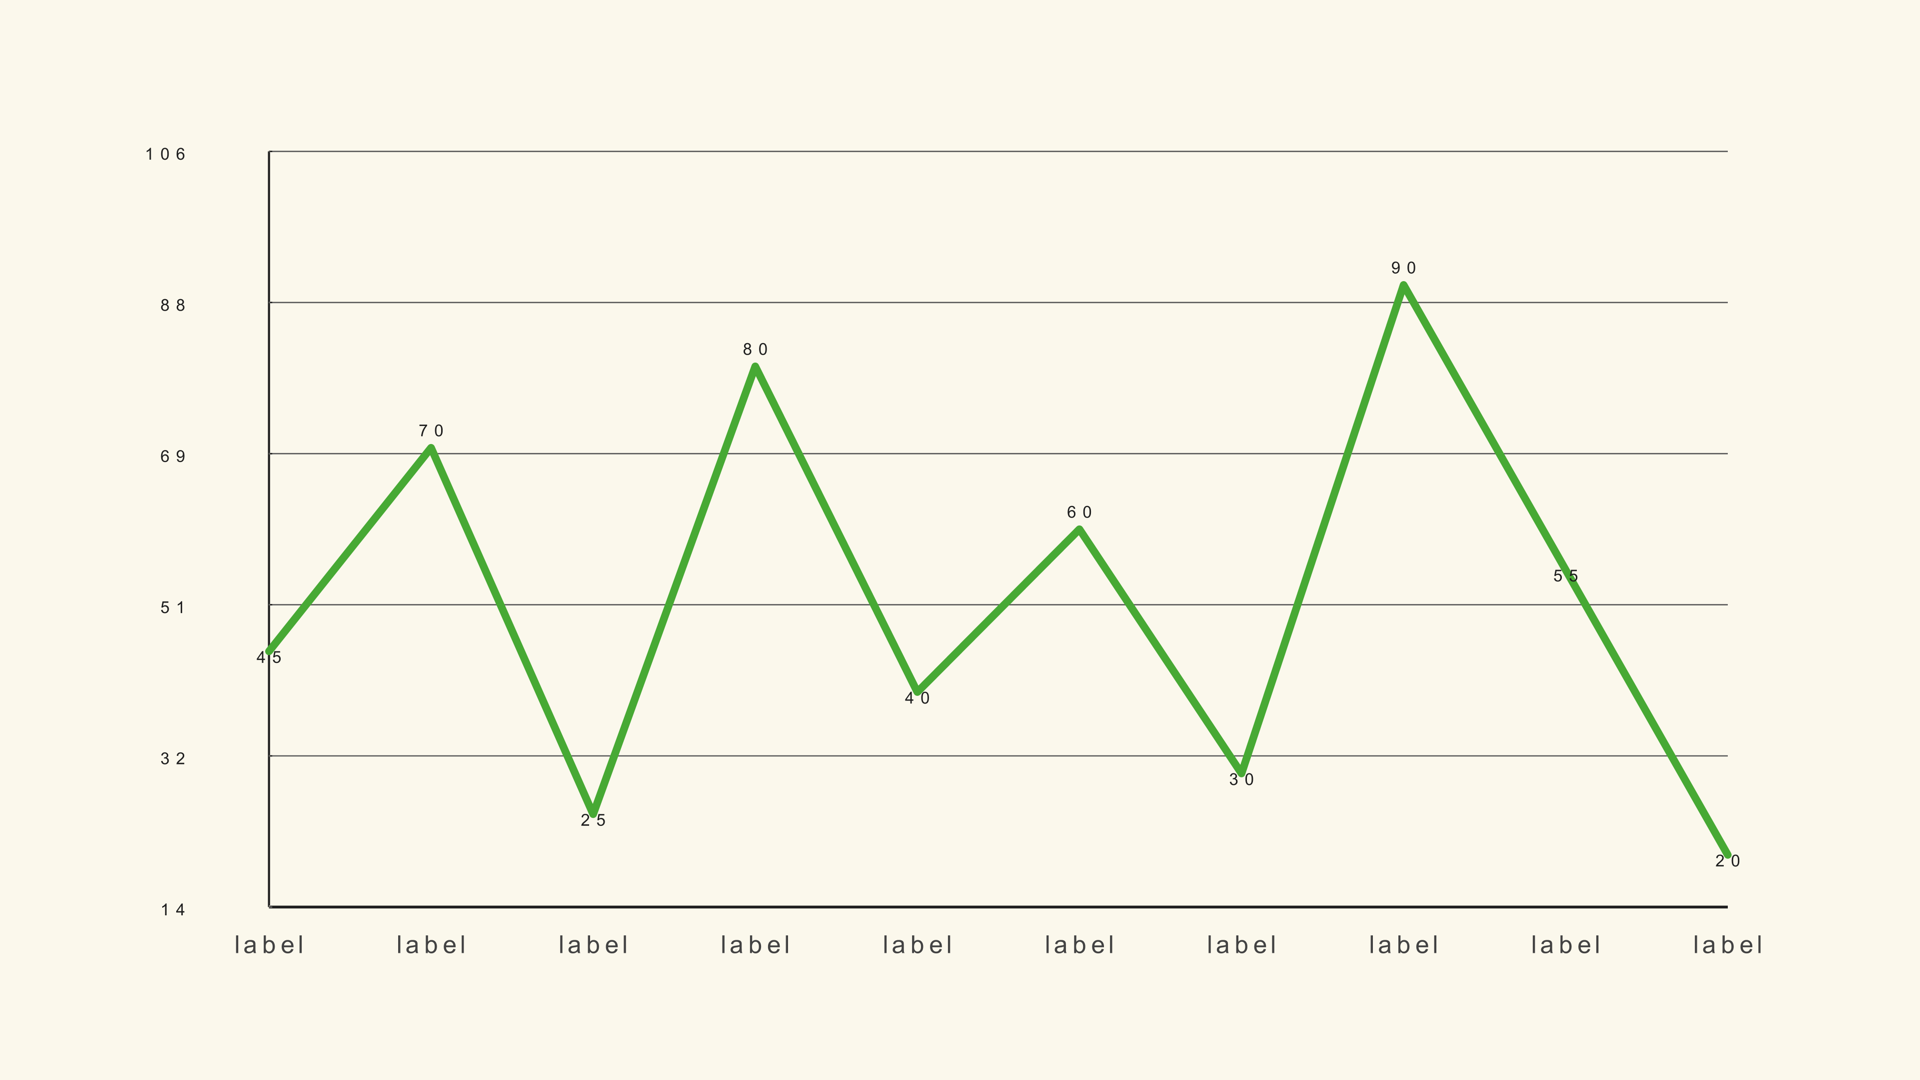
Line Basic: Animated Line Chart for DaVinci Resolve
Line Basic draws a single-series trend line from a simple label/value table. It is the fastest way to show direction, momentum or a change over time inside Resolve.
Updated November 2026By Noyris Charts TeamTested on DaVinci Resolve 18-21
72
controls
4
Inspector pages
100
points
100%
Resolve-native
Chart guide
The generator plots up to 300 points from the manual controls or up to 1,000 rows from a CSV, supports a draw-on reveal and can fit the plot to the actual data range. That makes it useful for values that live in a narrow band, where a zero-based axis would flatten the story.
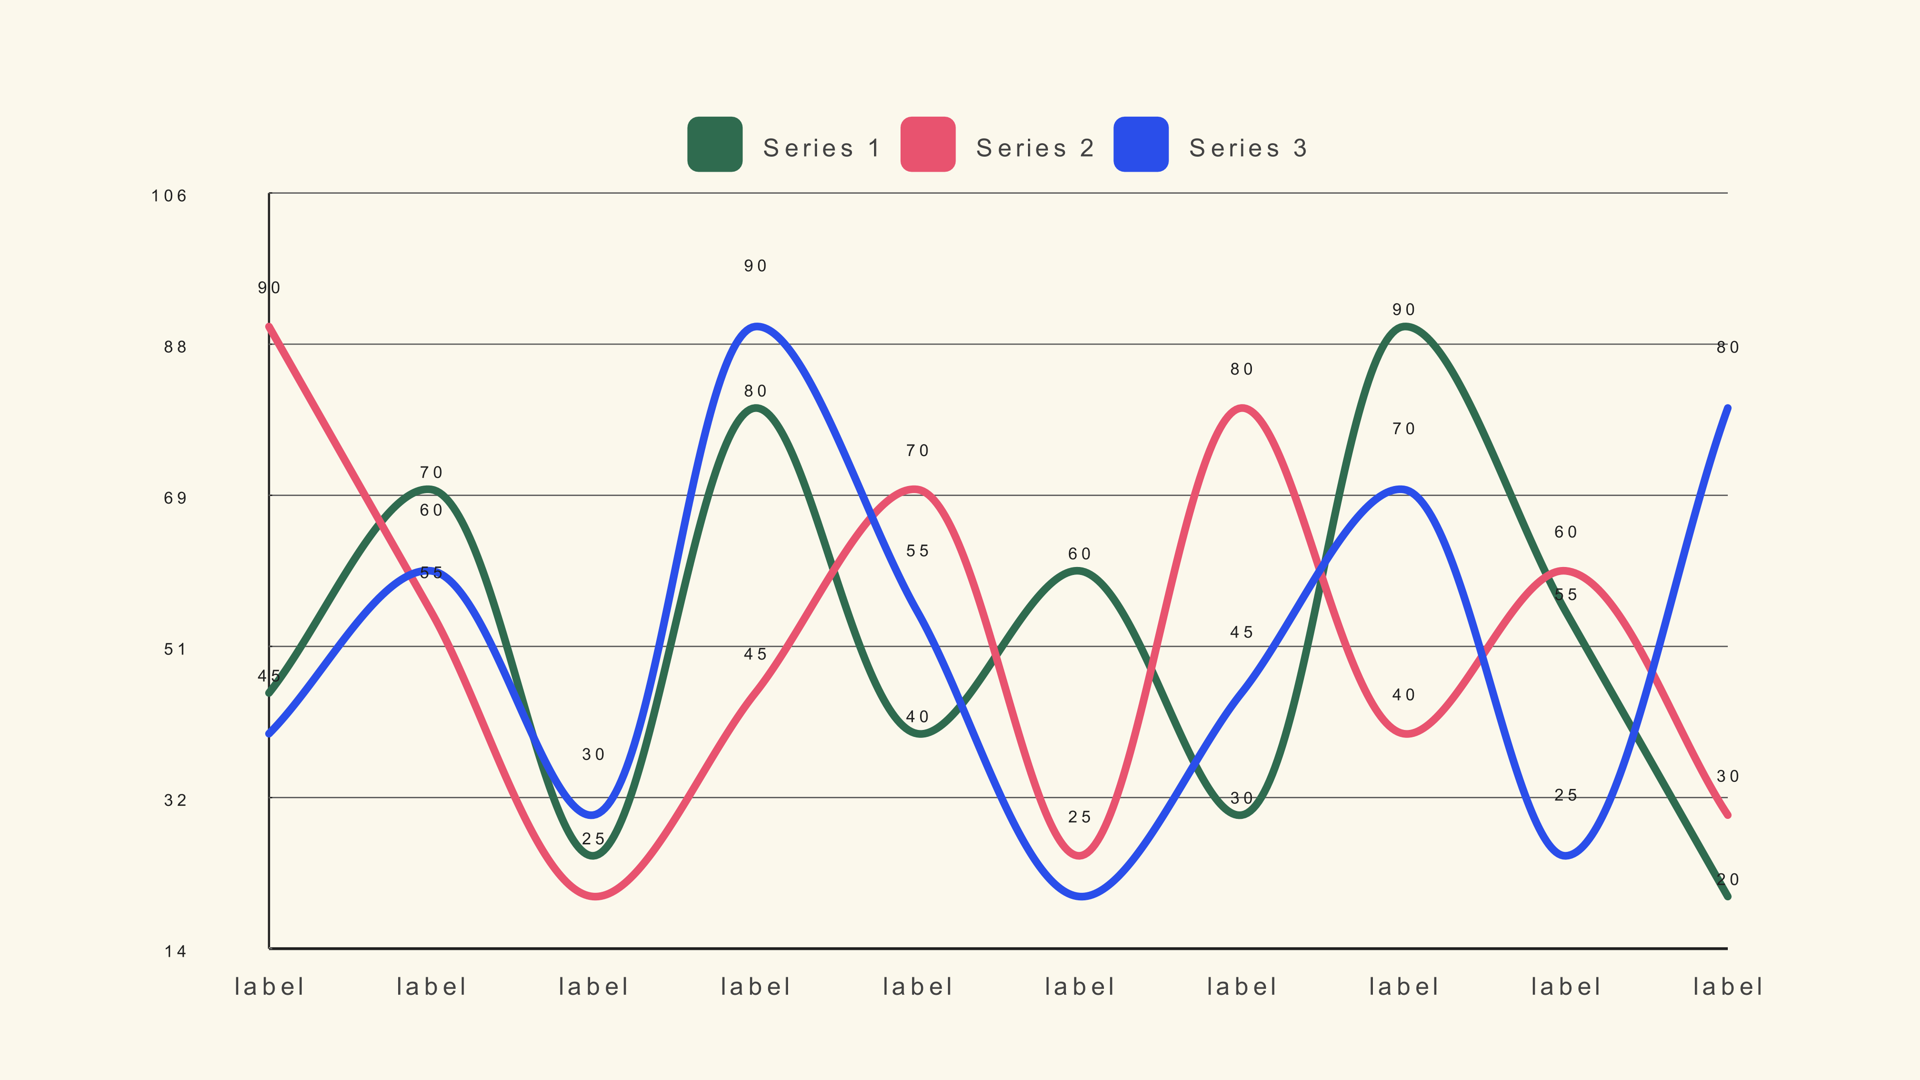
Line Basic handles one series. When you need to compare two or more trends, use Multi Line instead; when the area under the line matters, use an area chart.
When to use Line Basic
Trends over time
Plot monthly revenue, temperature, traffic or any continuous series. Keep the point count modest so the line stays smooth on screen.
Performance against a target
Use a fixed Chart Max and a clean grid to show whether a metric is climbing, flattening or falling.
Narrative transitions
Animate the line drawing from left to right to guide the viewer through the story instead of showing the finished chart immediately.
Data format and sample file
The CSV is a label/value table. Labels become the category text and values become the line height.
Sample CSV
line-basic.csv
| Column | Type | What it holds |
|---|---|---|
| label | text | Month, quarter or time-step label. |
| value | number | Point height on the chart scale. |
Load the file with CSV File, leave Header Row First off and set Points to the number of rows.
Synthetic sample data for layout testing - replace it with your own values before publishing.
Settings that make it look right
These are the controls worth setting first. Every value can be changed later on the chart's own Inspector pages below.
| Control | Start with | Why |
|---|---|---|
| Points | 12 | Matches the sample and keeps the line readable. |
| Fit to Data | On | Uses the real value range instead of flattening the trend. |
| Stroke Width | 0.004 | A clean line weight that survives compression. |
| Show Points | Off | Keeps the trend uncluttered unless exact steps matter. |
| Show Grid | On | Gives the eye a horizontal reference without stealing focus. |
| Duration | 1.2 s | Long enough for the draw-on to read as a trend. |
| Stagger (s) | 0.04 | Moves the reveal along the line instead of popping it in. |
Build it in DaVinci Resolve
1
Load the series
Drop the generator on the timeline, open Data and load the CSV. Set Points to match the number of rows before styling.
2
Choose the scale
Turn Fit to Data on for narrow ranges, or set Chart Max manually when several charts need the same scale.
3
Animate the draw
Open Animation, choose the line-draw style and set Start, Duration and Easing. Keep the label animation simple.
Look and feel
This is one of 41 native chart generators.
Get the full Noyris Charts pack for $59, one time.
Frequently asked questions
Can I plot more than one line?+
Line Basic is single-series. Use Multi Line for two or more series on the same axes.
What does Fit to Data do?+
It rescales the plot to the actual minimum and maximum values instead of starting the axis at zero.
How many points can I use?+
Line Basic supports up to 300 points from the manual controls and up to 1,000 rows from a CSV. For video, 8 to 20 points usually read best.
Can I animate the line drawing on?+
Yes. The Animation page includes line-specific reveal styles, timing and easing controls.
Related chart guides
Quick start
- 1Drag the generator from Effects → Generators → Noyris Charts onto your clip.
- 2Enter your values in the Data page (or load a CSV).
- 3Adjust Layout to size and space the chart.
- 4Pick a theme or manual colors in Style.
- 5Check Animate and hit play - the grow-in, stagger and easing are built in.
Inspector reference
All four Inspector pages shown exactly as they look in Resolve · the panel on the left explains every control
Data
Noyris Charts by noyris.com
Points
Points
Sets how many data points are plotted on the chart.
Data Source (CSV File)
Point to a CSV file below. Rows load as label,value (which CSV column is label vs value is set by the Label/Value Column controls). A line starting with # and a space is a comment (other #-labels are data); the Header Row First option skips the first row. First row is a header (column names) Pick which CSV column is the label and which is the value (0 = first column).
CSV File (optional)
Load a .csv to populate the chart in one click - rows are read as label,value (mapping set below).
Header Row First
Skip the first CSV row (treat it as column names).
Label Column (0=first)
Which column of the CSV file holds the element labels.
Value Column (0=first)
Which column of the CSV file holds the values.
Per-Point Details× 100 points
Visible
Shows or hides this data element (bar / slice / point / series) on the chart.
Value
The value for this element. The chart scales it against Chart Max to set the size it draws.
Label
The text shown on or next to this element (category name, slice label, axis name).
Layout
Noyris Charts by noyris.com
Geometry & Card
Chart Position
Moves the plot inside the frame, away from the centre.
Chart Size
How much of the frame the plot fills, from a small inset to edge to edge.
Chart Max
The value at the right-hand end of the scale. Raising it shrinks every element against a bigger ceiling; lowering it exaggerates them.
Fit to Data
Rescale the plot to the actual range of the values instead of starting the axis at zero.
Fit Padding
Slack added above and below the fitted range so the tallest and shortest values never touch the plot edge.
Stroke Width
How thick the outline around the series is.
Plot Left Margin
Space kept clear of the frame edge on the left, before the plot area starts.
Plot Right Margin
Space kept clear of the frame edge on the right, after the plot area ends.
Plot Top Margin
Space kept clear of the frame edge at the top, above the plot area.
Plot Bottom Margin
Space kept clear of the frame edge at the bottom, below the plot area.
Value Formatting
Prefix
Text prepended to every value label (e.g. '$').
Suffix
Text appended to every value label (e.g. 'pt').
Number Format
How numbers are written - plain, shortened (like 1.5k), or grouped with separators and decimals.
Options: Plain, Thousands, Compact (K/M/B)
Decimals
How many decimal places value labels show.
Grid & Axis
Show Grid
Draws horizontal grid lines behind the chart at tick positions.
Show Points
Draws a dot marker at each data point.
Show Y-Axis Tick Labels
Shows the numeric tick values along the Y axis.
Tick Label Size
Size of the numbers along the Y axis.
Y Tick Label Prefix
Text prepended to every Y-axis tick label (e.g. '$').
Y Tick Label Suffix
Text added after every number on the Y axis, for example a percent sign.
Show Y Axis
Draws the vertical axis spine. Turn off for a cleaner 'floating bar' look.
Show Baseline
Draws the zero line under the bars. Useful for diverging or negative data.
Labels & Title
Show Value Labels
Draws the numeric value label on each data element.
Value Label Size
Font size of the value labels.
Show Category Labels
Draws the category / element name next to each data element.
Category Label Size
Font size of the category labels.
Category Label Orientation
How the labels sit - flat, or turned upright. Upright helps when long names would overlap.
Options: Horizontal, Vertical
Value Label Gap
Distance between the data element and its value label.
Category Label Gap
Distance between the data element and its category label.
Font
Font used for all chart text.
Style
Font style variant (Regular / Bold / Italic).
Letter Spacing
Tracking (letter-spacing) for chart labels.
Style
Noyris Charts by noyris.com
Apply Theme
Turns theming on or off. When on, every chart color comes from the selected theme; when off, the manual color controls are used.
Theme
Theme
Choose one of the built-in color themes. Each theme has a matching palette of colors.
Background
Show Background
Fills the whole frame with the theme/mood background color. Turn off for full transparency over your footage.
Background Color Mode
Which theme color fills the background (usually the sheet or tint color).
Options: Theme, Manual
Background Color
Which theme color fills the background (usually the sheet or tint color).
Grid
Grid Color Mode
Color of grid lines (theme or manual).
Options: Theme, Manual
Grid Color
Color of grid lines (theme or manual).
Axis
Axis/Baseline Color Mode
Color of the axis spine and zero baseline.
Options: Theme, Manual
Axis Color
Sets the axis color.
Value Label
Value Label Color Mode
Color of the value labels.
Options: Theme, Manual
Value Label Color
Color of the value labels.
Y-Axis Tick Label
Y-Axis Tick Color Mode
Color of the Y-axis tick labels.
Options: Theme, Manual
Tick Label Color
Sets the tick label color.
Category Label
Category Label Color Mode
Color of the category labels.
Options: Theme, Manual
Category Label Color
Color of the category labels.
Animation
Noyris Charts by noyris.com
Animate
Turns the intro animation on or off. When off, the chart appears fully drawn right away.
Animation Style
How the chart appears - grow up from the baseline, or slide in from the side.
Options: Draw, Grow, Fade, Bounce, Elastic, Pop, Reverse
Stagger Order
The order the elements appear in - left to right, from the middle outwards, or shuffled.
Options: Forward, Reverse, Center Out, Random
Start
Frame/time (seconds) at which the animation begins.
Duration
Total animation length in seconds (the whole reveal).
Stagger (s)
Wait between each element's animation start. A bigger wait makes a more drawn-out wave.
Easing
The feel of the motion - soft in and out, or a snappy ease-out.
Options: Linear, Ease In, Ease In Out, Ease Out, Smooth, Back, Elastic, Bounce, Spring
Exaggeration
How far the animation pushes past its final position - none, or a strong bounce.
Settle
How long the overshoot takes to settle into final position (seconds).
Label Animation
How the labels appear - fade in, or pop in with the element.
Options: None, Fade, Pop
Clip Labels to Reveal
Labels mask in with their element instead of appearing all at once.
Easing Curve
Use a ready-made easing curve, or shape your own curve with the handles below.
Options: None, Snappy, Soft, Liquid
Custom Progress Curve
Switch on the custom handles when you need a specific, non-standard curve.
Options: Disabled, Custom
Handle 1 X
Moves the first curve handle sideways to change the timing of the animation.
Handle 1 Y
Moves the first curve handle up or down to change how much progress happens at that point.
Handle 2 X
Moves the second curve handle sideways to change the timing of the animation.
Handle 2 Y
Moves the second curve handle up or down to change how much progress happens at that point.
All 41 charts
Bar
Treemap
Candle
Pyramid
Sankey
Waterfall
Parliament