On this page
All 41 charts
Click a chart to open its page
Bar9
Treemap1
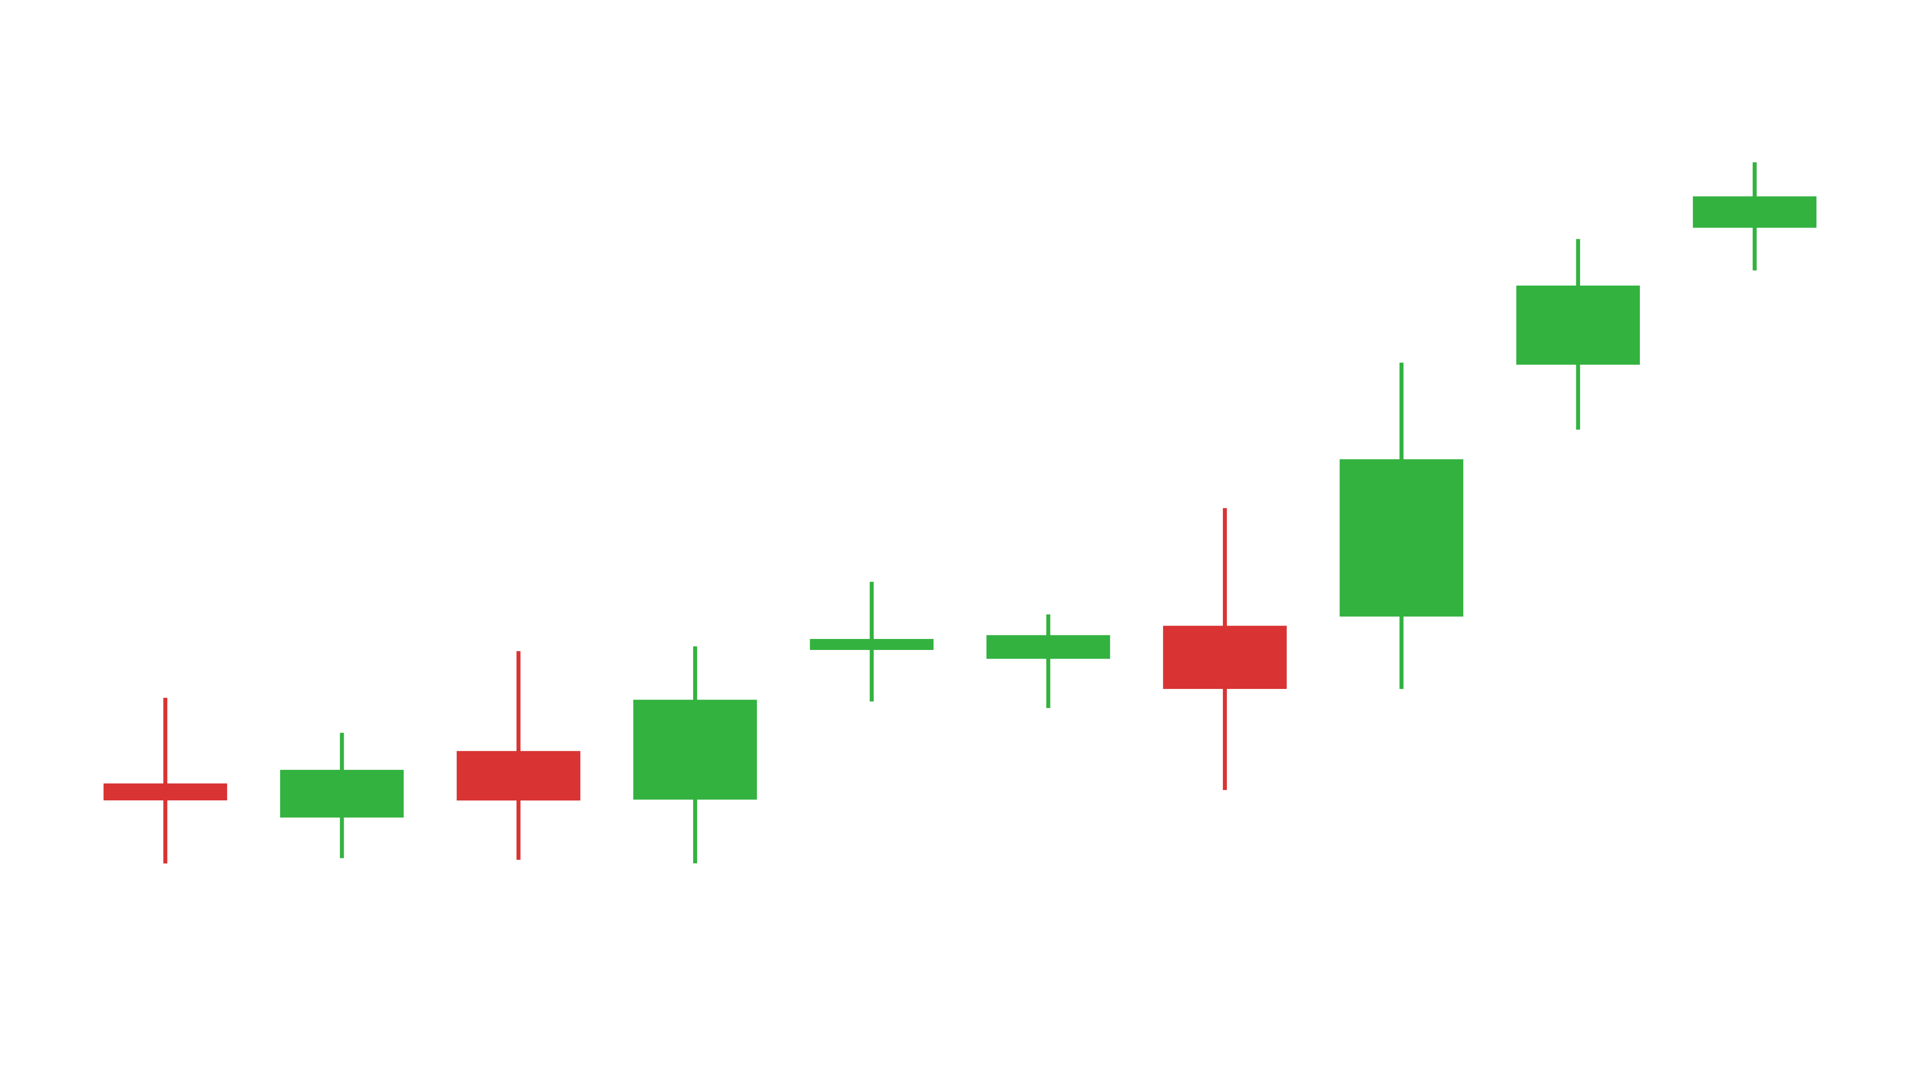
Candle2
Pyramid1
Sankey1
Waterfall1
Parliament1
Candle family
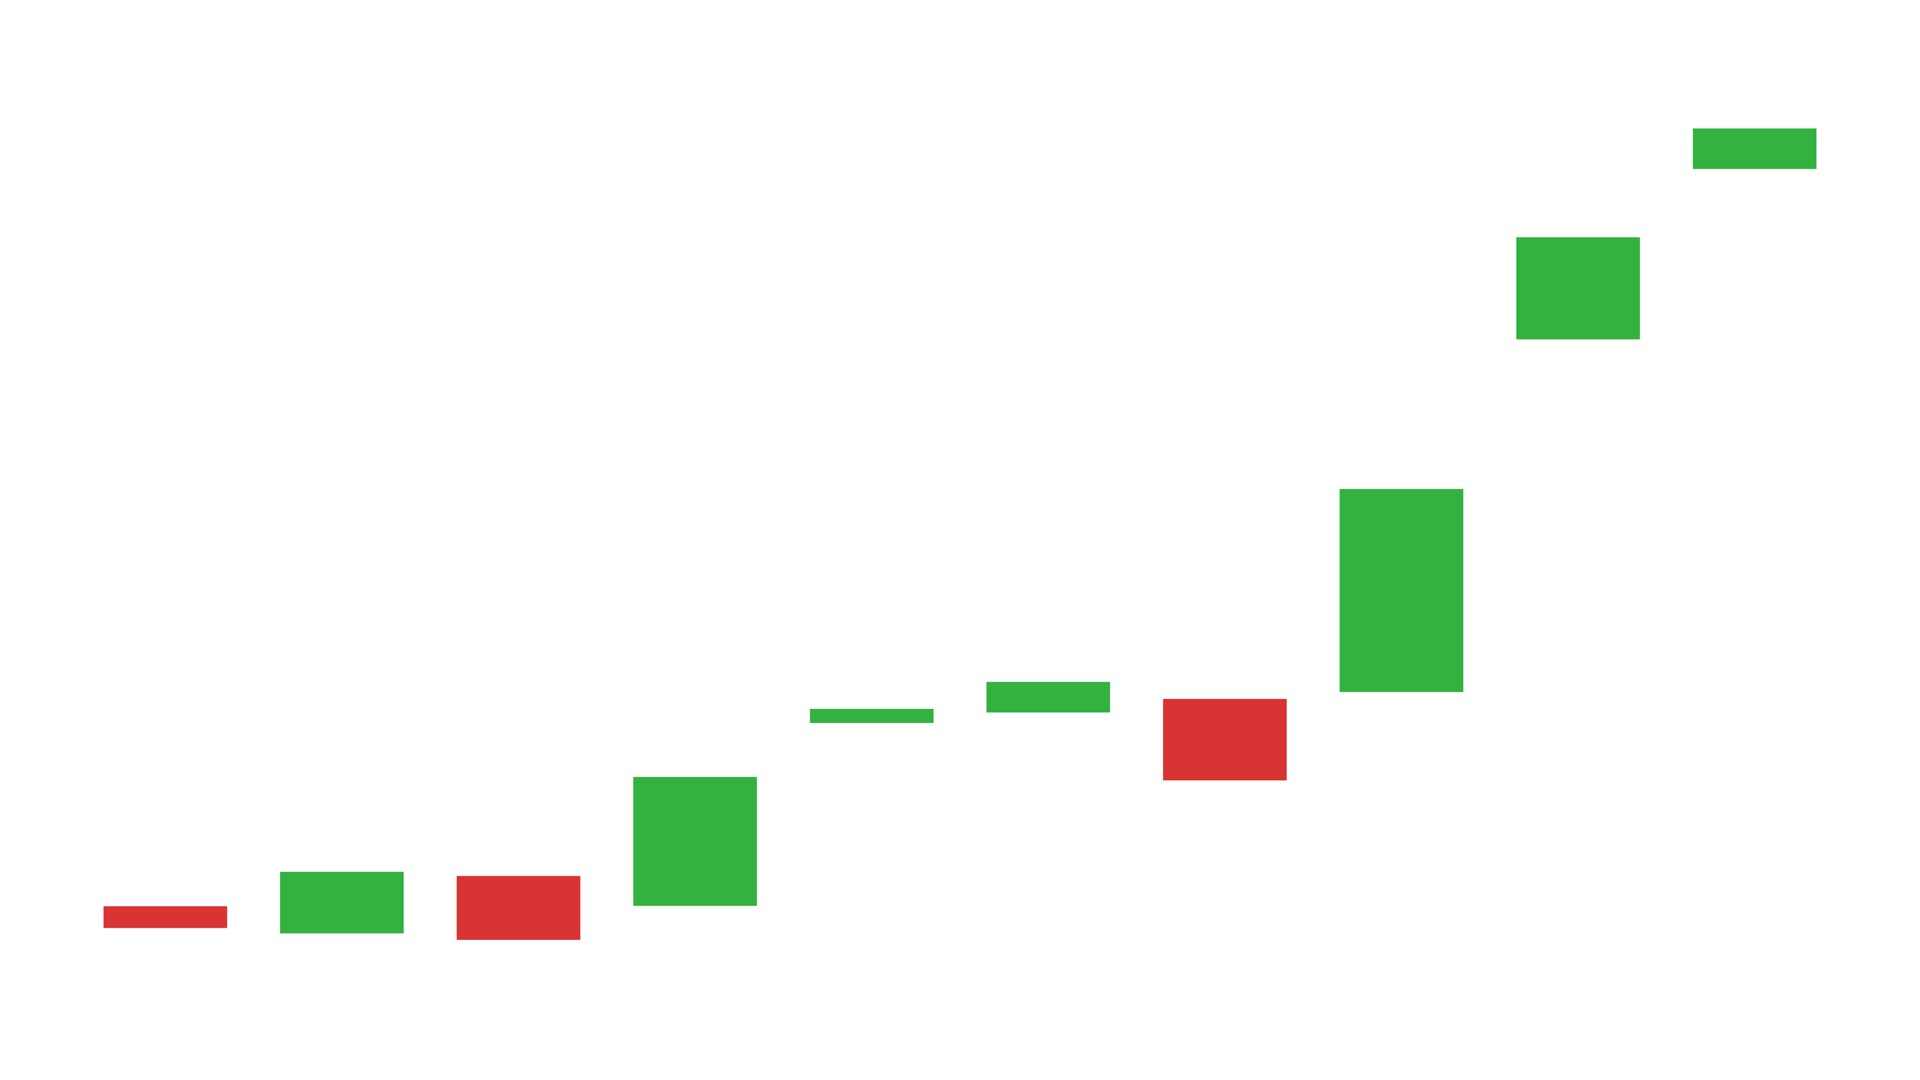
Candle Body: Candlestick Chart for DaVinci Resolve
Candle Body draws the open-to-close body of a candlestick chart. It is the clean, documentary version: no grid, no axes, just the price action.
Updated November 2026By Noyris Charts TeamTested on DaVinci Resolve 18-21
31
controls
4
Inspector pages
100
candles
100%
Resolve-native
Chart guide
Each CSV row becomes one candle, with the open and close values setting the body. A close at or above the open draws a bull candle; a close below the open draws a bear candle. The X position is the row number, so the chart reads like a market sequence.
Use Candle Body when the body direction is enough. When the high and low wicks are part of the story, use Candle Wick instead.
When to use Candle Body
Stock and crypto explainers
Show a run of daily or weekly candles behind a voiceover. Keep the chart clean and let the color change carry the market mood.
Finance documentary sequences
Use the body-only look for a restrained graphic that sits over archival footage without adding gridlines or axis clutter.
Before-and-after market moments
Frame a window of candles around an event and animate the reveal so the audience follows the sequence in time.
Data format and sample file
The CSV uses two numeric columns: open and close. Each row is one candle and the X position is the row number.
Sample CSV
candle-body.csv
| Column | Type | What it holds |
|---|---|---|
| open | number | Opening price for the candle. |
| close | number | Closing price for the candle. |
The fuse defaults to Open Column 0 and Close Column 1, which matches this file.
Synthetic sample data for layout testing - replace it with your own values before publishing.
Settings that make it look right
These are the controls worth setting first. Every value can be changed later on the chart's own Inspector pages below.
| Control | Start with | Why |
|---|---|---|
| Points | 20 | Matches the sample and gives the sequence room to breathe. |
| Candle Width | 0.7 | A solid body with clear space between candles. |
| Candle Height | 0.5 | Keeps the bodies readable without filling the frame. |
| Candle Gap (0 = no gaps) | 0 | Keeps a continuous market sequence. |
| Fit to Data | On | Uses the actual price range instead of a flat zero-based axis. |
| X Axis Min | 1 | Starts on the first candle. |
| Duration | 1.2 s | Gives the reveal enough time to read as a sequence. |
Build it in DaVinci Resolve
1
Load the open/close table
Point CSV File at the two-column file. Leave Header Row First off and confirm that Open Column is 0 and Close Column is 1.
2
Set the price window
Turn Fit to Data on, then use Y Axis Min/Max and X Axis Min/Max to frame the exact candles you want on screen.
3
Animate the reveal
Set Duration and the animation style. Keep the last frame still long enough for the viewer to read the pattern.
Look and feel
This is one of 41 native chart generators.
Get the full Noyris Charts pack for $59, one time.
Frequently asked questions
Do I need high and low values?+
No. Candle Body only uses open and close. Use Candle Wick when the high and low wicks are part of the story.
How many candles can I load?+
The CSV import supports up to 500 candles, while the manual sliders cover the first 100.
How are bull and bear colors decided?+
A close at or above the open draws a bull candle. A close below the open draws a bear candle.
Is there a grid or axis?+
No. Candle Body is intentionally clean: no grid, no axes and no value labels.
Related chart guides
Quick start
- 1Drag the generator from Effects → Generators → Noyris Charts onto your clip.
- 2Enter your values in the Data page (or load a CSV).
- 3Adjust Layout to size and space the chart.
- 4Pick a theme or manual colors in Style.
- 5Check Animate and hit play - the grow-in, stagger and easing are built in.
Inspector reference
All four Inspector pages shown exactly as they look in Resolve · the panel on the left explains every control
Data
Noyris Charts by noyris.com
Points
Points
How many elements the chart draws. More elements stretch the plot wider; fewer give each one more room.
Data Source (CSV File)
Point to a CSV file below. Each data row is one candle; pick which CSV column is the Open and which is the Close (0 = first column). A line starting with # and a space is a comment (other #-labels are data); the Header Row First option skips the first row. CSV candles are drawn for every row (up to 500); manual sliders cover the first 100. First row is a header (column names) Pick which CSV columns hold the candle Open and Close (0 = first column).
CSV File (optional)
Load a .csv to populate the chart in one click - rows are read as label,value pairs. Leave it empty to drive everything from the manual controls below.
Header Row First
Skip the first CSV row (treat it as column names).
Open Column (0=first)
Which column of the CSV file holds each candle's opening value.
Close Column (0=first)
Which column of the CSV file holds each candle's closing value.
Per-Candle Details (1-100)× 100 candles
Open
The opening value this candle is drawn from, on the same scale as the Y axis.
Close
The closing value this candle is drawn to, on the same scale as the Y axis. Close above Open draws an up candle, below draws a down candle.
Layout
Noyris Charts by noyris.com
Geometry & Card
Chart Position
Moves the plot inside the frame, away from the centre.
Chart Size
How much of the frame the plot fills, from a small inset to edge to edge.
Candle Width
How wide each candle body is. Smaller values space the candles out.
Candle Height
How tall the candle bodies are inside the plot.
Candle Gap (0 = no gaps)
Space between the candles. Turn it down to pack them tight.
Axis & Plot Area
Fit to Data
Rescale the plot to the actual range of the values instead of starting the axis at zero.
Y Axis Min
Lowest value the vertical scale is pinned to. Raising it clips the bottom of the plot; leave it low enough to fit the smallest candle.
Y Axis Max
Highest value the vertical scale is pinned to. Lowering it makes the candles fill more of the plot.
Fit Padding
Slack added above and below the fitted range so the tallest and shortest values never touch the plot edge.
Plot Left Margin
Space kept clear of the frame edge on the left, before the plot area starts.
Plot Right Margin
Space kept clear of the frame edge on the right, after the plot area ends.
Plot Top Margin
Space kept clear of the frame edge at the top, above the plot area.
Plot Bottom Margin
Space kept clear of the frame edge at the bottom, below the plot area.
X Axis Range (Candles)
X Axis Min
First candle (index) shown on the left of the plot. Use it to skip a run of empty slots.
X Axis Max (0 = all)
The last candle shown on the right of the plot. Leave it off to show every candle.
Style
Noyris Charts by noyris.com
Candle Colors
Bear Color
Color used for down candles - those whose Close sits below their Open.
Background
Background Color
Color of the backing card.
Animation
Noyris Charts by noyris.com
Animate
Master switch for the entrance animation. Turn it off to render the finished chart immediately.
Animation Style
How the chart enters - drawn on, grown from the baseline, or faded up.
Options: Grow, Slide, Fade, Rise, Pop, Sweep
Stagger Order
The order elements come in: left to right, right to left, or smallest value first.
Options: Forward, Reverse, Center Out, Random
Start
When the animation begins, in seconds from the start of the comp.
Duration
How long the whole entrance takes, in seconds.
Stagger (s)
Wait added between each element's start, so they appear one after another.
Easing
How the entrance speeds up and slows down - steady, eased, or springy.
Options: Linear, Ease In, Ease In Out, Ease Out, Smooth, Back, Elastic, Bounce, Spring
All 41 charts
Bar
Treemap
Candle
Pyramid
Sankey
Waterfall
Parliament