You can make a chart in DaVinci Resolve without leaving the edit. The fastest route is a native Fusion generator: drag it onto the timeline, load a CSV or type values into the Inspector, then style and animate the result like any other clip. The chart renders through the Deliver page at your timeline resolution, so there is no export-and-reimport step.
This guide is the map for the rest of the chart tutorials on this site. It covers the decision that matters before you touch a control - which chart answers the question - then the workflow that keeps data, scale, design and motion from fighting each other.
What you can build in Resolve
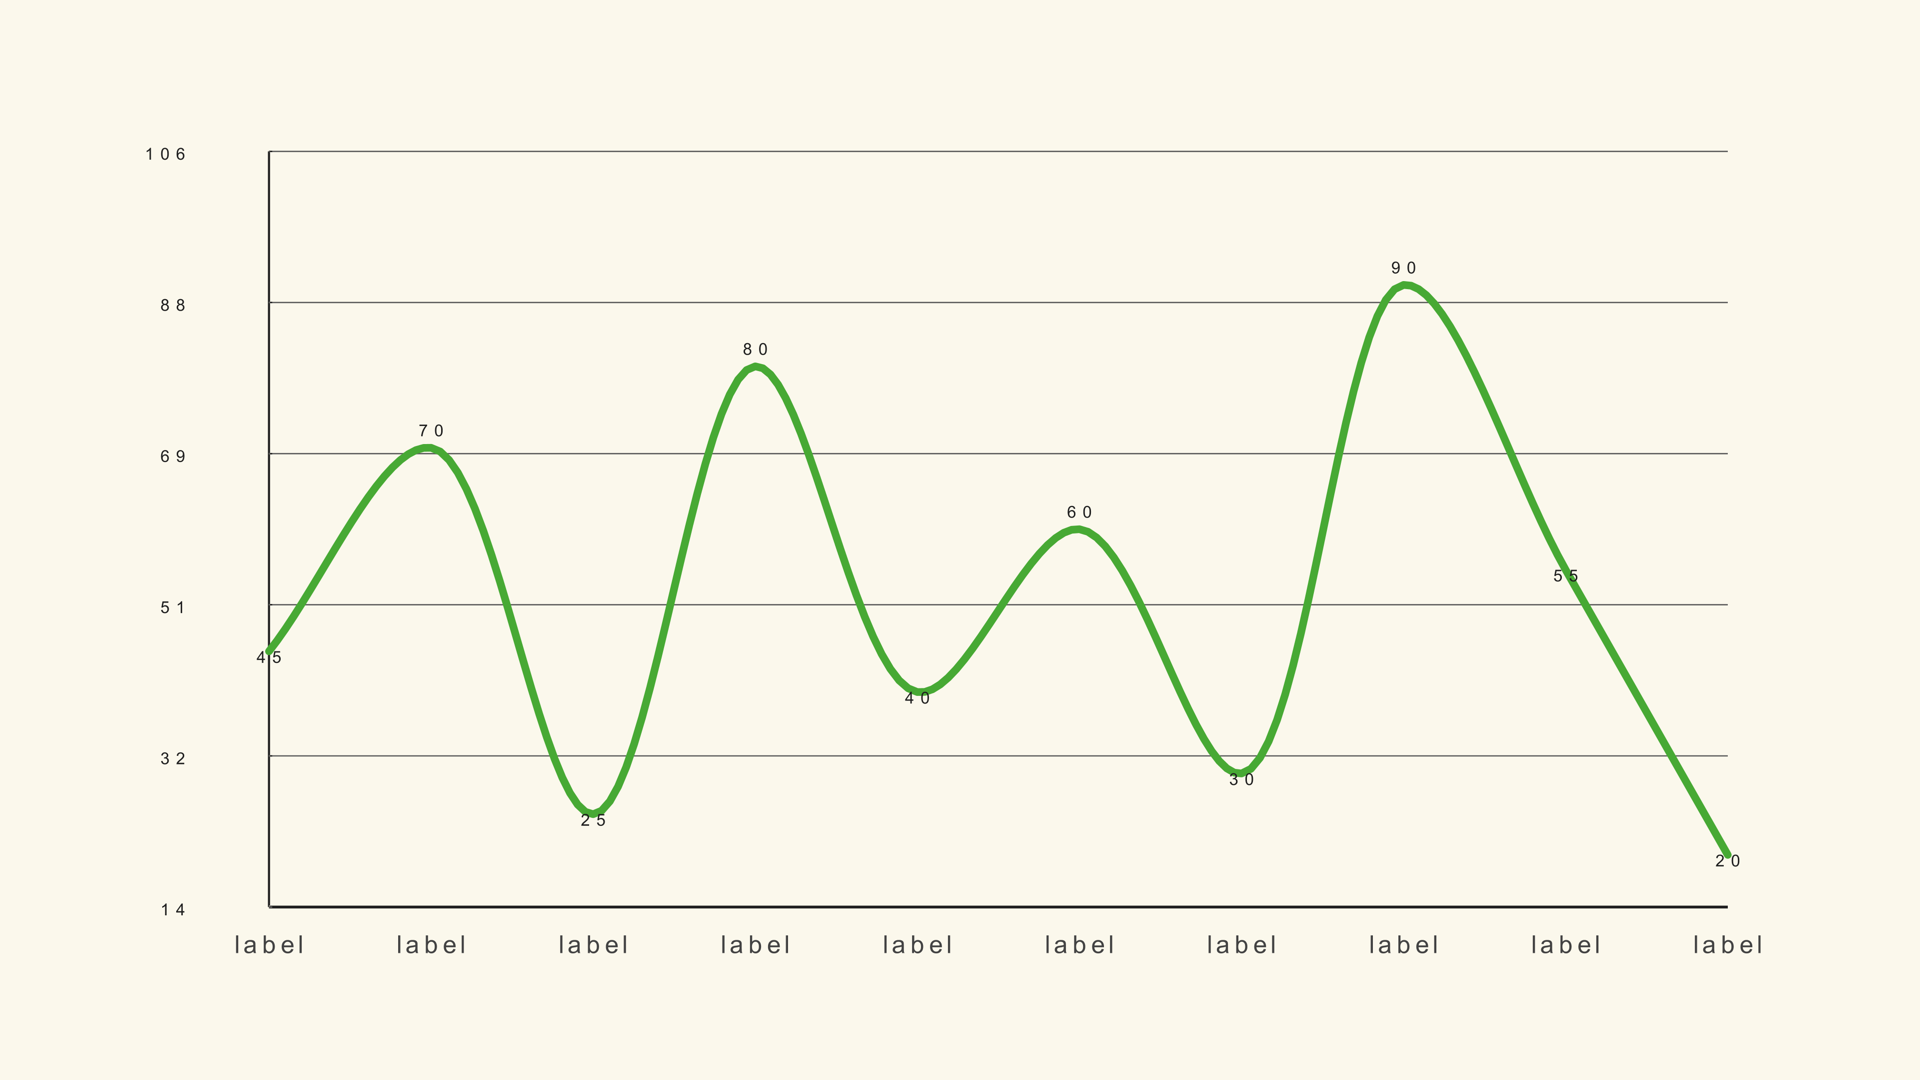
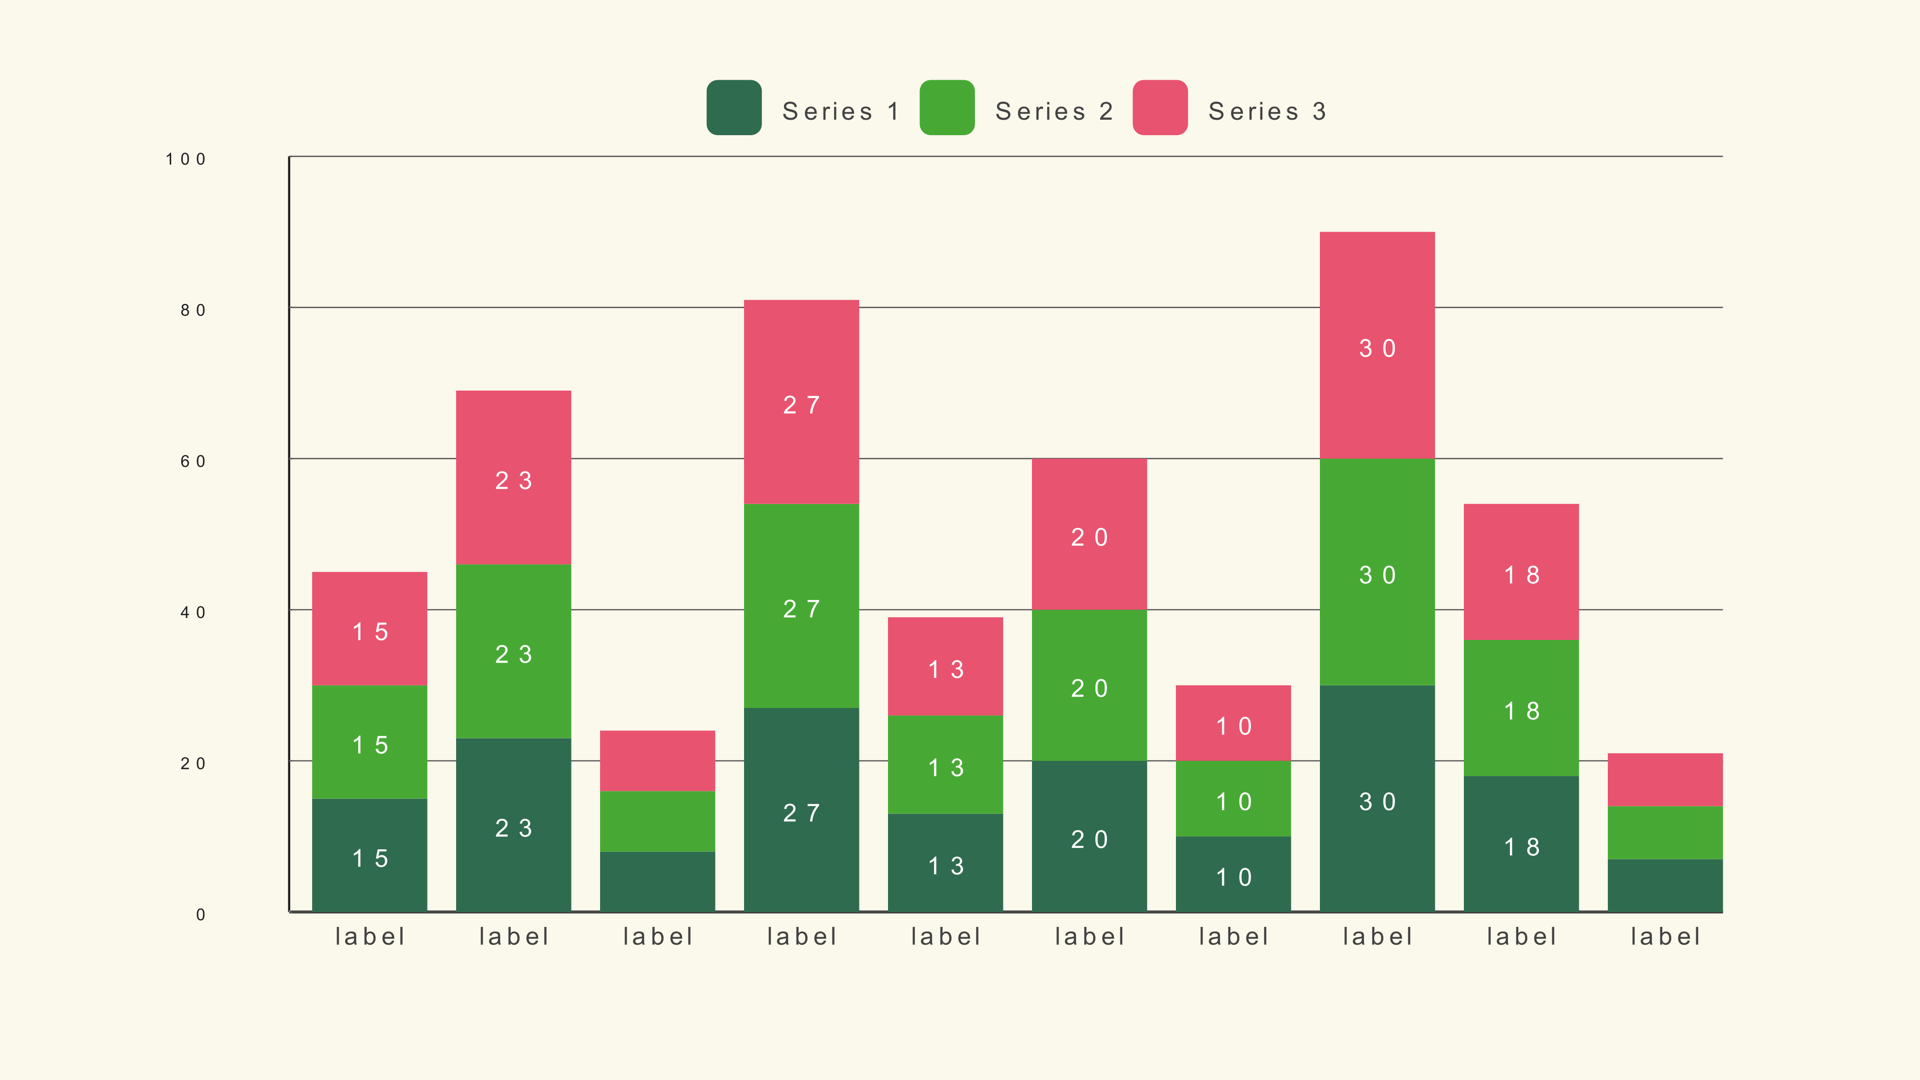
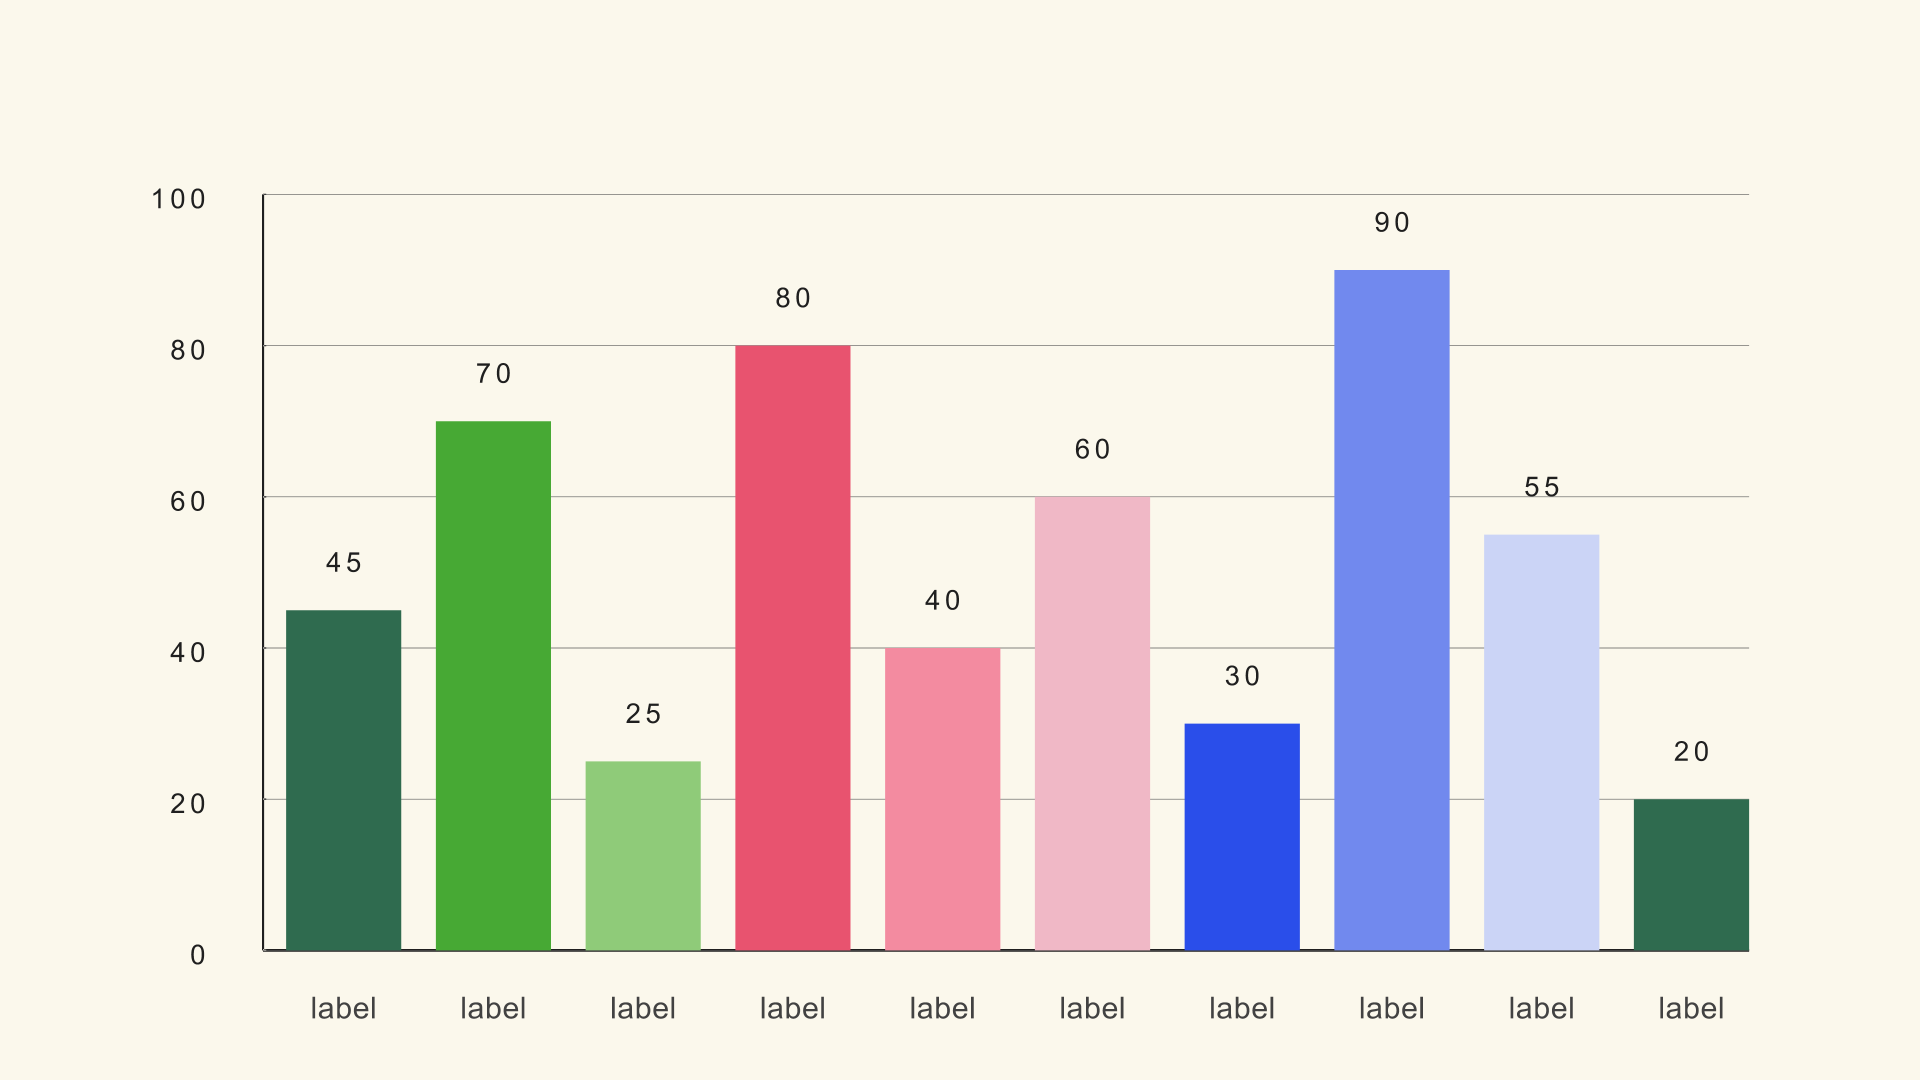
Noyris Charts adds 41 native Fusion generators across bars, lines, areas, pies, radars, bubbles, financial candles, funnels, treemaps, flows and gauges. They live under Effects - Generators - Noyris Charts after installation. They are not rendered videos, image sequences or After Effects comps, so the data and the Inspector controls remain available until you render.
That native approach changes the workflow in three useful ways. First, the chart follows the timeline frame rate and resolution. Second, you can trim, retime and stack it like any other clip. Third, a producer or editor can reopen the project months later and change a number without rebuilding the graphic.
Choose the chart from the question
Most bad charts are not badly designed. They answer a different question than the one the script asks. Start with the sentence you want the viewer to understand, then pick the chart that makes that sentence obvious.
| Question | Chart to start with |
|---|---|
| Which category is biggest? | Bar Basic or a horizontal bar chart |
| How has a value changed over time? | Line Basic or an area chart |
| How does a total split into parts? | Pie, donut, stacked bar or treemap |
| How did we get from one total to another? | Waterfall |
| How does a ranking change over time? | Bar Race |
| Where does volume flow between stages? | Sankey |
| How do many subjects compare on two measures? | Scatter plot or bubble chart |
| How close is one metric to a target? | Ring gauge or donut |
If two chart types both seem plausible, choose the one that makes the comparison easier to read at a glance. A bar chart almost always beats a pie when the values are close, and a line chart almost always beats a bar chart when the story is continuous change.
The four-step workflow
- Data. Put one label and one or more numeric values in each row. Clean the file before import.
- Scale. Set Chart Max, Fit to Data or the axis limits so the geometry tells the truth.
- Style. Pick a theme, then adjust only the elements that need to match the edit.
- Animation. Add motion after the values and layout are locked, not before.
This order matters because every later step depends on the one before it. If you animate first and then change the number of bars, the timing breaks. If you style first and then discover the scale is wrong, the composition changes underneath the design.
Get data into Resolve
Small charts can be typed directly into the Data page. For anything with more than a handful of categories, export a CSV. Most Noyris generators expect a label column followed by one or more numeric columns. Bar Race is the exception: it uses a wide table with one column per time step.
Keep the CSV plain. Use periods for decimals, remove currency symbols and thousands separators, delete blank rows, and decide whether the first row is a header. Column numbers in the Inspector are zero-based, so the first column is 0. The full column-by-column reference lives in How to Import CSV Data into DaVinci Resolve Charts.
Set the scale honestly
Scale is the part viewers notice only when it is wrong. A bar chart that starts at a nonzero baseline exaggerates small differences. A line chart forced to zero can flatten a meaningful trend into a straight line. Chart Max, Fit to Data and the axis limits are not cosmetic controls; they decide what the geometry claims.
Use a fixed scale across a sequence of charts when the audience is comparing them. If the scale changes between shots, a small rise can look larger than a large rise in the previous chart. When the values live in a narrow band and the baseline is not part of the story, say so in the title or caption and use a line chart with a clearly labeled range.
Style for video, not for print
Video charts have less time and less visual acuity than a report on a desk. Reduce the category count, increase the label size and keep the contrast high. A chart that looks elegant in a still can turn to mud after compression or on a phone screen.
Start with a theme, then override only what the brand requires. Keep the background card on when the chart sits over busy footage; turn it off when you need a transparent overlay. Use one accent color to direct attention and let the rest of the palette recede. The broader design rules are covered in How to Design Charts for Video.
Animate the reveal
Animation should explain the reading order. A left-to-right bar reveal, a line draw-on or a pie sweep tells the viewer where to look first. The controls are shared across most charts: Animate, Animation Style, Start, Duration, Stagger, Easing, Exaggeration, Settle and label animation.
A useful starting point is a one-second reveal with a small stagger. If the chart has many elements, extend the duration before increasing the stagger. Too much stagger makes the last bar arrive after the voiceover has moved on. The detailed timing workflow is in How to Animate a Chart in DaVinci Resolve.
Export and reuse
There is no special chart export. Put the generator on the timeline, set the timeline resolution, and render from the Deliver page with the same settings you use for the rest of the edit. If the chart is an overlay, choose a codec that preserves alpha. If it is a finished graphic, H.264 or ProRes is enough.
For a recurring series, save a template project with the chart already styled and animated. Duplicate the generator, point it at the new CSV and check the scale. That is faster and more consistent than rebuilding the look each week.
Common mistakes
- Too many categories. Group small rows into "Other" or switch to a chart that handles a long list.
- Labels that cannot be read at output size. Test on a phone-sized preview, not only on a desktop monitor.
- An accidental scale change. Lock Chart Max across a sequence when the charts are meant to be compared.
- Decoration before data. A beautiful chart with the wrong baseline is still wrong.
- Motion with no reading order. If every element moves at once, the viewer has nowhere to look.
Next steps
Start with the Bar Basic guide if you need a comparison, or the Line Basic guide if the story is a trend. Then read the CSV guide before you load your own spreadsheet. The chart reference lists every generator, its data shape and its sample file.