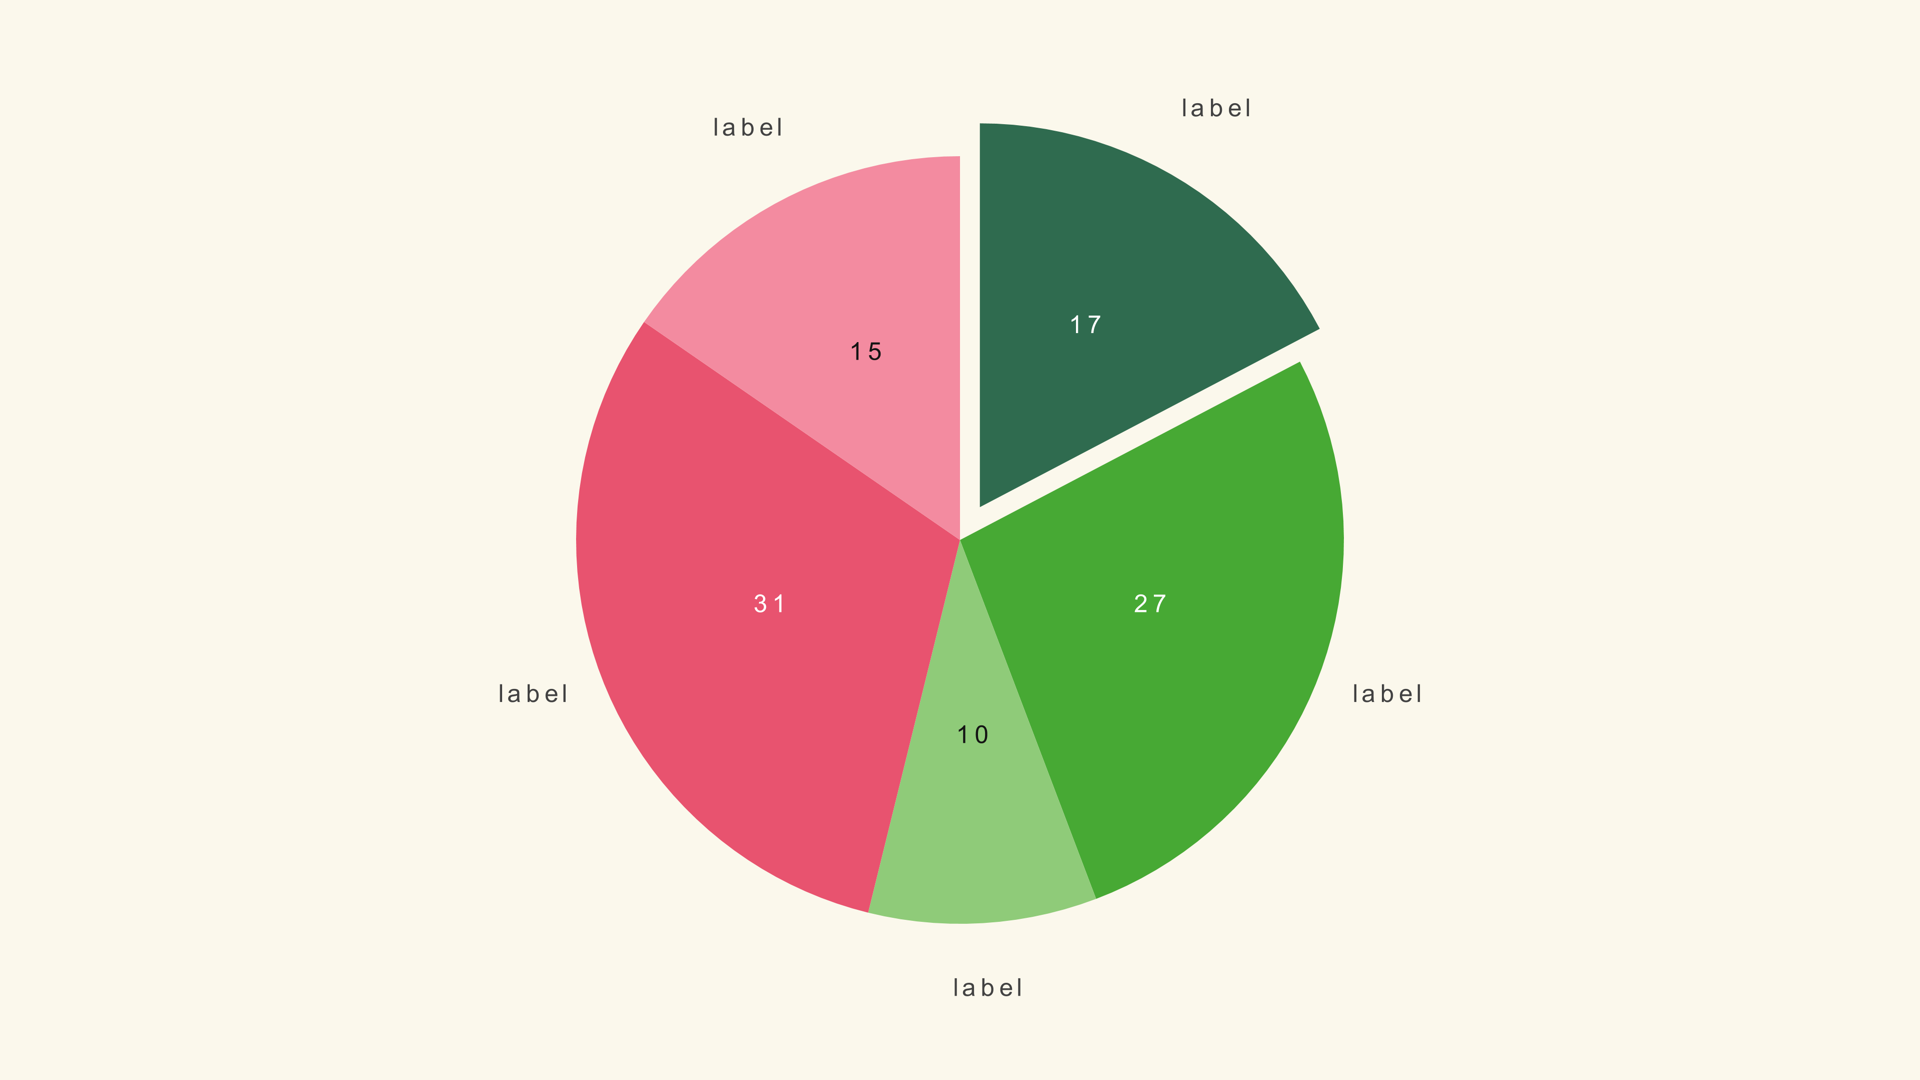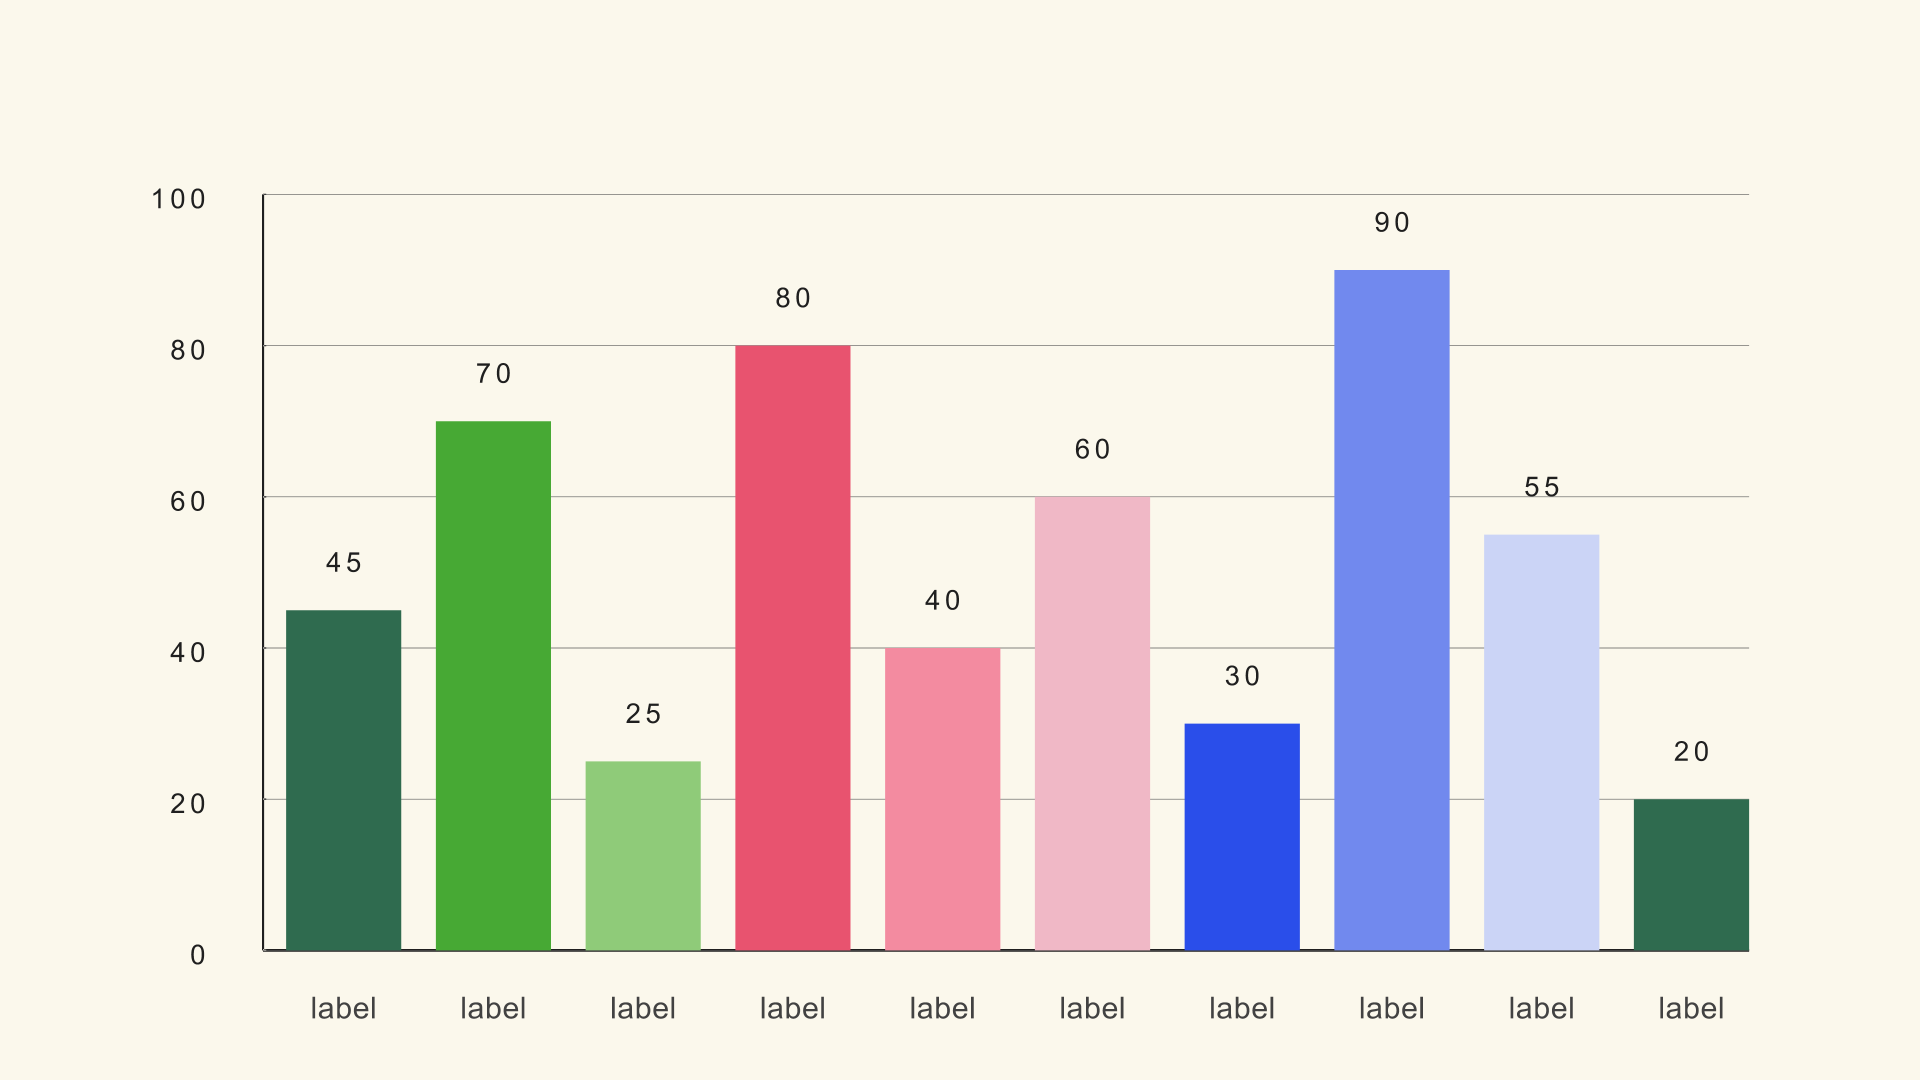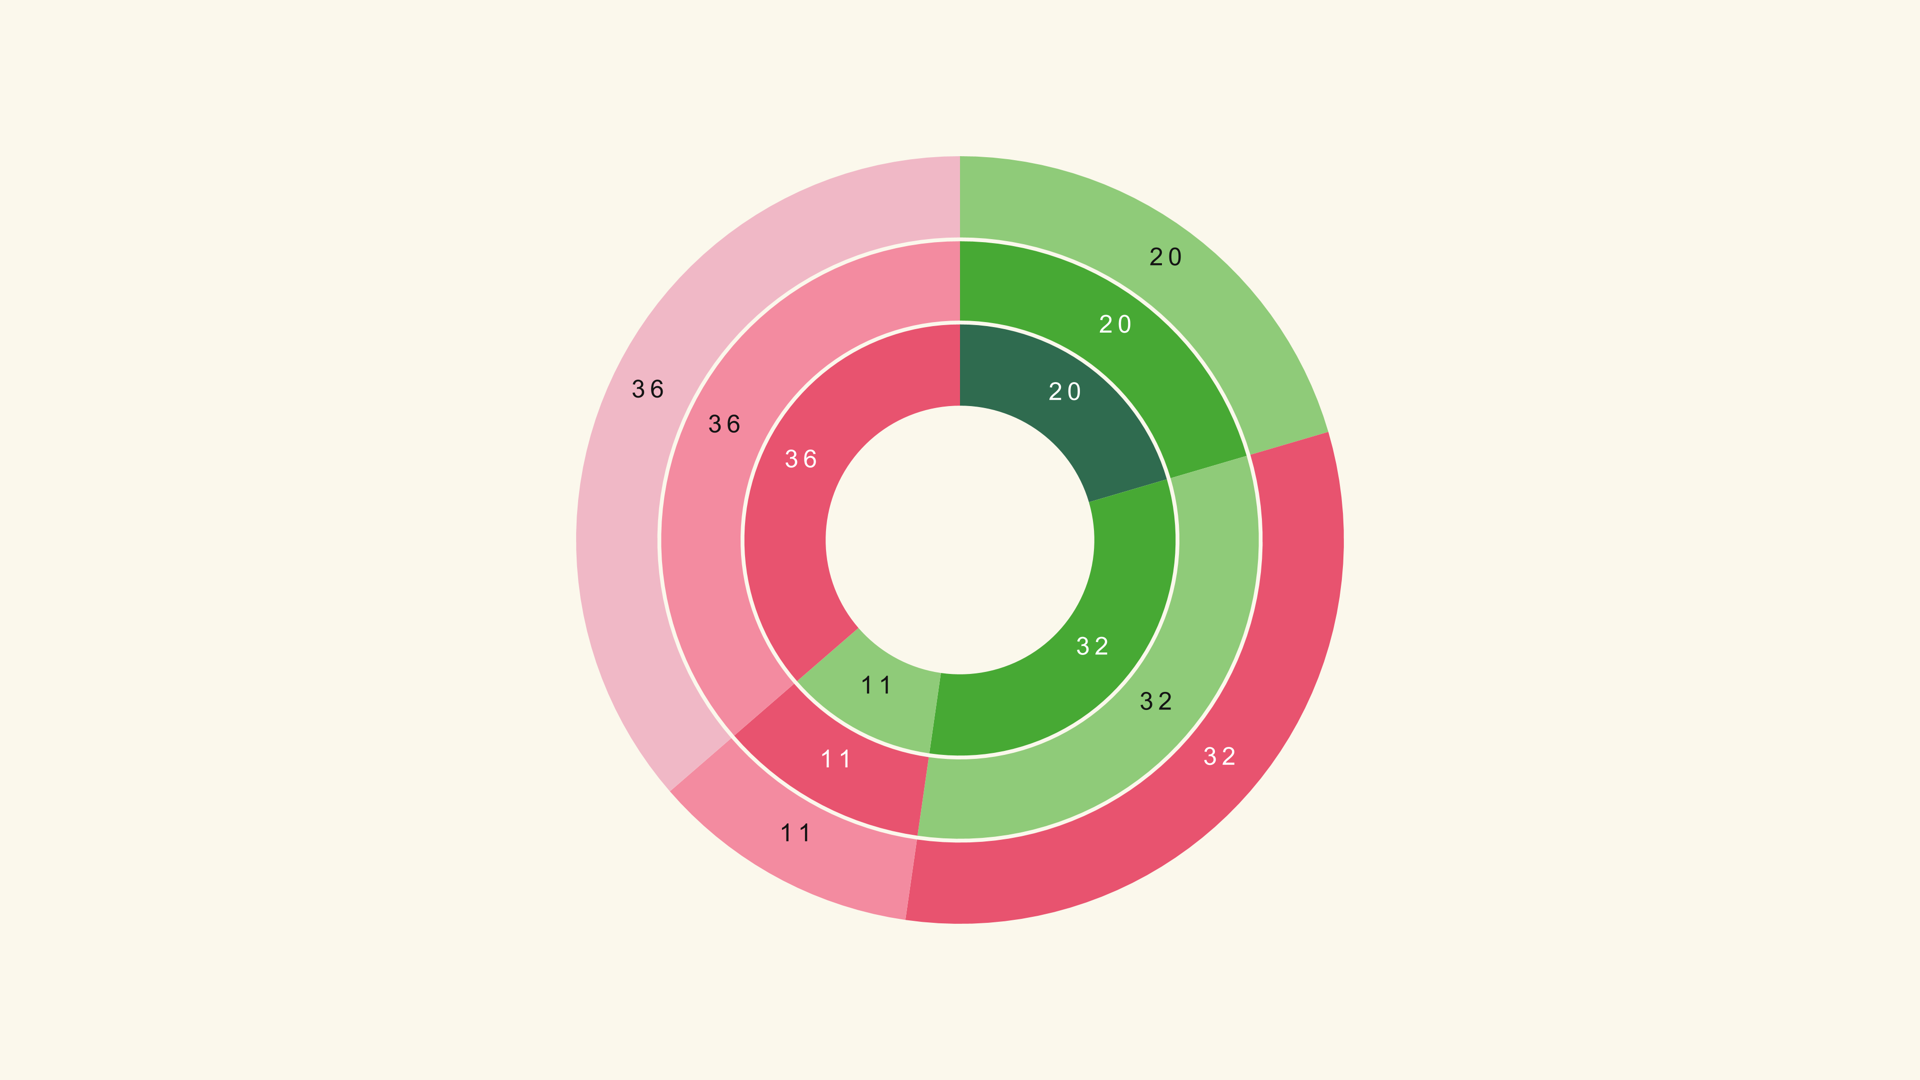
A chart that looks good in a still can fail on a timeline. Video adds motion, compression, a smaller viewing angle and a viewer who is also listening to a voiceover. The chart has to survive all of that while still making one idea obvious.
These are the design rules that matter most when the chart is going into DaVinci Resolve. They apply to native Fusion generators, hand-built Fusion comps and any other chart you bring into the edit. The goal is not a house style; it is a chart the audience can read before the next shot arrives.
Video is not print
A print chart can be studied. A video chart is usually on screen for a few seconds, often on a phone, sometimes while the viewer is doing something else. That changes the design brief.
The biggest mistake is importing a dense report chart into a video frame. The chart may be accurate, but the labels are too small, the colors are too subtle and the grid is too busy. The viewer cannot zoom in, pause at the right moment or ask a question. The chart has to work at a glance.
One idea per frame
Decide the single idea the chart should communicate. "Direct traffic is the largest source" is an idea. "Traffic sources" is a topic. The chart, the labels and the motion should all serve the idea.
If the chart needs two ideas, consider two shots. A single bar chart with one highlighted bar is easier to read than a dashboard with five charts. The viewer can only hold one main comparison at a time, especially when the voiceover is adding context.
Reduce the category count
Fewer categories make everything else easier. The labels get bigger, the colors get more distinct and the chart gets more space. A twelve-bar chart can work on a full frame; a thirty-bar chart rarely does.
Group small categories into "Other" or split the data across shots. If the chart is a ranked list, show the top five and mention the rest in the voiceover. The chart does not have to contain every row in the spreadsheet.
Size the type for the output
Design at the final size. If the chart occupies a third of the frame, the labels need to be large enough to read in that third, not in a full-screen preview. Test on a phone-sized screen and at the delivery bitrate.
A useful check is to look at the chart from across the room. If the labels disappear, they are too small. If the chart is for a social feed, the same rule applies even more strongly: the viewer is often holding the phone at arm's length with the sound off.
Raise the contrast
Video compression softens edges and reduces subtle color differences. A light gray label on a mid-gray background may look elegant on a calibrated monitor and disappear on a phone. Increase the luminance difference between the text, the data marks and the background.
Do not rely on hue alone to separate categories. Use value and position as well. A chart that works in grayscale is more likely to survive compression, color-blind viewers and a bad screen.
Use one accent color
Pick one color to direct attention. The accent can mark the category the voiceover is discussing, the outlier or the current period. The rest of the chart should recede.
A theme provides a palette; the accent is the edit decision. If every bar is a different color, the viewer has no reason to look at any particular one. If the story changes from one category to another, consider two shots rather than two accents in the same frame.
Respect the safe area
Platform UI, captions and lower thirds can cover the edges of the frame. Keep the chart labels and key numbers inside a safe area. A label that sits at the very edge may be cropped by a player, a social interface or a broadcast safe-area requirement.
For vertical video, leave room at the top and bottom for captions. For a lower-third graphic, design the chart as a smaller composition rather than scaling down a full-frame chart. The proportions change, so the layout should change with them.
Animate the reading order
Motion is a design element, not a decoration. A bar grow tells the viewer to read from the baseline. A line draw tells them to follow the time axis. A pie sweep tells them to move around the circle.
Animate the headline first, then the chart, then the callout the voiceover is explaining. If everything arrives at once, the viewer has no path through the frame. If the animation is longer than the idea, shorten it.
Keep a sequence consistent
If a video uses several charts, keep the type, colors, scale and motion consistent. The viewer learns the visual system once and can spend the rest of the time on the data. A different palette for every chart forces them to relearn the code.
Use the same Chart Max when the charts are meant to be compared. If the scale changes, say so in the title or caption. Consistency is not only aesthetic; it is part of the chart's honesty.
A practical checklist
- Can the main idea be stated in one sentence?
- Are there fewer than twelve data marks on screen?
- Are the labels readable on a phone-sized preview?
- Does the chart survive compression and grayscale?
- Is there one accent color pointing at the story?
- Do the labels stay inside the safe area?
- Does the final frame read without motion?
- Is the scale consistent with the surrounding shots?
Next steps
Put the checklist beside the charts and graphs workflow, then review the chart reference for the generator that fits the story. If the chart is an infographic composition, read How to Make Infographics in DaVinci Resolve next.