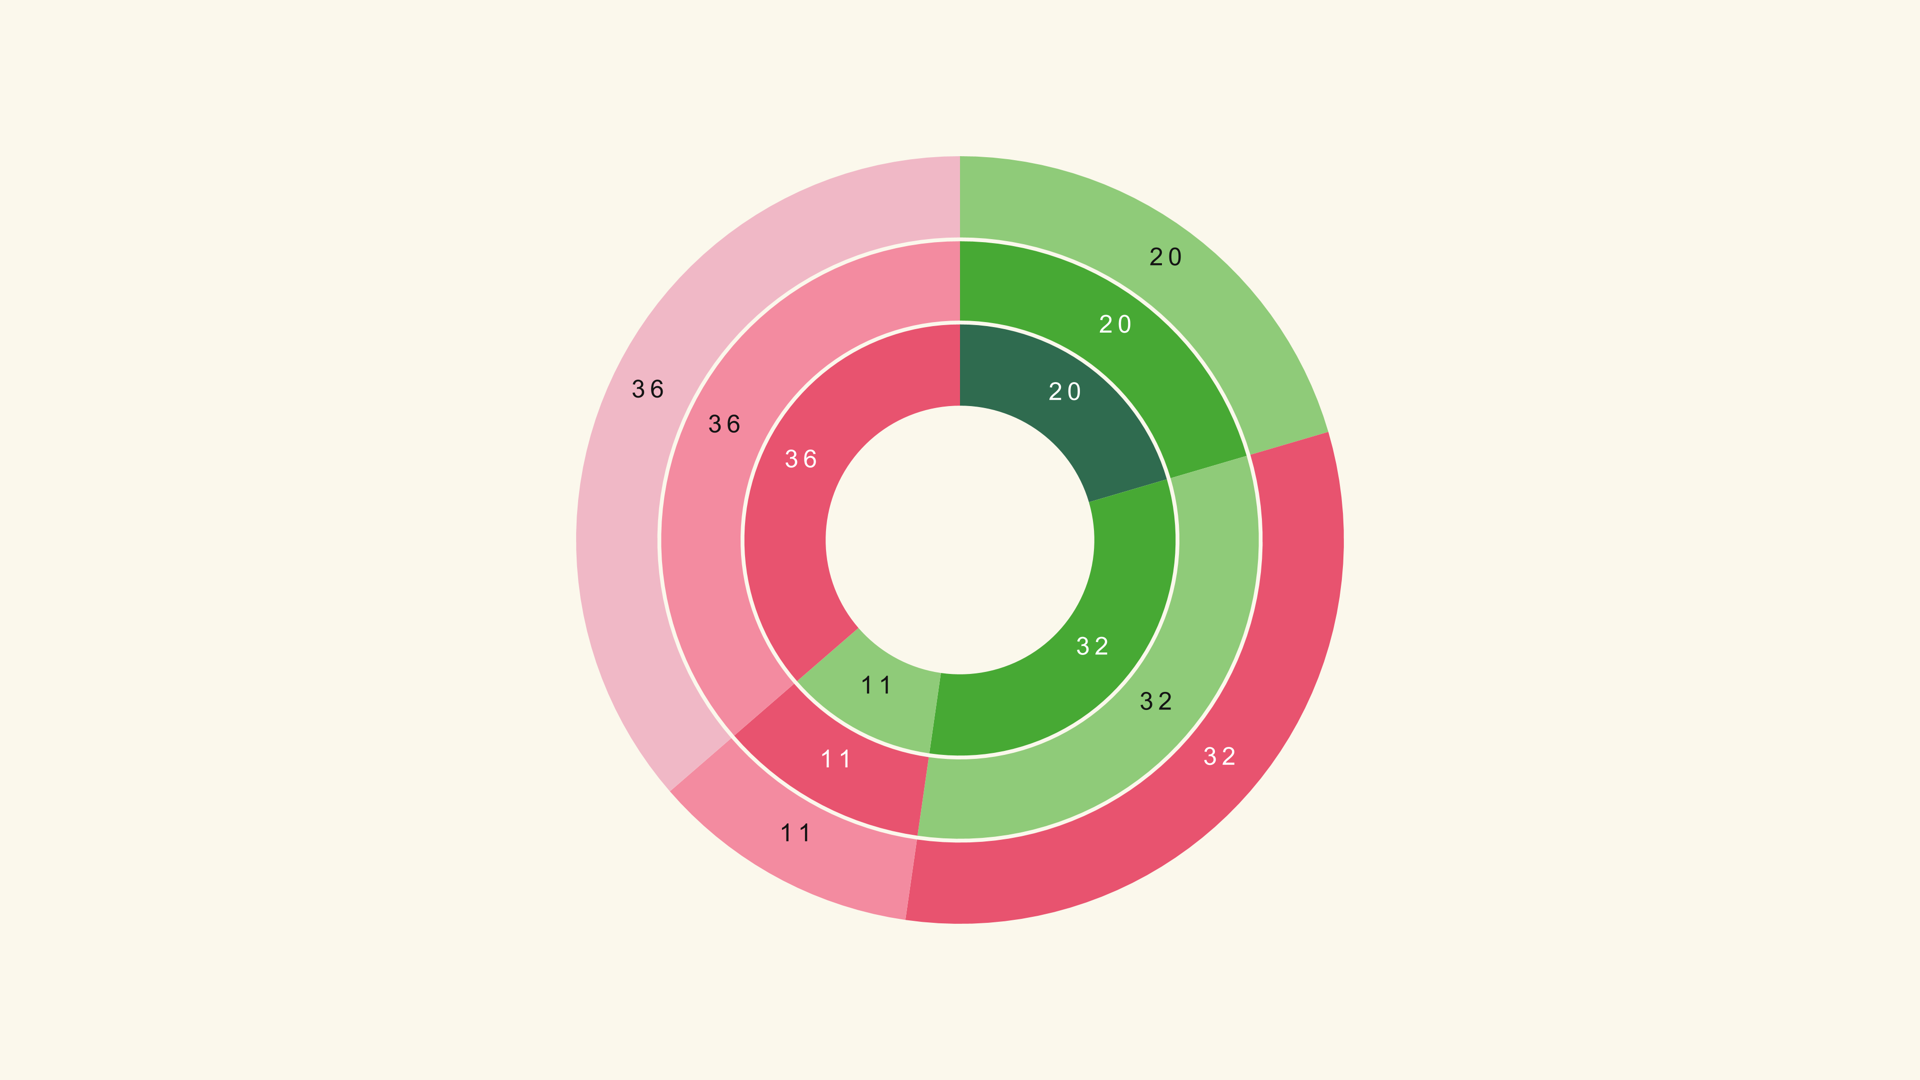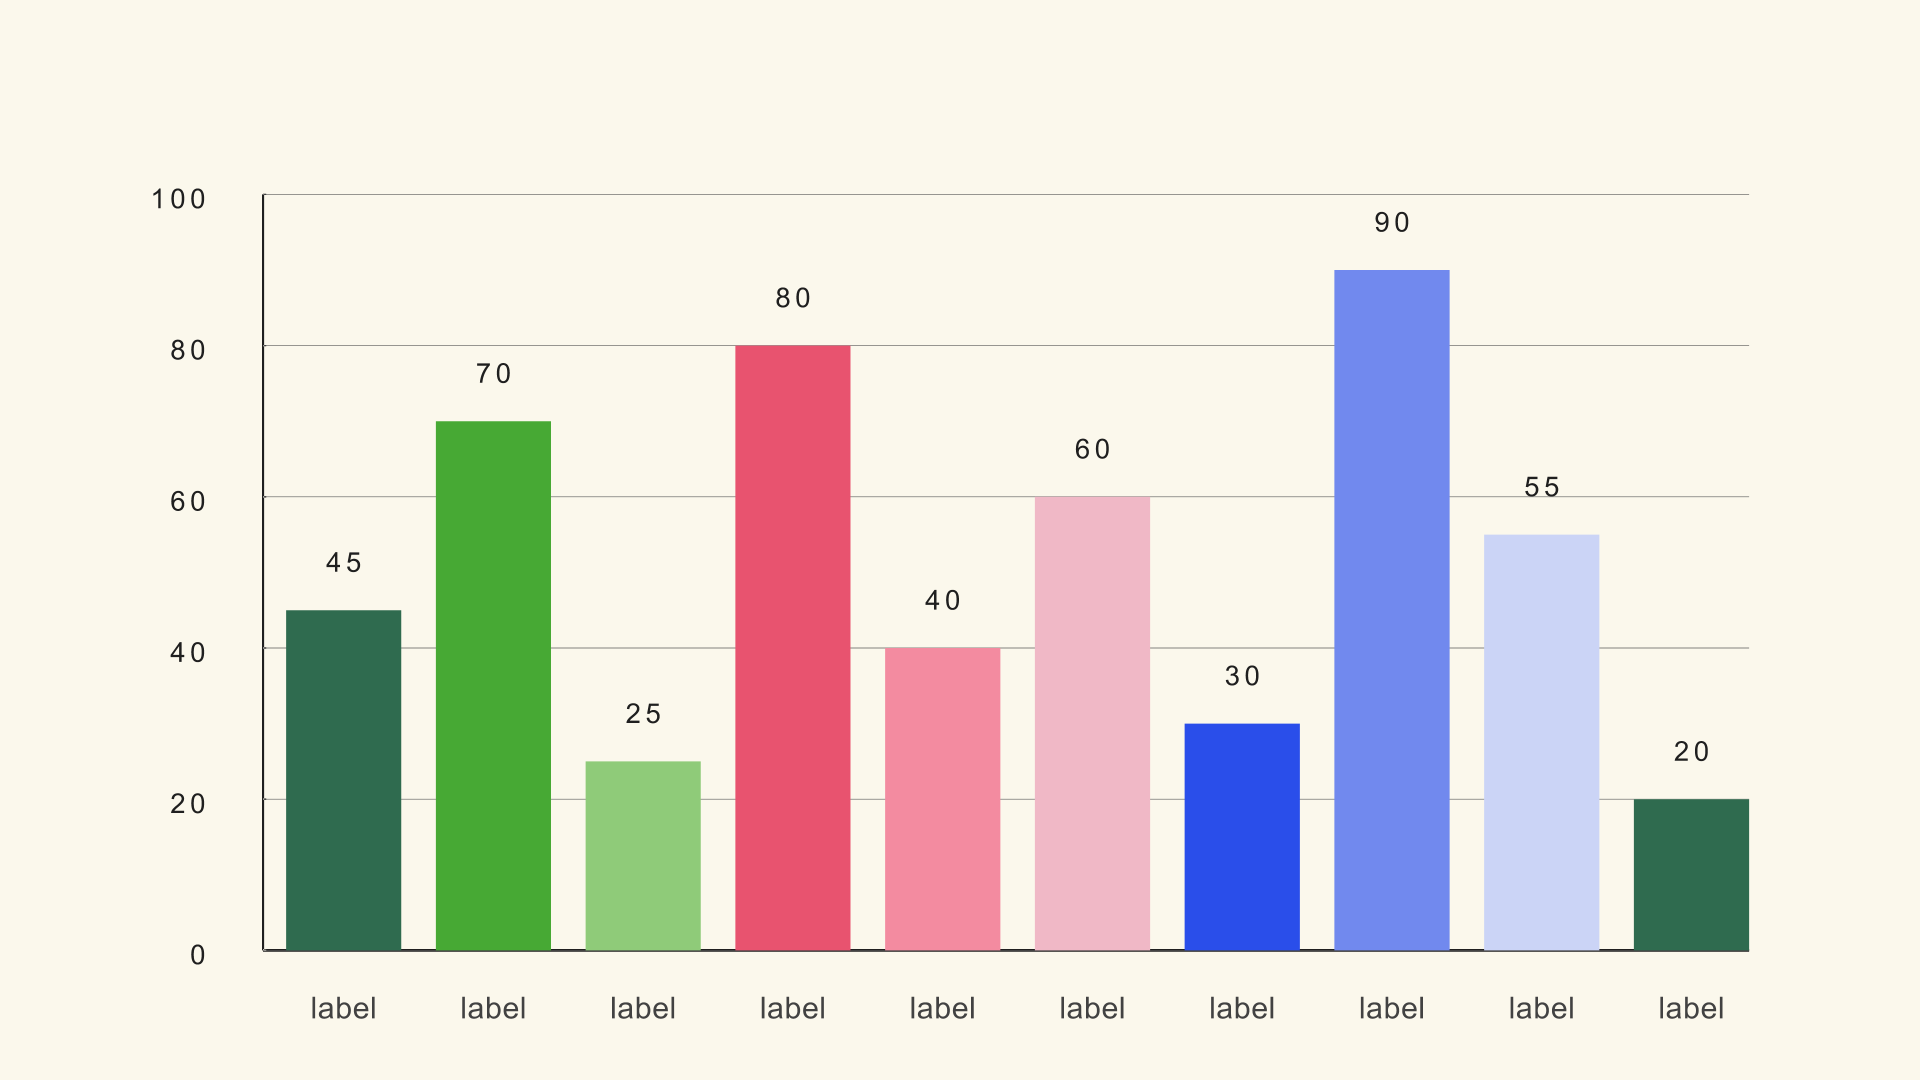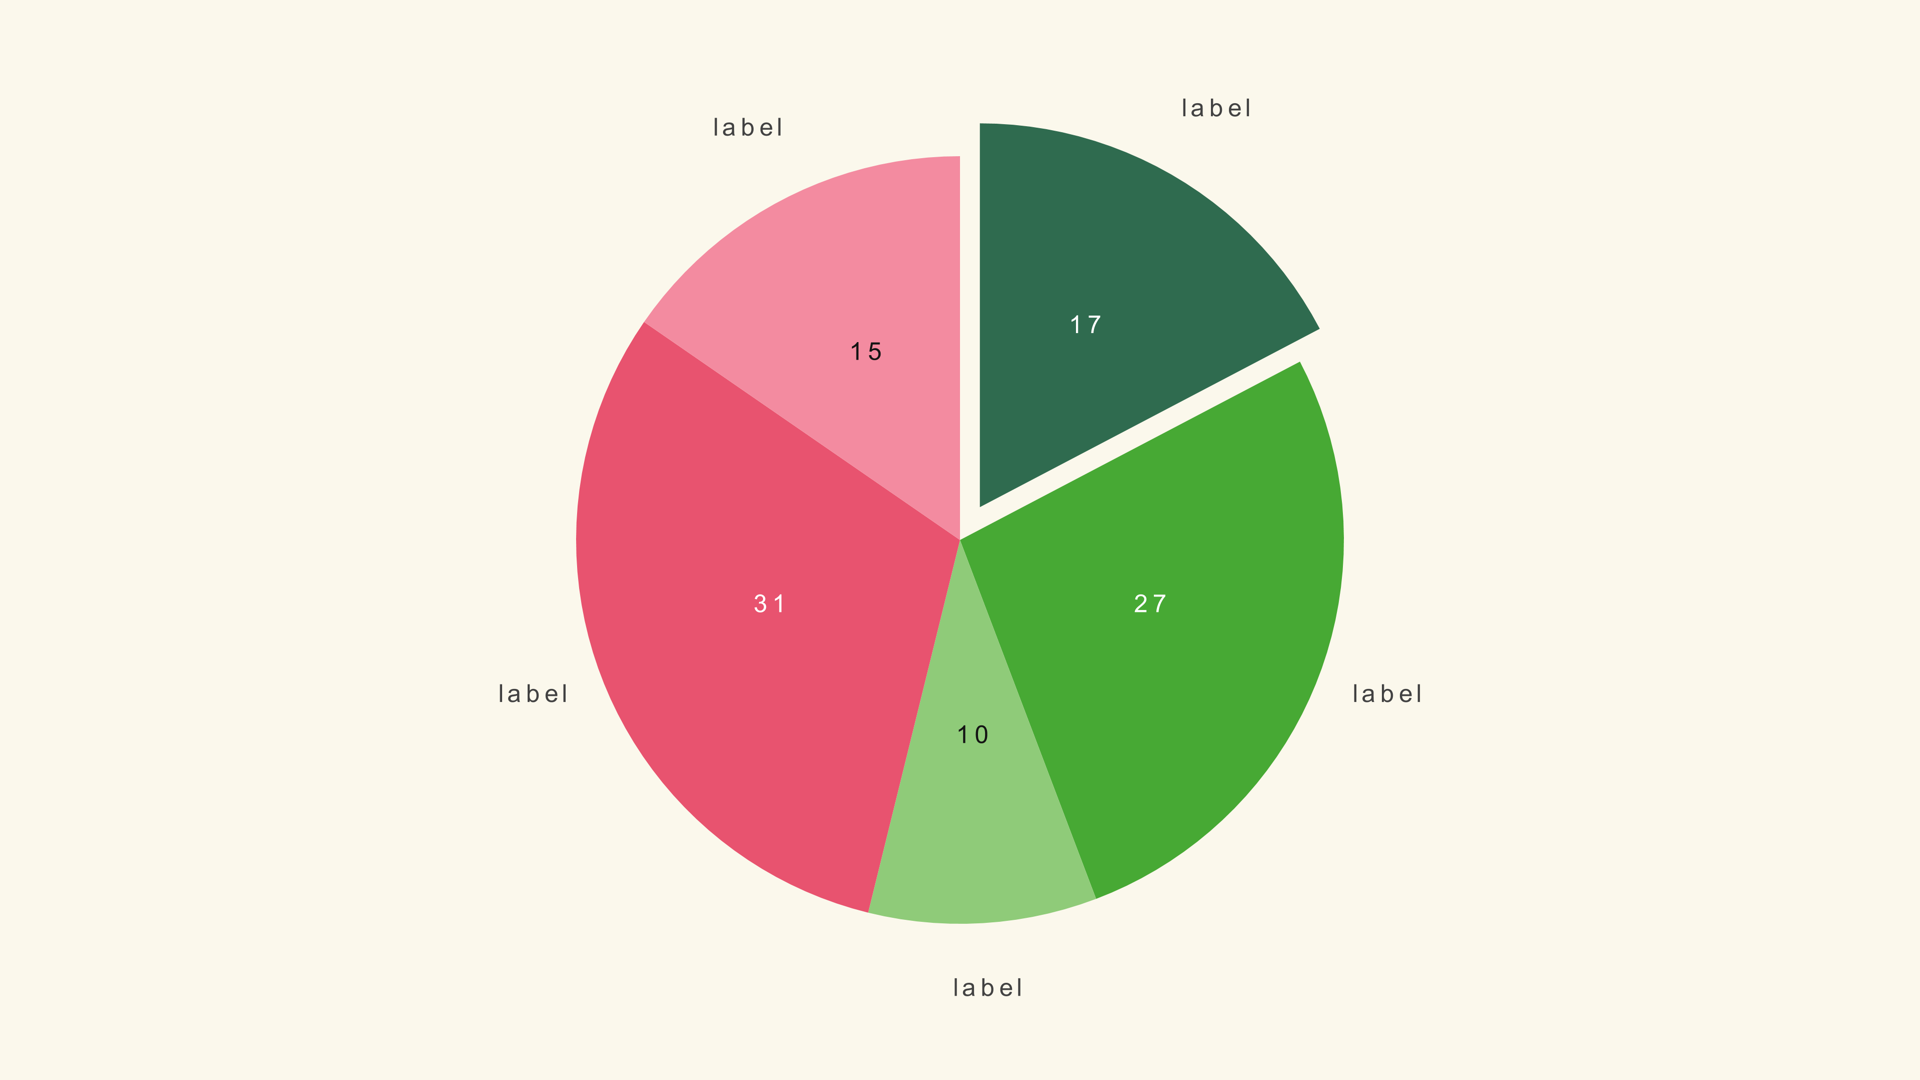
An infographic in a video is not a poster that happens to move. It is a short, layered explanation: a headline tells the viewer what to look for, a chart shows the evidence, and a callout or source line finishes the thought. If all three elements compete for attention, the graphic fails even when every individual piece is well designed.
DaVinci Resolve is a good place to build that composition because the chart, text and motion can live on the same timeline. Native Fusion generators keep the data editable, while Text+ and the Edit page handle the typography and the supporting graphics. This guide covers the planning and build order.
Start with the takeaway
Before you open Resolve, write the sentence the audience should remember. "Direct traffic is nearly as large as search and social combined" is a takeaway. "Traffic sources" is a topic. The takeaway decides the chart, the labels and the motion.
If the takeaway needs two charts, consider whether it should be two shots instead of one crowded frame. A single chart with one callout usually beats two charts competing for the same space. The viewer can only hold one main idea at a time.
Plan the hierarchy
A readable infographic has three levels: the headline, the primary evidence and the supporting detail. The headline is the largest text. The chart is the largest visual object. The callout and source line are smaller and quieter.
- Level 1: the takeaway headline, readable in one glance.
- Level 2: the primary chart or number.
- Level 3: labels, units, source and explanatory callouts.
Decide the layout before you style the chart. A 16:9 frame has room for a chart and a headline side by side; a 9:16 frame usually needs the headline above the chart and the labels below. The chart should be designed for the frame it will actually occupy, not for a full-screen still.
Choose one primary chart
Use a bar chart for comparison, a line for a trend, a pie or donut for a simple share, a stacked bar for composition and a treemap for a compact overview. The charts and graphs guide has a decision table if you are unsure.
Keep the chart simple enough to read at the size it will appear. If the infographic occupies a third of the frame, the chart needs fewer categories and larger labels than a full-screen chart. Do not design at full-screen size and then scale it down; design at the final size.
Build the infographic in Resolve
- Create the chart generator on the timeline and load the data.
- Lock the scale and the category count before styling.
- Add the headline as a separate Text+ clip above the chart.
- Add callouts, a source line and any brand elements as their own layers.
- Group or nest the layers once the composition is locked.
Keeping the elements separate makes revisions easier. A client can change the headline without touching the chart, and you can replace the data without rebuilding the type. If the composition becomes complex, use a Fusion comp or a nested timeline rather than dozens of independent clips.
Style the chart and the type
Start with a theme, then override only the elements the brand requires. The chart and the headline should feel like part of the same system: same type family, consistent color temperature, enough contrast between the data and the background.
For video, the contrast rule is stricter than in print. A subtle gray label on a dark background may look elegant on a monitor and disappear after compression. Test the composition on a phone-sized preview and at the final delivery bitrate. If the labels disappear, increase the contrast or remove a layer.
Use one accent color to point at the data the voiceover is discussing. A second accent can highlight a comparison, but a third usually turns the frame into a rainbow. The theme already provides a palette; the accent is there to direct attention.
Keep the labels readable
Every label in an infographic has to earn its space. If the headline already says "direct traffic leads," the chart does not need a callout repeating the same words. Keep the units and the source, drop the rest.
Value labels are useful when the exact number matters. When the story is the ranking or the share, the labels can be quieter. Do not use both a legend and a full set of category labels unless the chart genuinely needs both.
Animate in layers
The reading order should be headline, chart, then detail. Bring the headline in first, reveal the chart next and let the callout arrive when the voiceover reaches it. If everything arrives at once, the viewer has no path through the frame.
Use the chart's built-in animation for the data marks and separate keyframes for the text layers. Keep the durations short. An infographic that takes four seconds to assemble is already too slow for a ten-second social clip.
Export with the right background
If the infographic is a full-frame graphic, render it with the background card on and use the same delivery settings as the rest of the edit. If it is an overlay, turn the chart background off and render a codec that preserves alpha. Check the edges of the frame for transparent gaps before you send it to a client.
For social versions, create separate timelines for 16:9, 1:1 and 9:16 rather than cropping one composition. The chart and the type need different proportions in each format.
Common mistakes
- Too many charts. One primary chart per frame is usually enough.
- No clear hierarchy. The headline, chart and callout all shout at the same volume.
- Designing at the wrong size. Labels that work full-screen fail in a third-frame inset.
- Animating everything at once. The viewer cannot find the reading order.
- Forgetting the source. A data graphic without a source is harder to trust.
Next steps
Read How to Design Charts for Video for the visual rules, then build a one-chart infographic using the Bar Basic guide or the animated pie chart workflow.