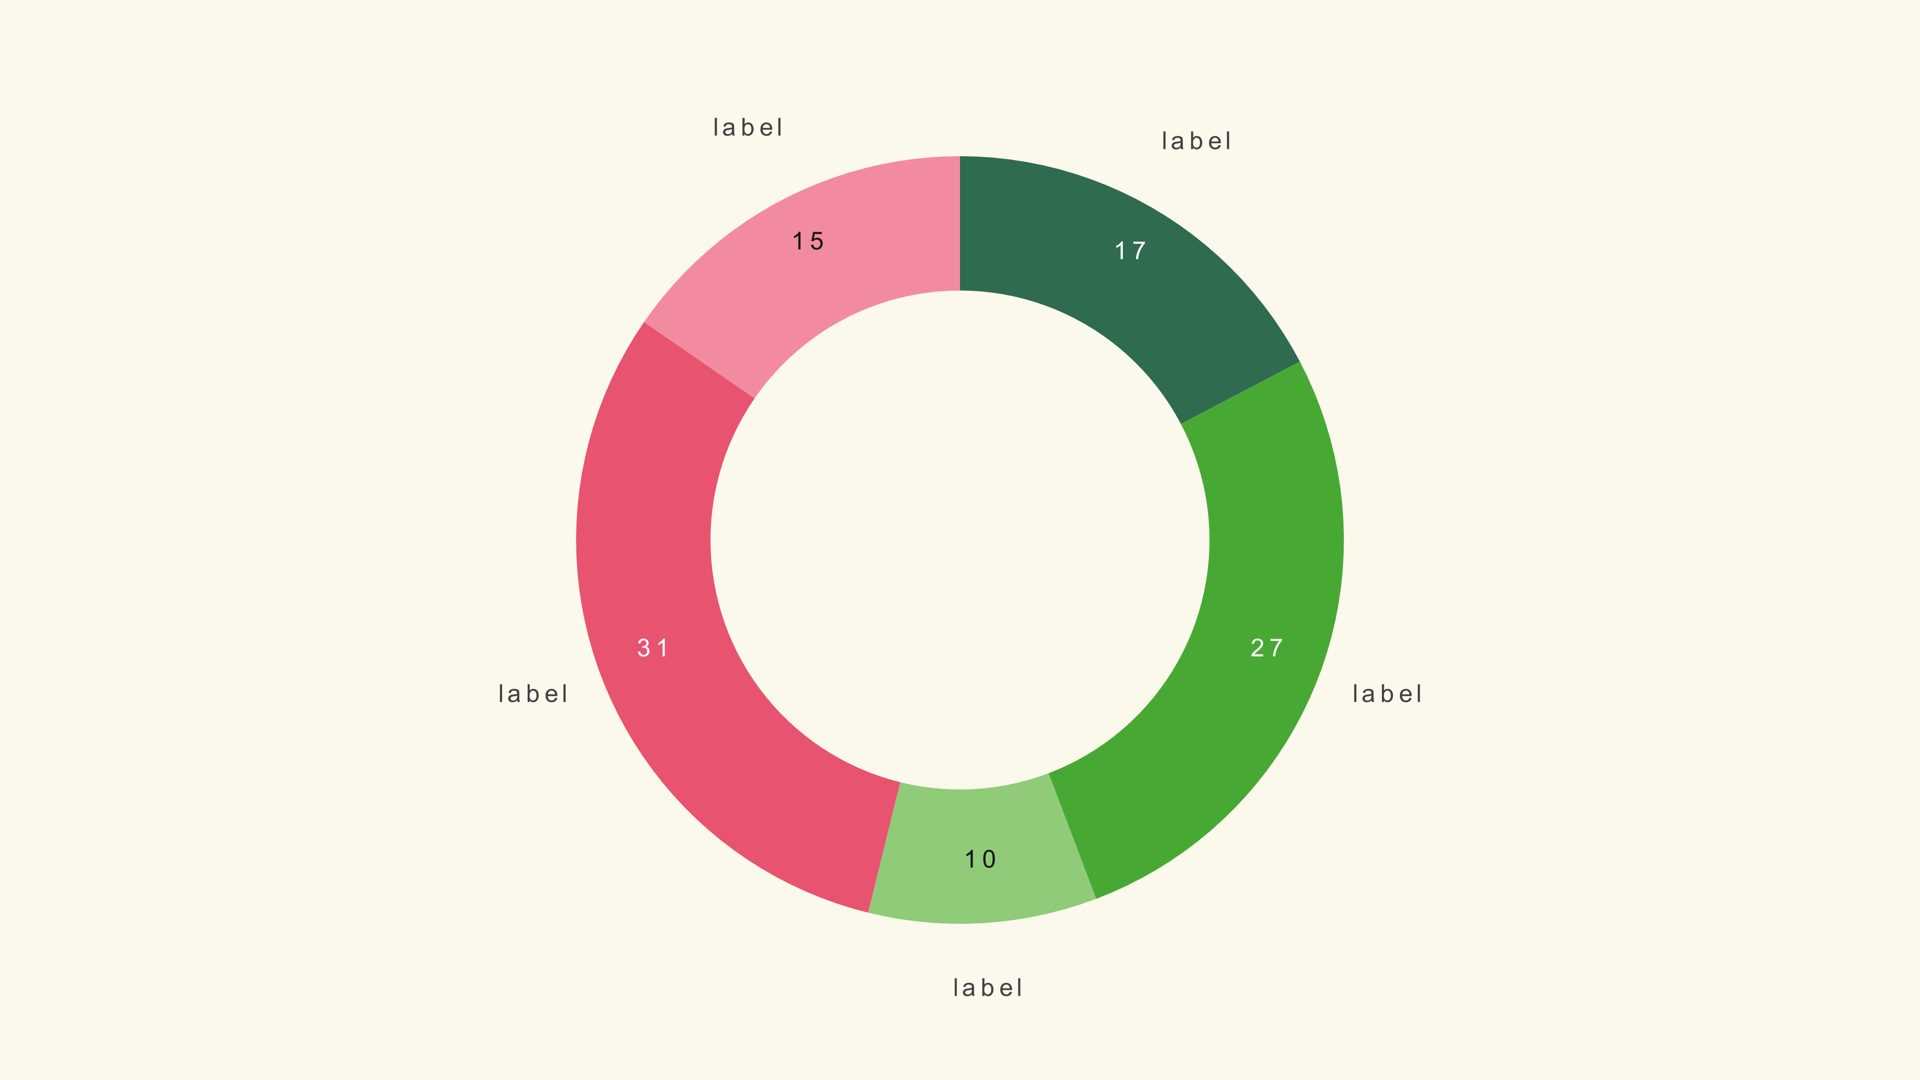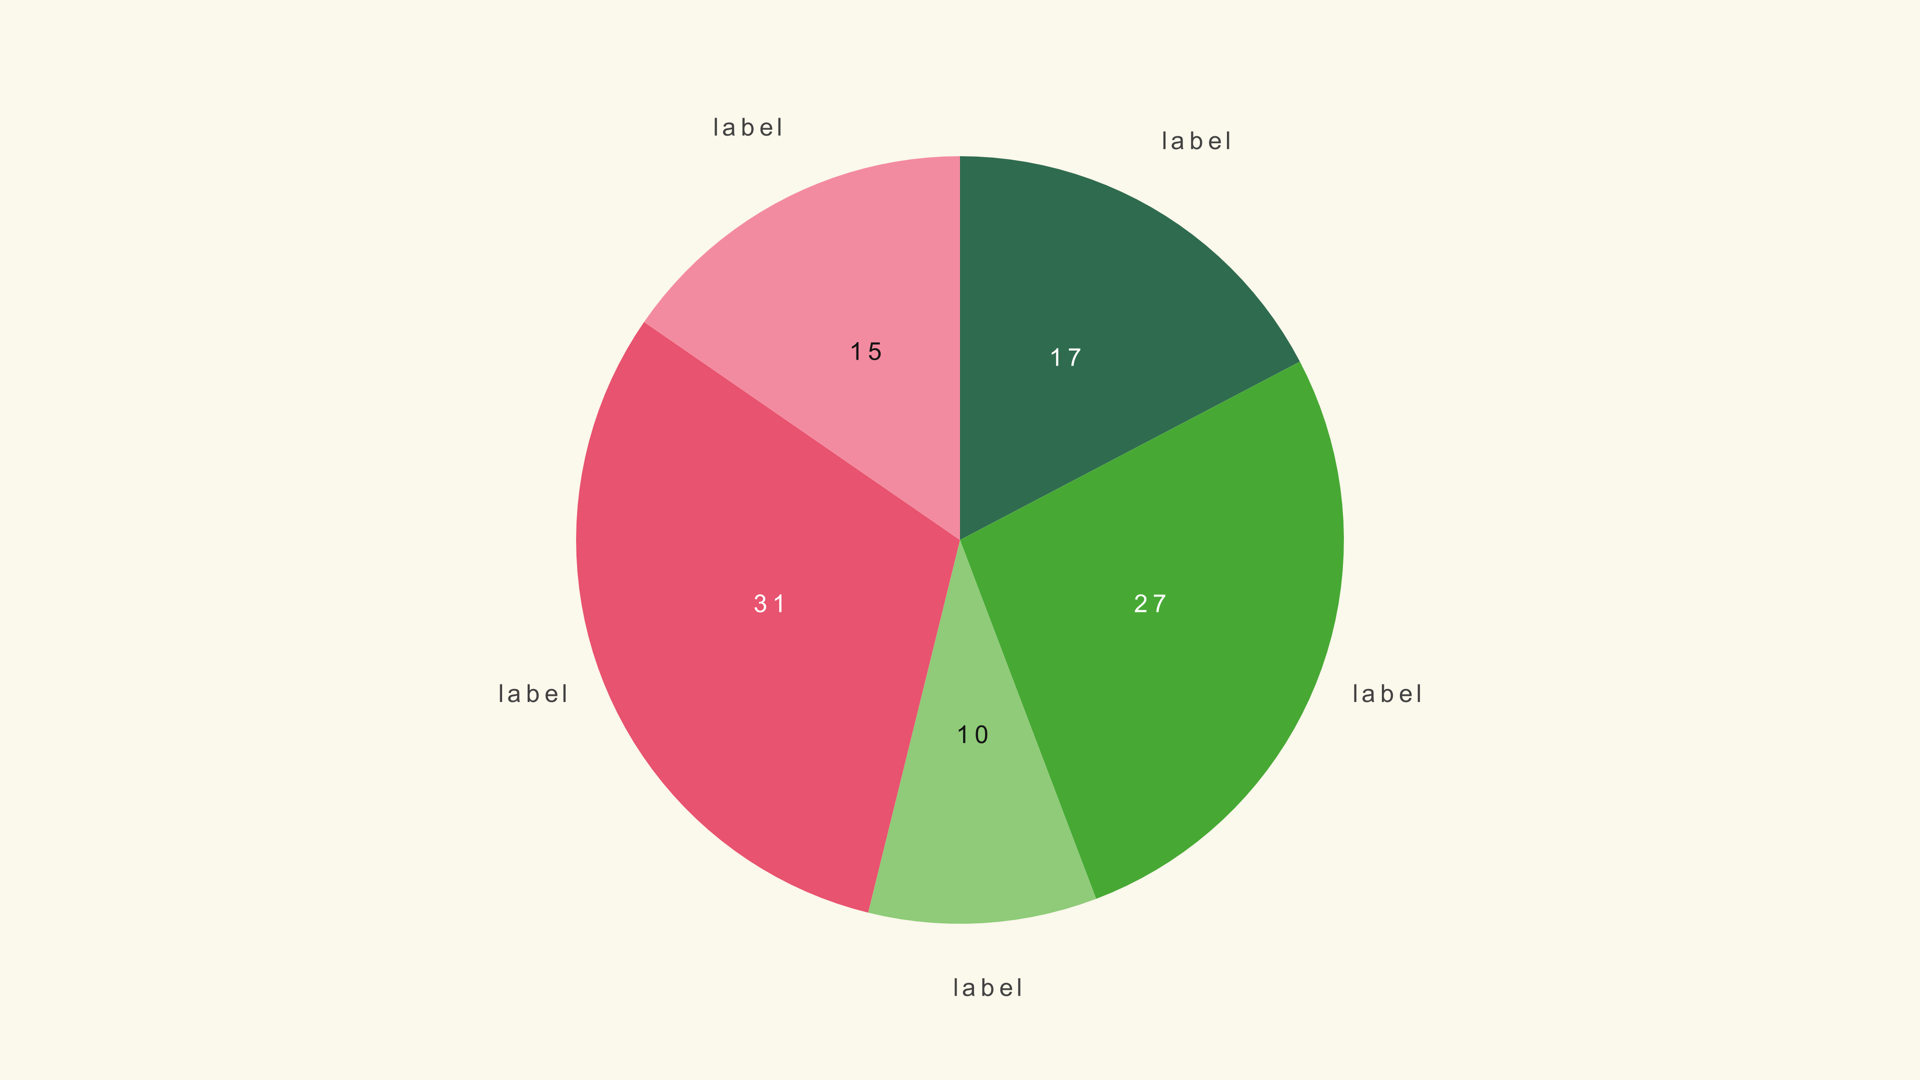
A pie chart is a shape the audience already understands. One circle, a few slices, and the largest share is obvious before anyone reads a label. That familiarity is useful in a short video graphic, where the viewer may only have a second or two to understand the composition.
Pie Basic makes the graphic inside DaVinci Resolve. It is a native Fusion generator, so you load values, set the geometry and animate the sweep without leaving the edit. This guide covers the data, the controls that matter and the cases where a different chart will tell the truth more clearly.
When a pie chart works
Use a pie when the story is parts of a whole and the number of parts is small. Budget share, audience mix, survey responses and a simple split across a handful of categories are all good fits. The slices should be mutually exclusive and should add up to something the viewer cares about.
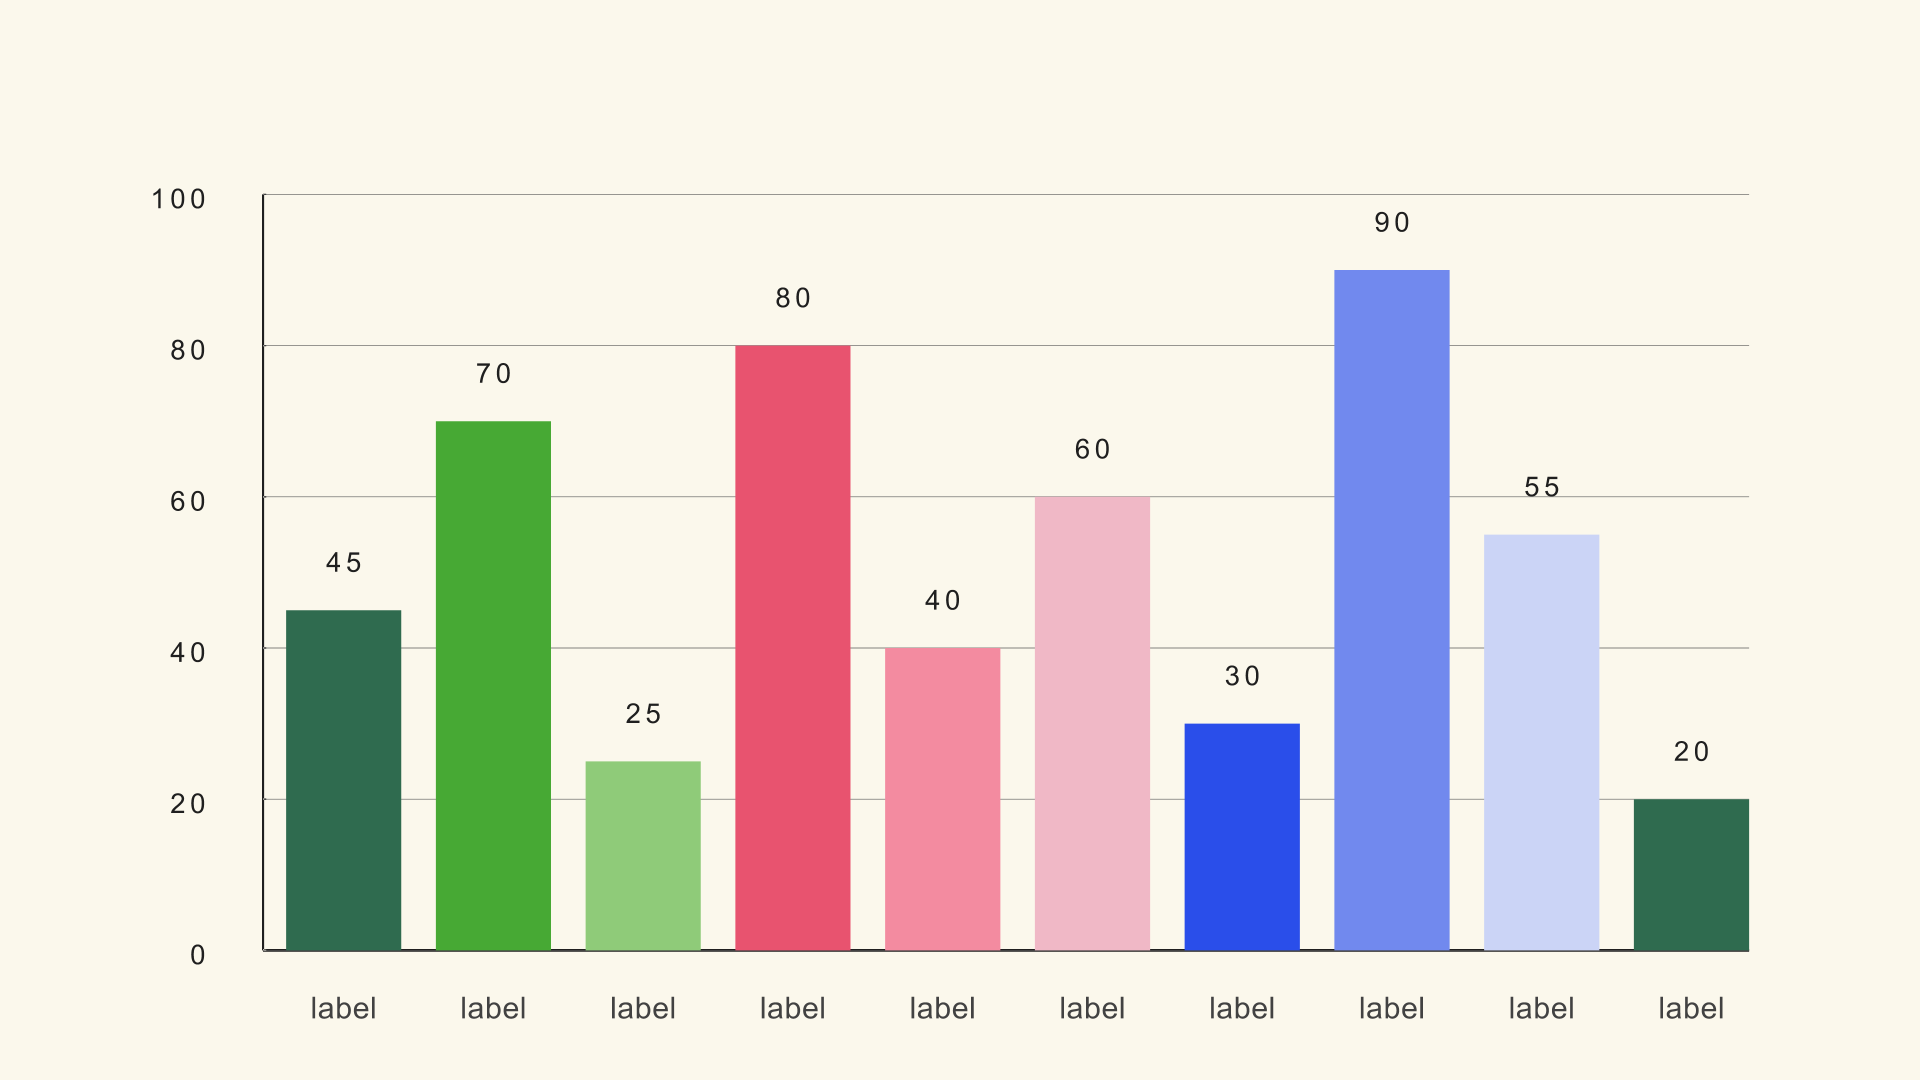
A pie is a weak choice when the values are close, when there are many categories, or when the audience needs to compare exact magnitudes. The human eye is better at comparing lengths than angles. If the script says "twice as many" or "three points higher," a bar chart will usually make the comparison faster and more accurate.
Prepare the values
Pie Basic expects a label/value table. The generator divides each value by the sum, so the values can be percentages or raw totals. You do not need to convert everything to 100 before import.
Channel,Share
Direct,38
Search,27
Social,21
Referral,14
The sample file is pie-basic.csv. Keep labels short enough to read in the legend. If a category name is longer than a few words, shorten it for the chart and explain the detail in the voiceover or a caption.
Add Pie Basic to the timeline
- Drag Pie Basic from Effects - Generators - Noyris Charts onto a clip above your footage.
- Open the Data page in the Inspector.
- Point CSV File at the file and leave Header Row First off for the sample.
- Set Slices to the number of rows.
- Check that the labels and values appear in the expected order.
If the slices are in the wrong order, sort the CSV before import rather than rebuilding the chart. The generator reads the rows from top to bottom.
Set the geometry
Pie Radius controls how much of the frame the circle fills. Donut Hole turns the pie into a ring; leave it at zero for a solid pie. Slice Separator adds a small gap between neighboring slices. A tiny gap helps the eye separate colors, but too much gap makes the chart look like a ring of unrelated shapes.
The default radius is a good starting point for a centered graphic. If the chart sits beside a headline or a presenter, move the chart position first, then reduce the radius so the labels have room. Do not shrink the labels to make a crowded composition fit; simplify the composition instead.
Labels and legend
Pie Basic can show value labels, category labels and a legend. You usually do not need all three. If the legend names the slices, the category labels can be reduced or turned off. If the values matter, keep the value labels and make them large enough to read at output size.
Place the legend where it does not compete with the slice labels. A legend that runs into the circle is worse than no legend at all. For a short social graphic, consider labeling only the two or three slices the voiceover mentions and letting the rest stay quiet.
Animate the sweep
Switch Animate on and choose a sweep style. The motion should follow the circle, not fade the whole chart in at once. A one-second sweep with a small stagger makes the slices arrive in sequence while keeping the composition readable.
Set the start time against the voiceover. If the narrator says "most of the traffic comes from direct," the direct slice should already be visible at that moment. A pie that finishes sweeping after the sentence is over has missed its cue.
Check the final frame with the labels on. The end state should read without motion, and every label should fit inside the frame.
Pie vs. donut vs. bar
Use a donut chart when you need a number or short label in the center. Use a bar chart when exact comparison matters more than the whole. Use a treemap when there are too many categories for a pie but the share of the whole still matters.
Common mistakes
- Too many slices. The labels collide and the angles become impossible to compare.
- Similar colors. Neighboring slices merge after video compression.
- Values that do not form a whole. A pie implies a total; do not use one for overlapping categories.
- Labels that repeat the legend. Pick one labeling system and commit to it.
- A sweep with no cue. Time the reveal to the narration, not to the clip length.
Next steps
Load the pie sample and rebuild it once with five slices. Then read the Pie Basic guide for the full control list and the Pie Donut guide if you want a center label.