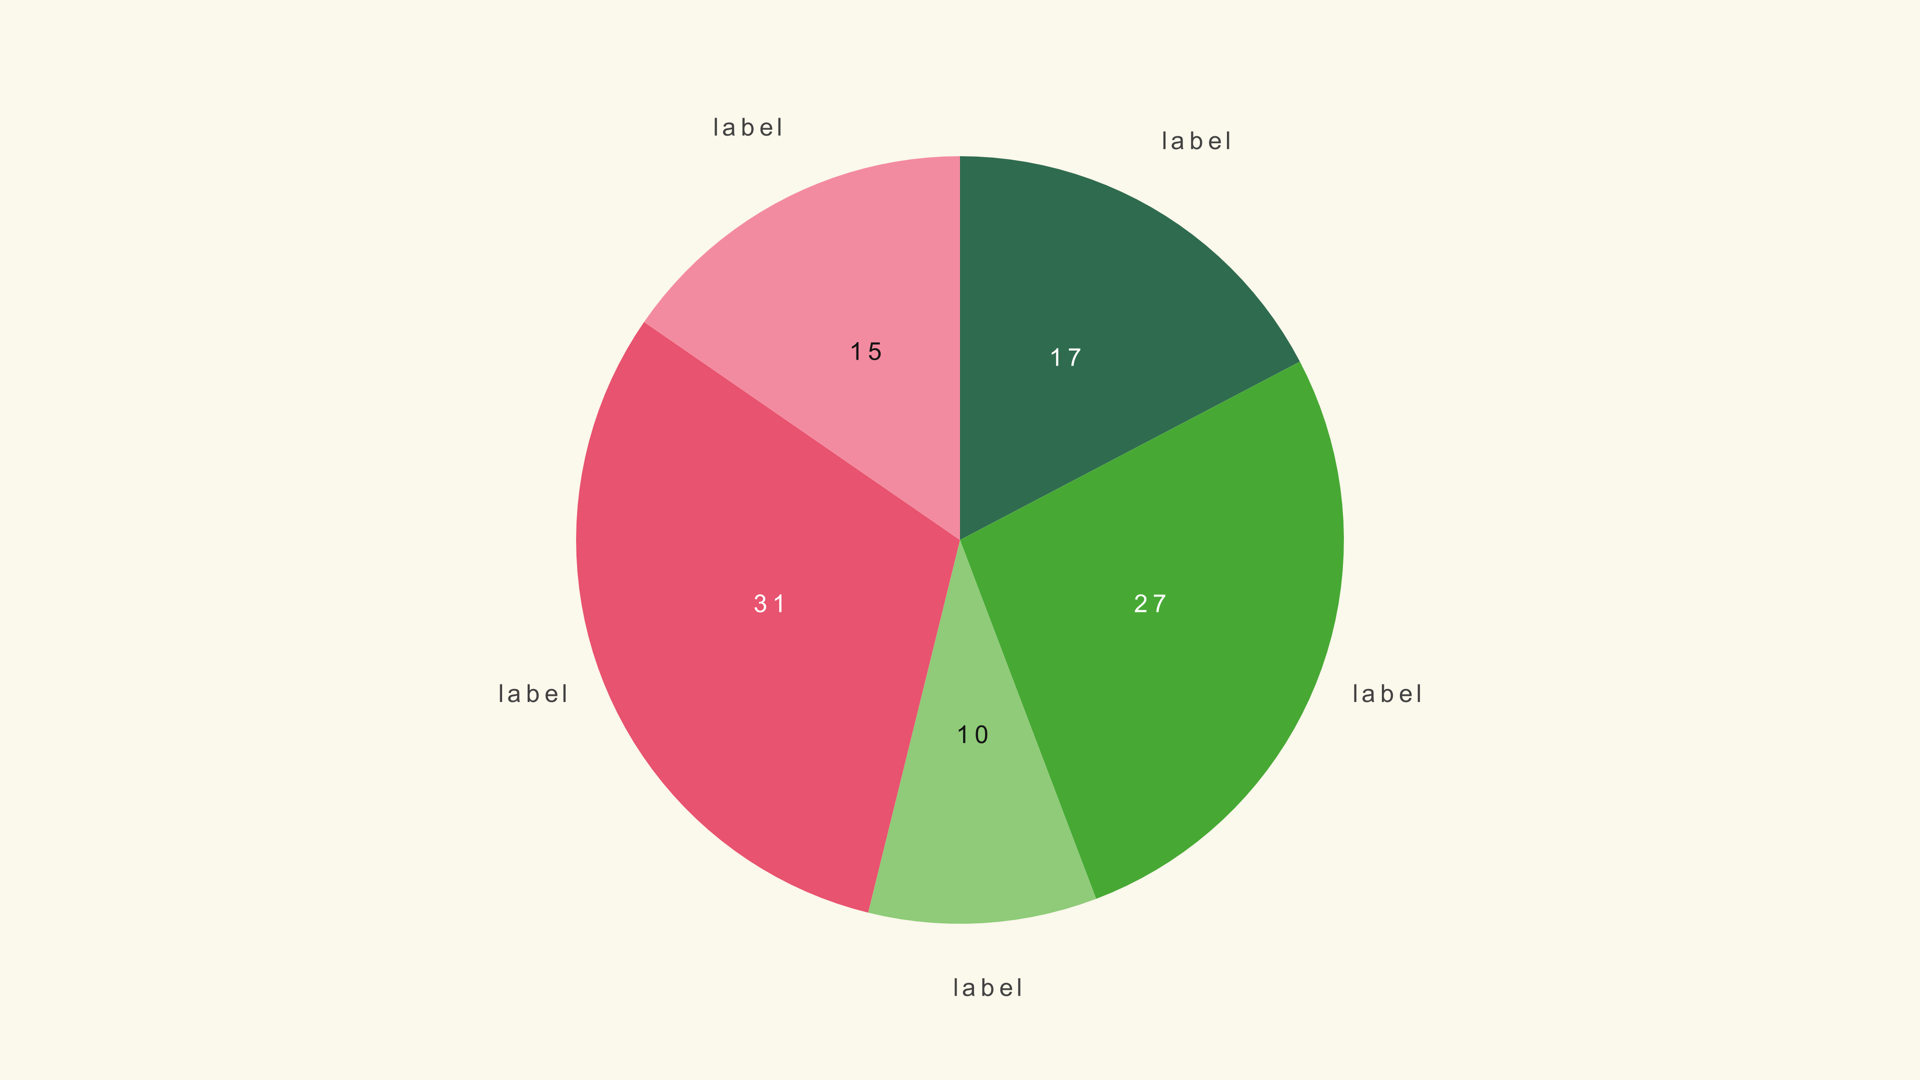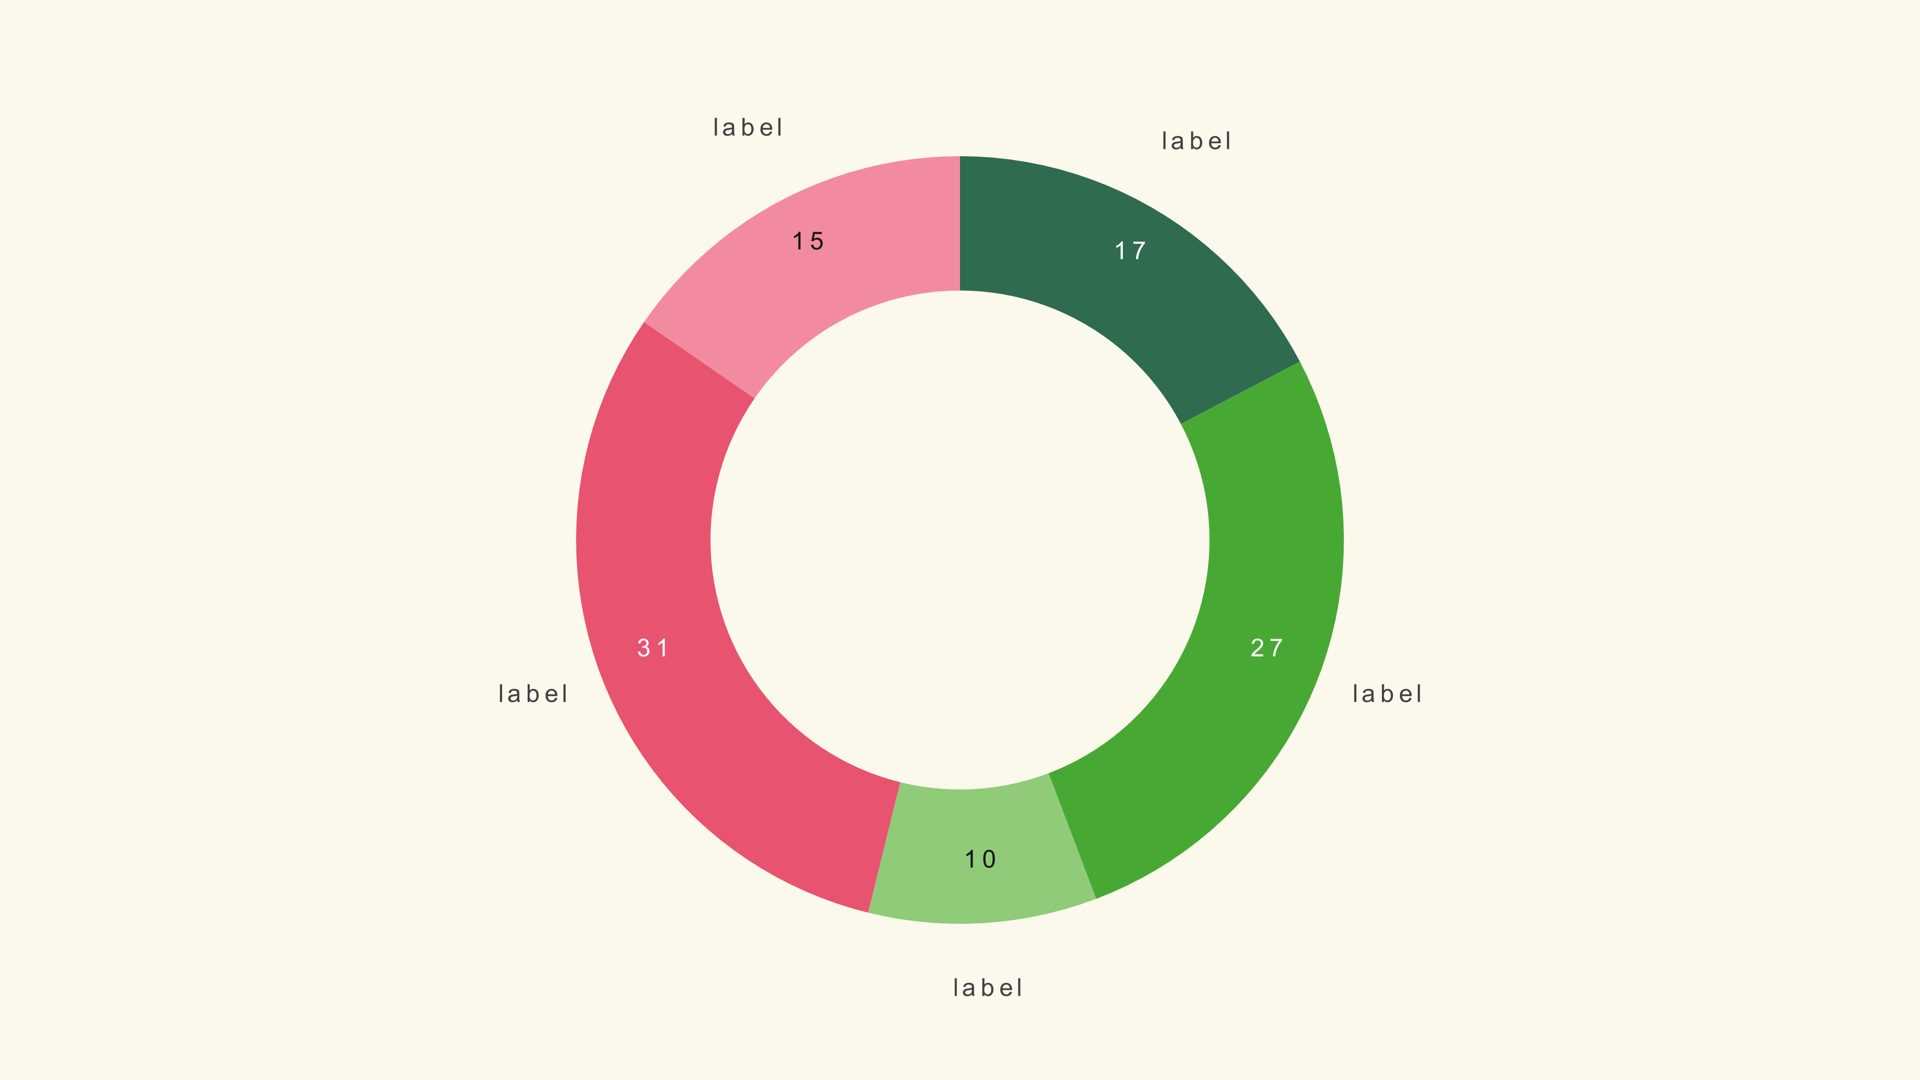
A donut chart keeps the familiar shape of a pie but opens the middle. That empty center is the point: it gives you room for a total, a percentage, a short label or a small KPI without adding another graphic to the frame.
Pie Donut is a native Fusion generator for DaVinci Resolve. It reads a label/value CSV, draws a ring and exposes the hole, radius, separator, legend and animation in the Inspector. This guide covers the data, the center composition and the cases where a solid pie or a bar chart is the better choice.
When a donut works
Use a donut when the share of a whole matters and the center can carry the main takeaway. A single percentage, a total revenue figure or a short word in the middle makes the graphic feel purposeful rather than decorative.
Do not use a donut just because it looks lighter than a pie. If the center is empty and the ring is the only information, a solid pie may be easier to read. If the values are close, a bar chart is more accurate than either.
Prepare the values
Pie Donut expects a label/value table. The generator divides each value by the sum, so percentages and raw totals both work. The sample values sum to 100 and read as percentages.
Channel,Share
Direct,38
Search,27
Social,21
Referral,14
The sample file is pie-donut.csv. Keep the labels short enough for the legend, especially when the ring is small.
Load the segments
- Drag Pie Donut from Effects - Generators - Noyris Charts onto a clip above your footage.
- Open Data and point CSV File at the table.
- Set Slices to the number of rows.
- Confirm the label and value columns.
- Check the total that will appear in the center.
If the ring has the wrong number of segments, the Slices control does not match the file. If the colors repeat, check the theme and the per-slice color overrides.
Size the ring and the hole
Pie Radius controls the outer size of the ring. Donut Hole controls the inner opening. Together they decide how much room the center label has and how thick the ring looks.
A thick ring works for a KPI graphic; a thinner ring feels lighter and more decorative. Start with a hole around 0.65 and adjust from there. If the center text feels cramped, increase the hole before shrinking the text.
Put the KPI in the center
The generator leaves the center open; it does not draw the center text. Add a Text+ layer or another Fusion node in the hole for the KPI, total or short callout. Keep the center text much larger than the legend so the takeaway is obvious at a glance.
If the ring is animated, time the center text to arrive after the sweep begins. The viewer should see the ring form and then read the number, not the other way around.
Use semicircle mode
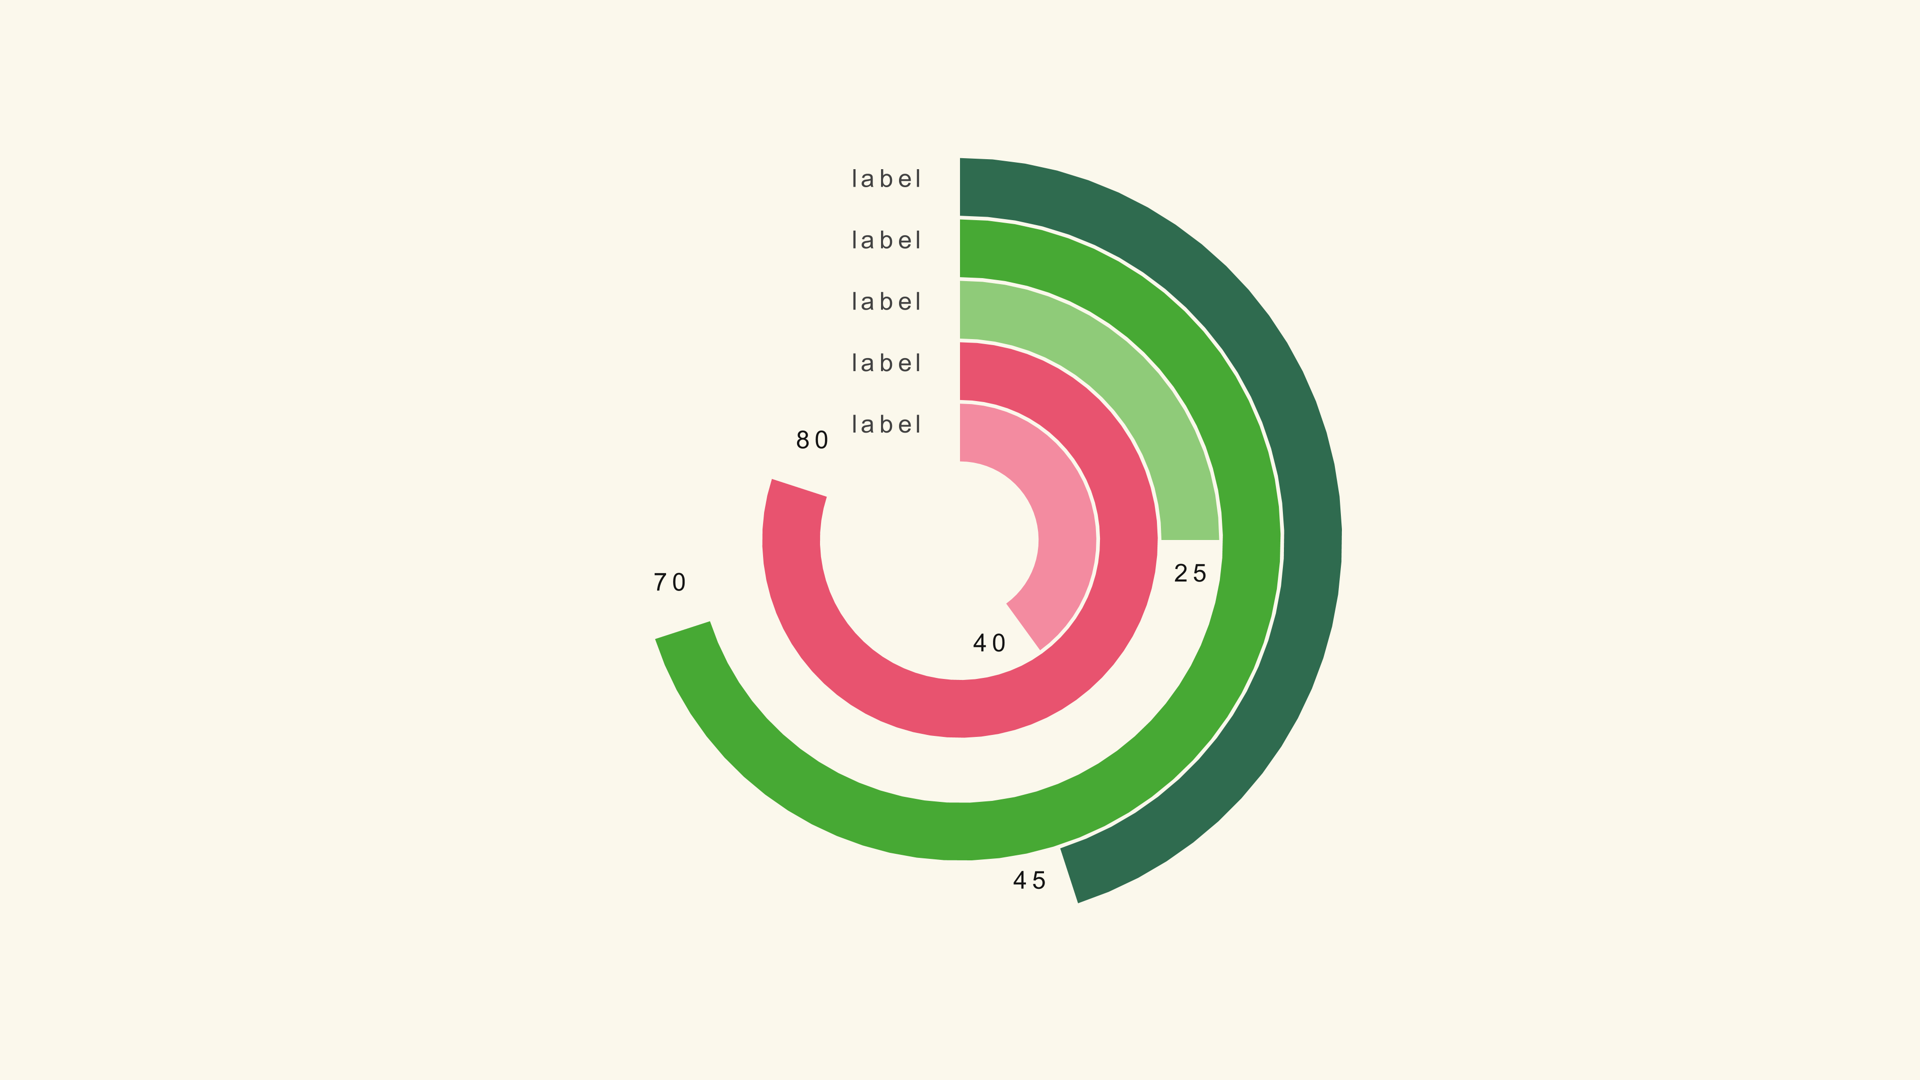
Semicircle mode restricts the ring to a half-circle, which turns the donut into a gauge. That is useful for a single target or progress value: the filled arc shows how far the metric has traveled, and the center holds the number.
For a multi-ring gauge, use the Ring Gauge generator instead. Pie Donut is the simpler choice when one ring tells the story.
Labels and legend
Turn Show Legend on when the ring has several segments. If the center already carries the main number, the legend can stay quiet. Avoid showing both a legend and a full set of labels unless the frame has room for both.
Keep the label colors distinct from the center text. The ring and the center are separate reading zones; they should not compete for the same contrast.
Animate the ring
A sweep reveal follows the circular geometry. A one-second sweep with a short stagger is a reliable default. If the ring is a KPI, a single sweep without stagger is calmer and easier to read.
Check the final frame with the center text in place. The ring should be closed, the labels should fit and the center should not overlap the ring.
Donut vs. pie and gauge
Use a pie chart when the solid shape is the clearest. Use a ring gauge when the story is progress toward a target. Use a bar chart when exact comparison matters more than share.
Common mistakes
- An empty center. The donut looks like a pie with a hole for no reason.
- Too many slices. The ring becomes a color wheel.
- Center text that competes with the legend. The viewer does not know where to look.
- A ring that is too thin for the frame. The share becomes hard to judge.
- Animating the center and the ring at the same time. The reveal loses its reading order.
Next steps
Load the donut sample and add a center KPI with Text+. Then read the Pie Donut guide and the Ring Gauge guide for the gauge workflow.