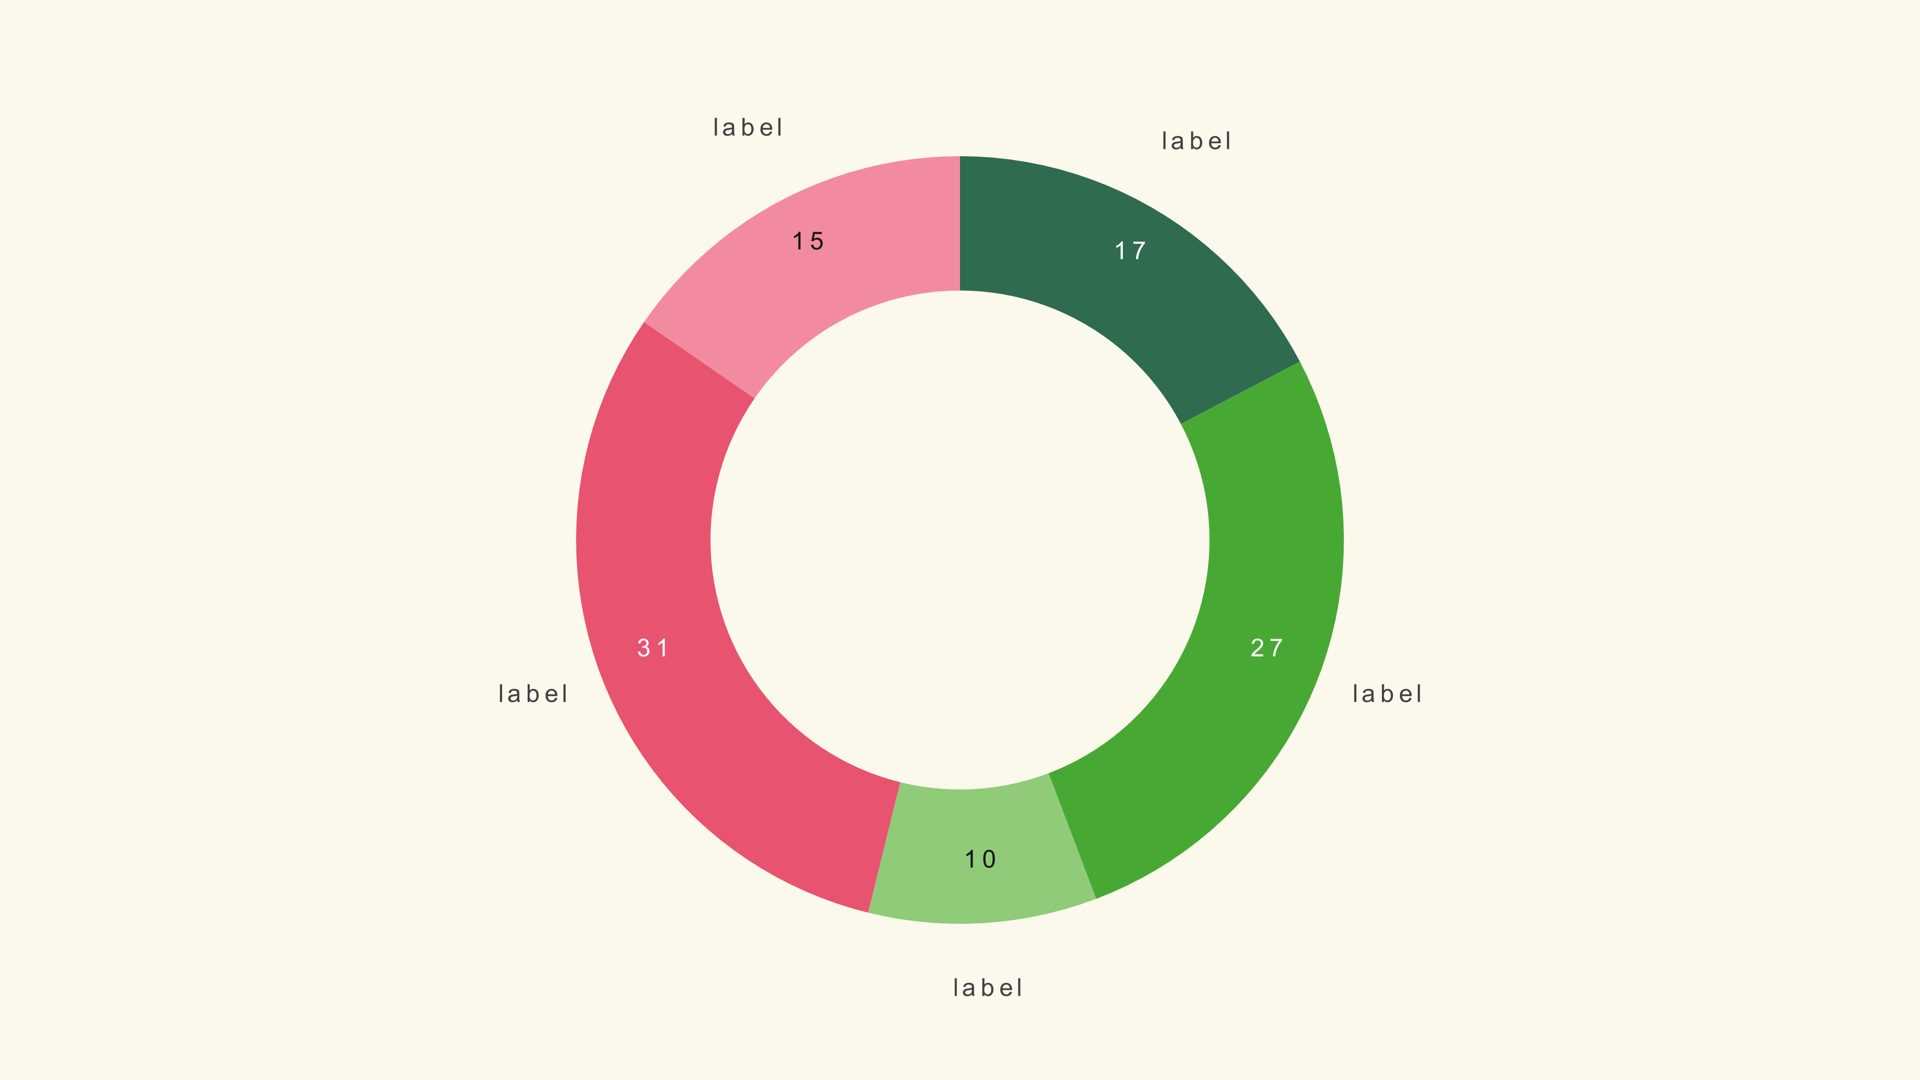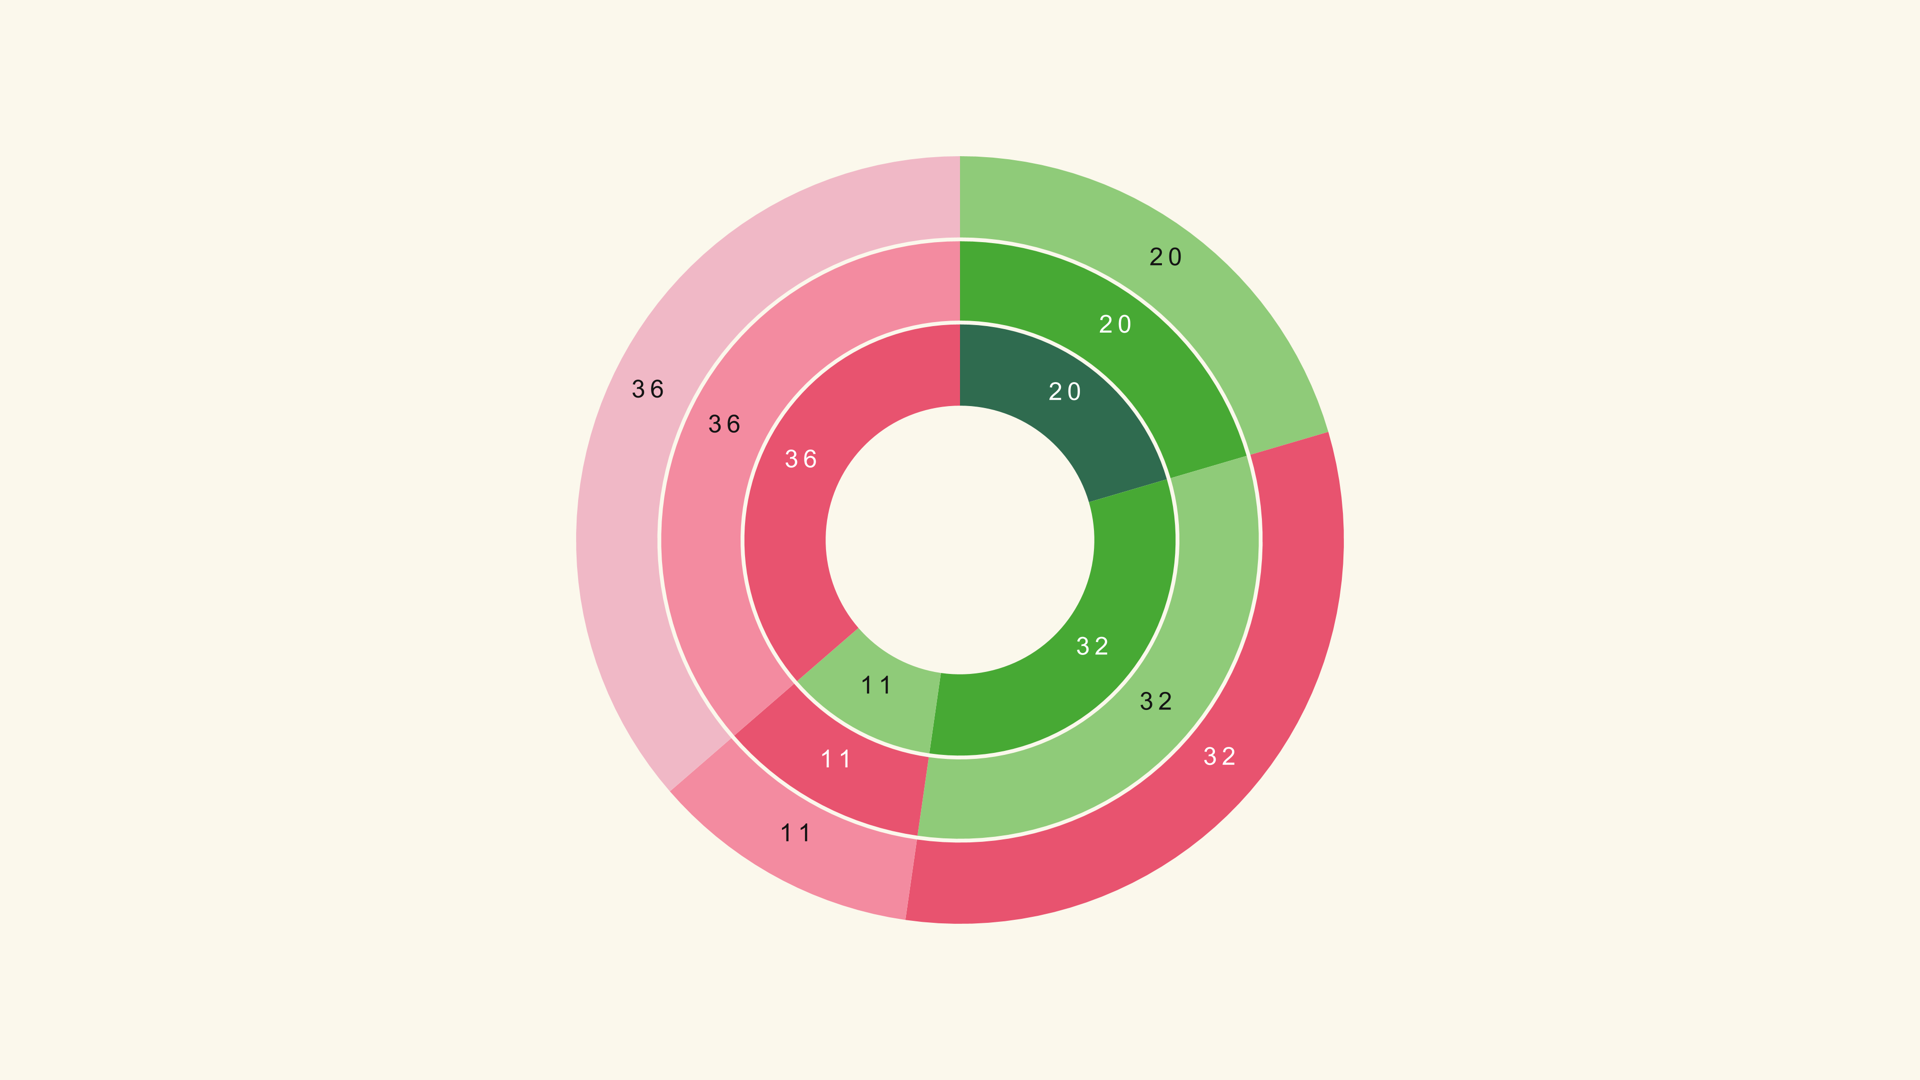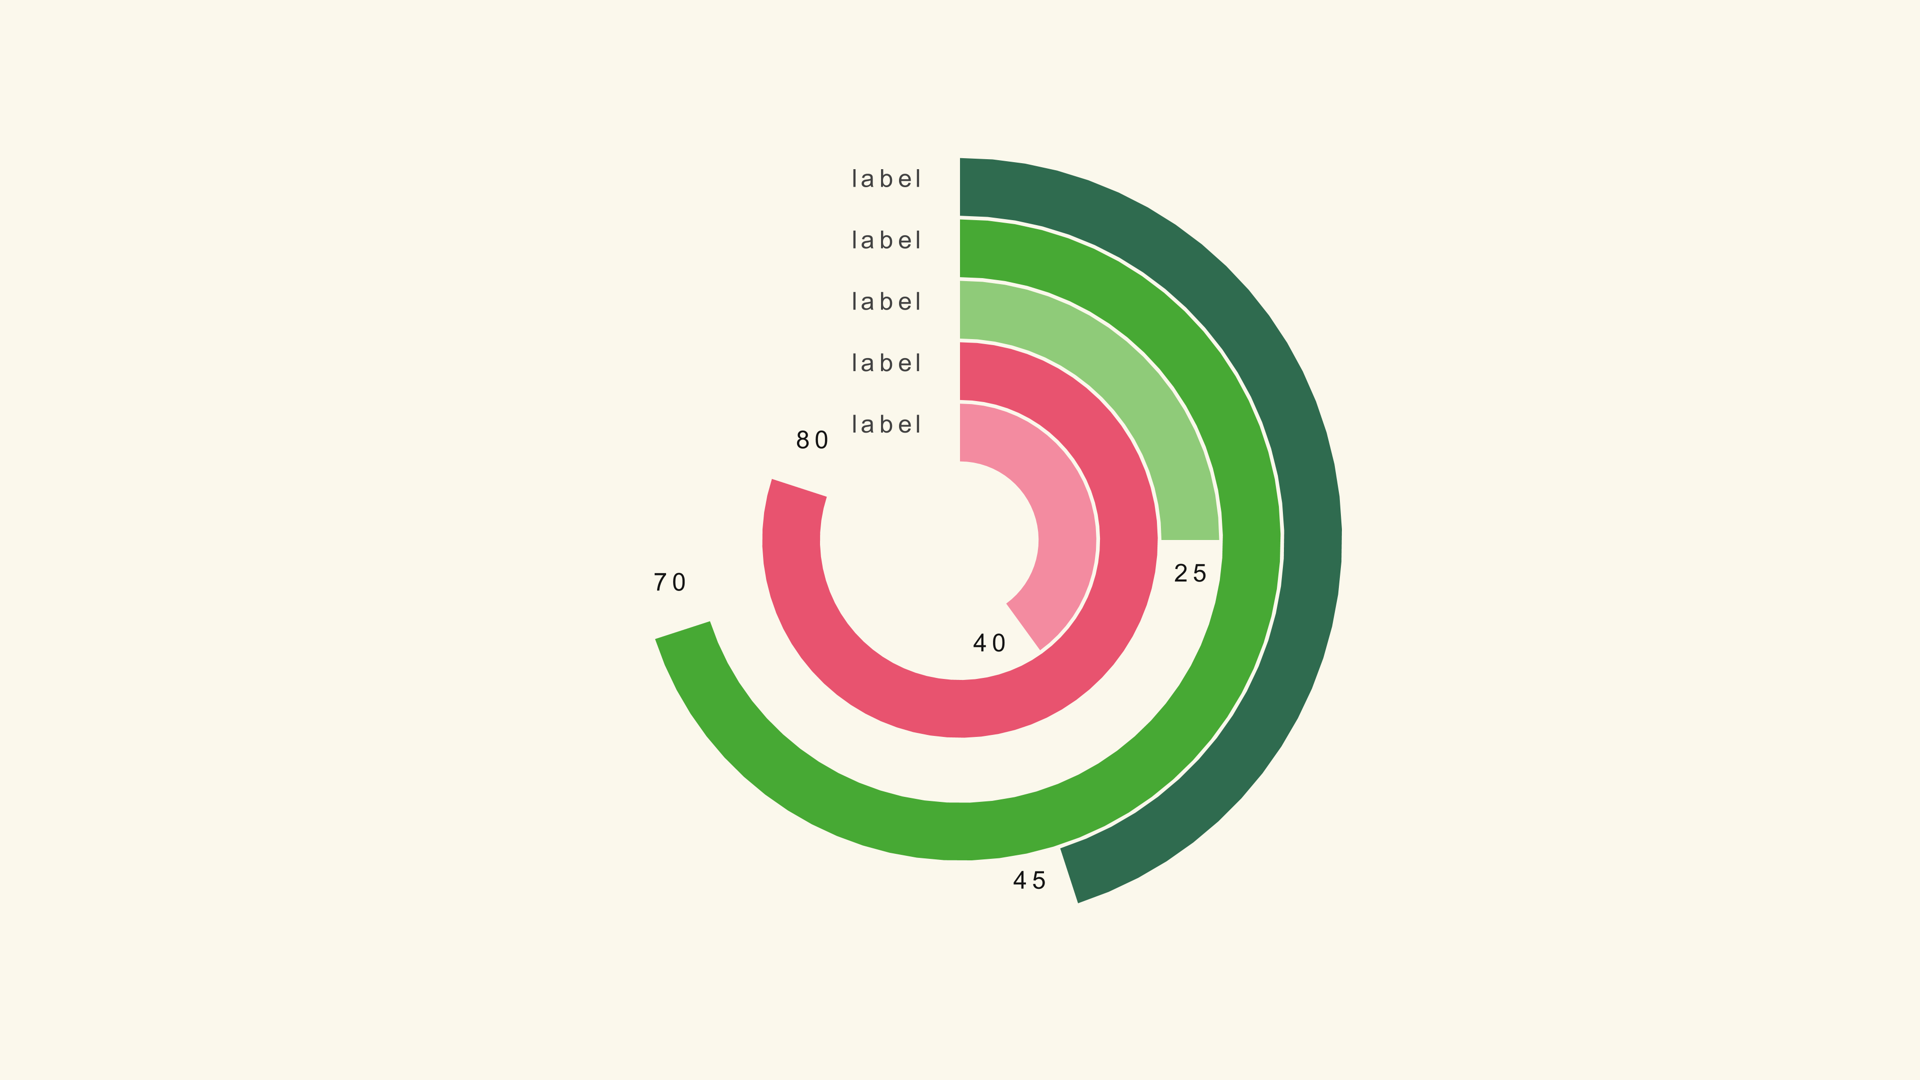
A gauge chart answers a narrow question: how close is this metric to the target? The filled arc gives the viewer a sense of progress before they read the number. That makes it a strong fit for KPIs, completion rates, budget use, capacity and any single value that has a meaningful maximum.
Ring Gauge is a native Fusion generator for DaVinci Resolve. It draws concentric arcs, supports multiple rings and exposes the gauge maximum, ring geometry, labels, legend and animation in the Inspector. This guide covers the data, the scale and the center composition.
When a gauge works
Use a gauge when there is a real maximum. "72 percent of the target" is a gauge story. "Five departments compared" is not; use a bar chart. The gauge is a progress graphic, and progress needs a destination.
Do not use a gauge for a value that can exceed the maximum unless the arc can show the overflow. A ring that stops at 100 percent and a value of 130 percent is misleading. If the metric can overshoot, use a bar chart or a progress bar with an explicit scale.
Prepare the values
Ring Gauge expects a label/value table. Each row becomes one ring. The values are measured against Gauge Max, not against the sum of the rows.
Metric,Value
Revenue,72
Pipeline,58
Support,84
Retention,91
If all the rings share the same maximum, set Gauge Max once. If the rings use different units, the chart is not comparable; use separate gauges or normalize the values first.
Load the rings
- Drag Ring Gauge from Effects - Generators - Noyris Charts onto a clip above your footage.
- Open Data and point CSV File at the table.
- Set Rings to the number of rows.
- Confirm the label and value columns.
- Set Gauge Max to the target value.
If a ring is full when the value is only half the target, Gauge Max is too low. If every ring looks almost empty, Gauge Max is too high.
Size the geometry
Pie Radius controls the outer size. Donut Hole controls the inner opening. Ring Width and Ring Gap control the thickness and spacing of the concentric arcs. A thick ring with a small gap reads as a solid KPI; a thin ring with a larger gap reads as a lighter dashboard.
Leave enough room in the center for the main number and enough room outside for the labels. If the labels collide with the ring, increase the radius or move the category labels to the legend.
Set Gauge Max
Gauge Max is the control that gives the arc meaning. For a percentage, 100 is usually correct. For a revenue target, use the target figure, not the largest actual value. For a capacity metric, use the capacity.
Keep Gauge Max fixed across a sequence. A gauge that fills to 80 percent in one shot and 40 percent in the next, with no scale change on screen, implies the second value is half the first even if the underlying numbers are different.
Labels and legend
Ring Gauge can place category labels outside the ring or in a legend. Pick one. Showing both makes the chart busier without adding information. Keep the value labels on if the exact number matters; turn them off when the arc is the story.
Put the main KPI in the center as a separate Text+ layer. The center should be the largest text in the graphic; the ring labels are supporting detail.
Animate the sweep
A sweep from twelve o'clock is the natural motion for a gauge. A short stagger between rings helps the viewer follow the order. Keep the animation brief and let the final arc settle before the voiceover moves on.
If the gauge is a progress graphic, the motion is part of the meaning: the arc travels from zero to the value. If the gauge is a static comparison, a fade may be calmer.
Gauge vs. donut and bar
Use a donut chart when the ring shows parts of a whole. Use a bar chart when several categories need an exact comparison. Use a gauge when one or a few metrics have a clear target.
Common mistakes
- No real maximum. The arc has no meaning.
- A Gauge Max below the actual value. The ring clips or lies.
- Different units on the same gauge. The rings are not comparable.
- Labels in two places. The chart gets busy for no reason.
- A center that competes with the ring. The KPI should be the clear focal point.
Next steps
Read the Ring Gauge guide for the full control list, then compare it with the donut workflow and the video chart design rules.