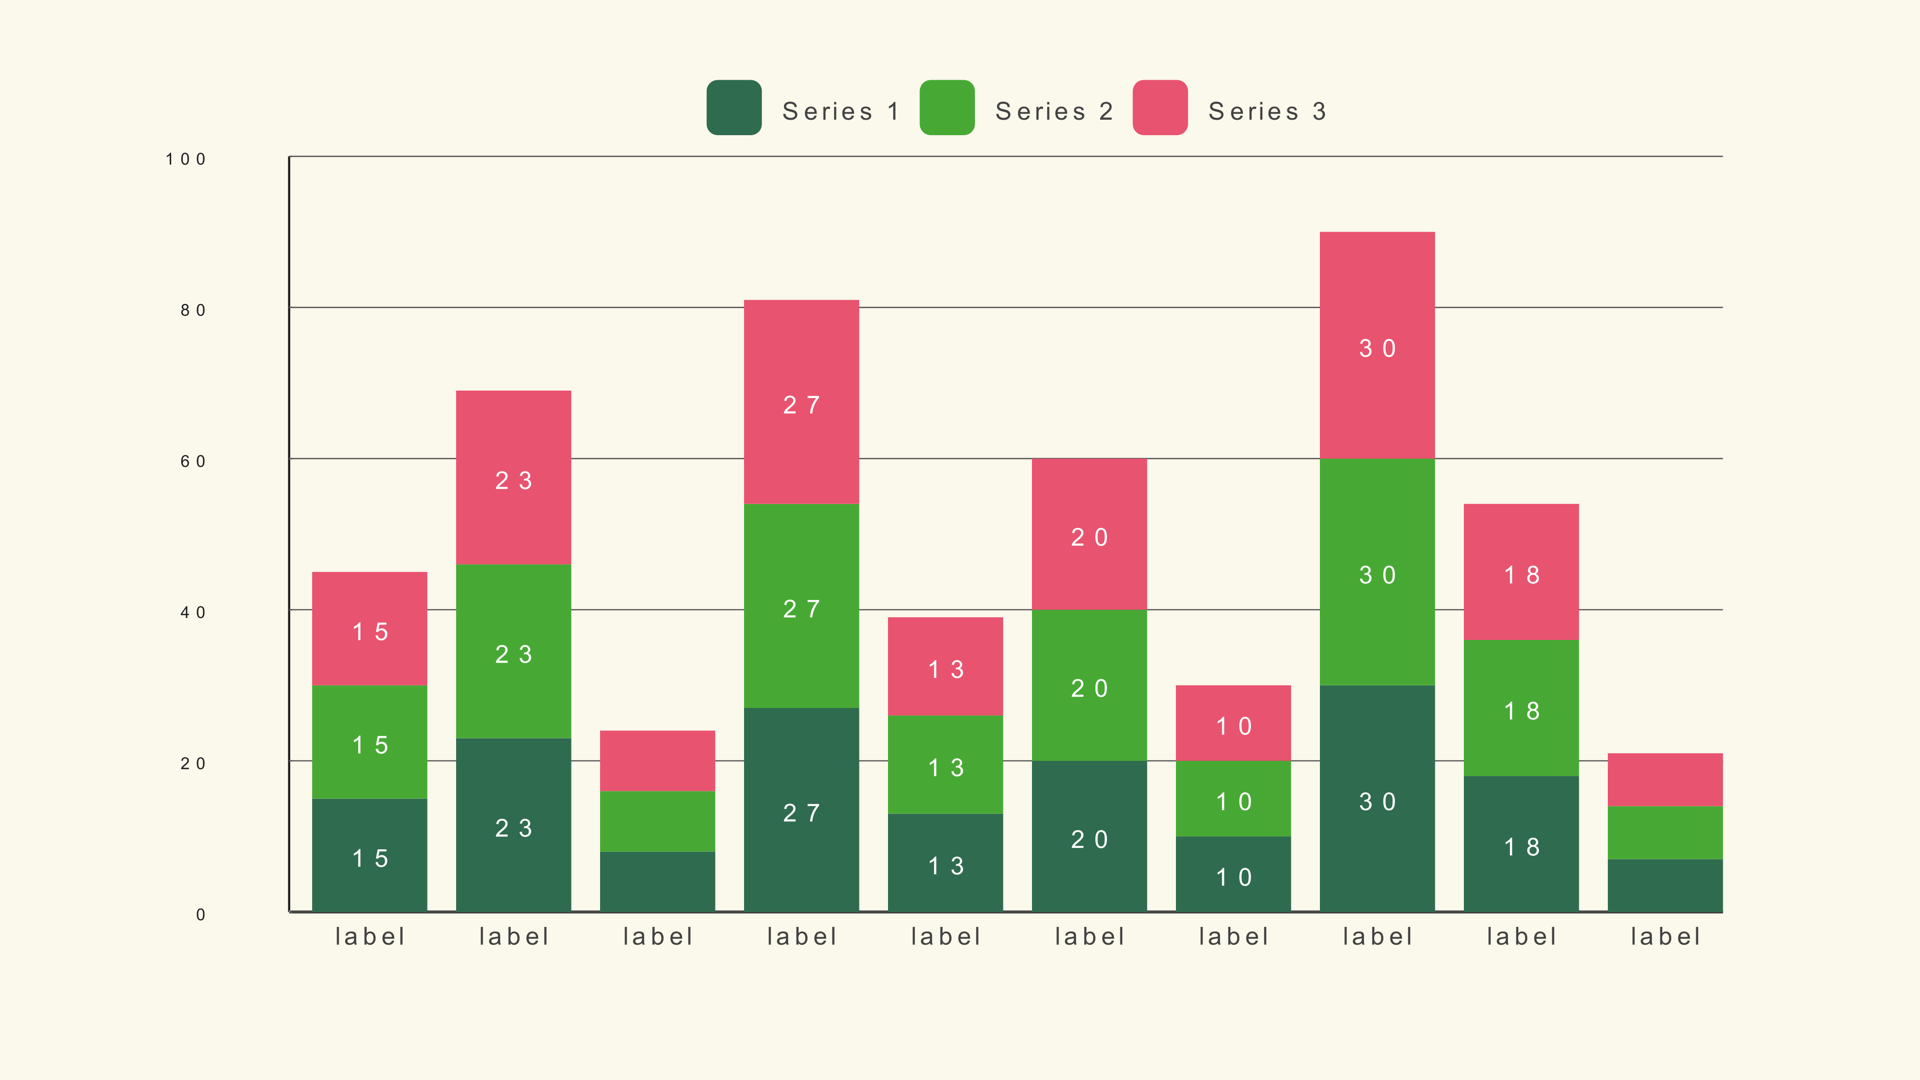
A bar chart is the fastest way to make a number legible on video. It works for revenue by product, audience by country, votes by candidate, output by month, or any comparison where the audience needs to see the gap between categories.
This walkthrough uses Bar Basic from Noyris Charts, a native Fusion generator that runs inside DaVinci Resolve Free and Studio. You do not need After Effects, a spreadsheet importer, or a node graph. You drag one generator onto a clip and edit it in the Inspector.
What you need
- DaVinci Resolve 18, 19, 20 or 21 - Free or Studio.
- The Noyris Charts pack installed in Fusion.
- A label/value table. You can type it in, or use a CSV.
- A timeline resolution that matches your delivery. The chart is vector geometry, so it stays sharp at 4K and above.
If the pack is not installed yet, the installation guide covers the one-drag installer and the manual install fallback.
Step 1 - Install the generator
Unzip the download and drag NoyrisCharts_Installer.lua onto the Fusion page. The installer copies all 41 generators, both generator libraries and the preview thumbnails into the right Fusion folders.
Quit Resolve completely with Cmd+Q on macOS or Ctrl+Q on Windows, then reopen it. Resolve scans Fuses and generators at startup, so the restart is the step that makes the new charts appear under Effects - Generators - Noyris Charts.
You can install the manual package instead if you prefer to place the files yourself. The documentation lists the exact folder layout for both methods.
Step 2 - Add Bar Basic to the timeline
Open the Edit page, put the playhead where the chart should appear, and drag Bar Basic from Effects - Generators - Noyris Charts onto a clip above your footage. Generators are normal timeline clips in Resolve, so you can trim them, move them, stack them and apply transitions like any other clip.
Select the generator and open the Inspector. Bar Basic exposes four pages: Data, Layout, Style and Animation. The full control list is documented on the Bar Basic guide.
Step 3 - Enter data or load a CSV
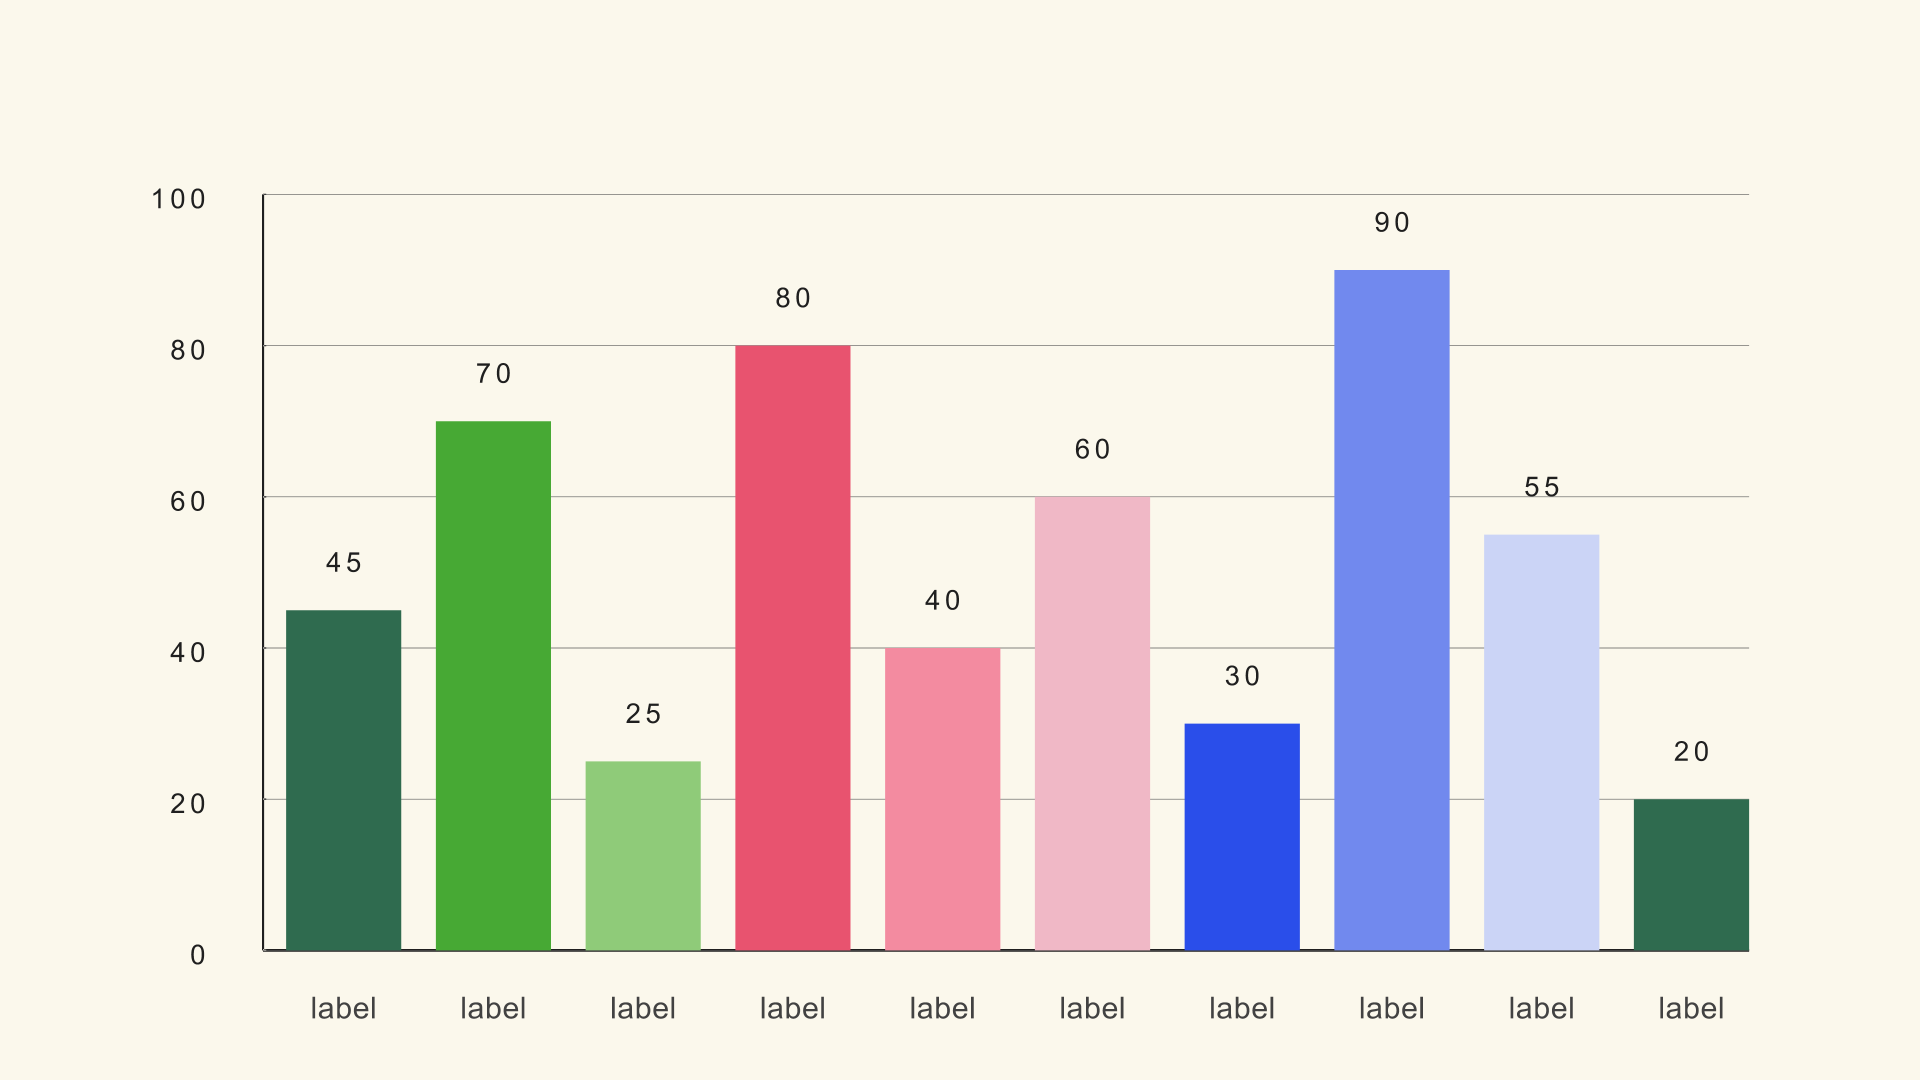
You have two ways to fill the chart. For a quick graphic, type values into the Data page. For anything with more than a handful of categories, use a CSV.
Bar Basic expects a label column followed by a value column. The default column mapping is zero-based: Label Column 0 is the first column, and Value Column 1 is the second. If your file starts with a header row, turn Header Row First on before you load it.
Product,Revenue
Alpha,72
Beta,58
Gamma,91
Delta,44
Epsilon,83
Zeta,66
That is the exact shape used by the bar-basic.csv sample. If you want the full CSV walkthrough, including multi-series and race files, read How to Import CSV Data into DaVinci Resolve Charts.
Step 4 - Set the scale before you style anything
Chart Max is the control that decides what a full-height bar means. If the highest value in your data is 91 and Chart Max is 100, the tallest bar sits at 91 percent of the plot. If Chart Max is 200, every bar shrinks - and the chart looks flat for no reason.
Set Chart Max slightly above the highest value, then leave it alone while you tune the layout. For the sample above, 100 is a clean starting point. For percentages, 100 is usually correct. For values that live in a narrow band, such as 4.2 to 4.8, consider a line chart instead of a bar chart because a zero-based bar scale will flatten the differences.
| Control | Start with | Why |
|---|---|---|
| Chart Max | 100 | Matches the sample and keeps the scale readable. |
| Bars | 8-12 | Enough categories to compare without crowding the labels. |
| Bar Width | 0.06 | Leaves clear space between bars. |
| Show Value Labels | On | Lets the audience read exact figures without an axis. |
| Show Grid | On | Adds a light reference line without competing with the bars. |
Step 5 - Pick a theme and tune the bars
Noyris Charts ships with 204 color themes. Turn Apply Theme on and the chart inherits the theme canvas, accent and data palette. Turn it off when you need a specific brand color, then set colors per element.
Two layout rules matter more than the exact palette. First, keep the labels readable at the size the chart will appear on screen - if the labels need a magnifying glass, remove categories instead of shrinking the type. Second, keep the bar color and the background far enough apart in luminance that the chart survives video compression and phone screens.
If you are matching a client brand, set the theme first, then override the one or two elements that need a specific color. That keeps the rest of the chart consistent and saves you from hand-picking every bar.
Step 6 - Animate the reveal
Animation is off by default. Open the Animation page, switch Animate on, and set a Start time. For a 3-second bar reveal, try a duration around 1.0 second and a stagger around 0.04 to 0.08 seconds per bar.
The reveal is driven by timeline time, not by a separate render. Scrub the playhead to check the timing, then render the timeline as usual. If the animation feels rushed, lengthen the duration before you add more stagger - too much stagger makes a small chart feel slow.
For a bar chart that sits on screen for several seconds, a simple grow-in is usually enough. Save the more expressive motion for a bar race or a chart where the ranking changes over time.
Step 7 - Export from the Deliver page
Charts live on the timeline as ordinary generator clips, so there is no separate export step. Add the chart to your timeline, open the Deliver page, and render with the preset you would use for any other graphic.
For overlays, render a format that preserves alpha if your downstream edit needs transparency. For a finished video, a standard H.264 or ProRes render is fine. The chart is drawn at your timeline resolution, so set the timeline to 4K before rendering if the final deliverable is 4K.
Common mistakes
- Too many bars. A 30-bar chart can be accurate and still be unreadable on a phone. Group small categories into "Other" or use a horizontal bar chart with fewer rows.
- An accidental scale. Chart Max that is too high makes every bar look similar. Chart Max that is too low clips the data. Set it from the actual maximum.
- Labels doing too much. If the value labels are on, you may not need a dense grid. Pick one way for the audience to read the number.
- Using bars for a trend. Bars compare categories. If the story is change over time, a line chart usually reads faster.
- Styling before data. Lock the values and the scale first. A beautiful chart with the wrong baseline is still wrong.
Bar chart vs. other chart types
Use a bar chart when the audience needs to compare exact magnitudes across categories. Use a line chart when the story is direction over time. Use a stacked bar chart when each category contains several series and the total matters. Use a bar chart race when the ranking itself changes over time.
The chart reference lists all 41 generators by family, with the controls and sample data for each one.
Next steps
Download the sample CSV, load it into Bar Basic, and rebuild the chart once without looking at this page. Then try the stacked bar guide to see how multi-series data changes the layout.
If you want every chart, every control and the sample files in one pack, the documentation is the place to start.