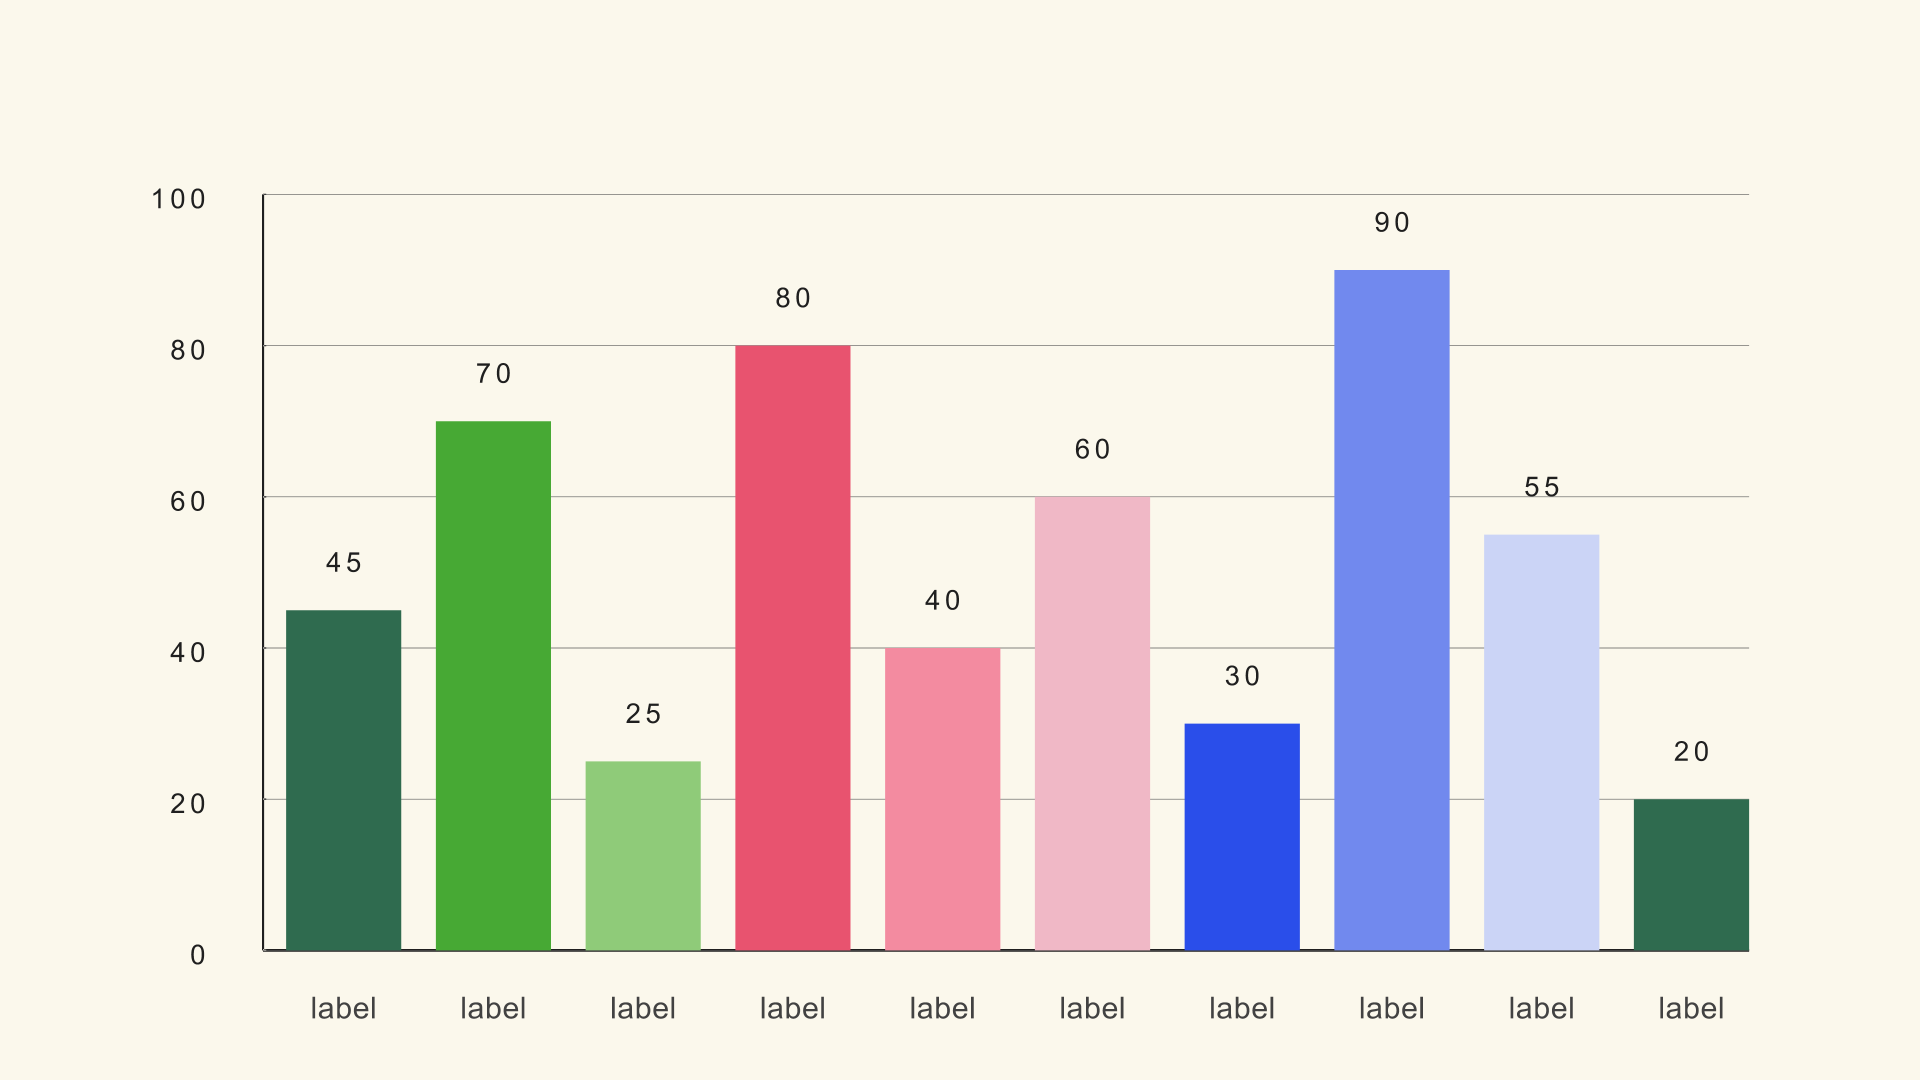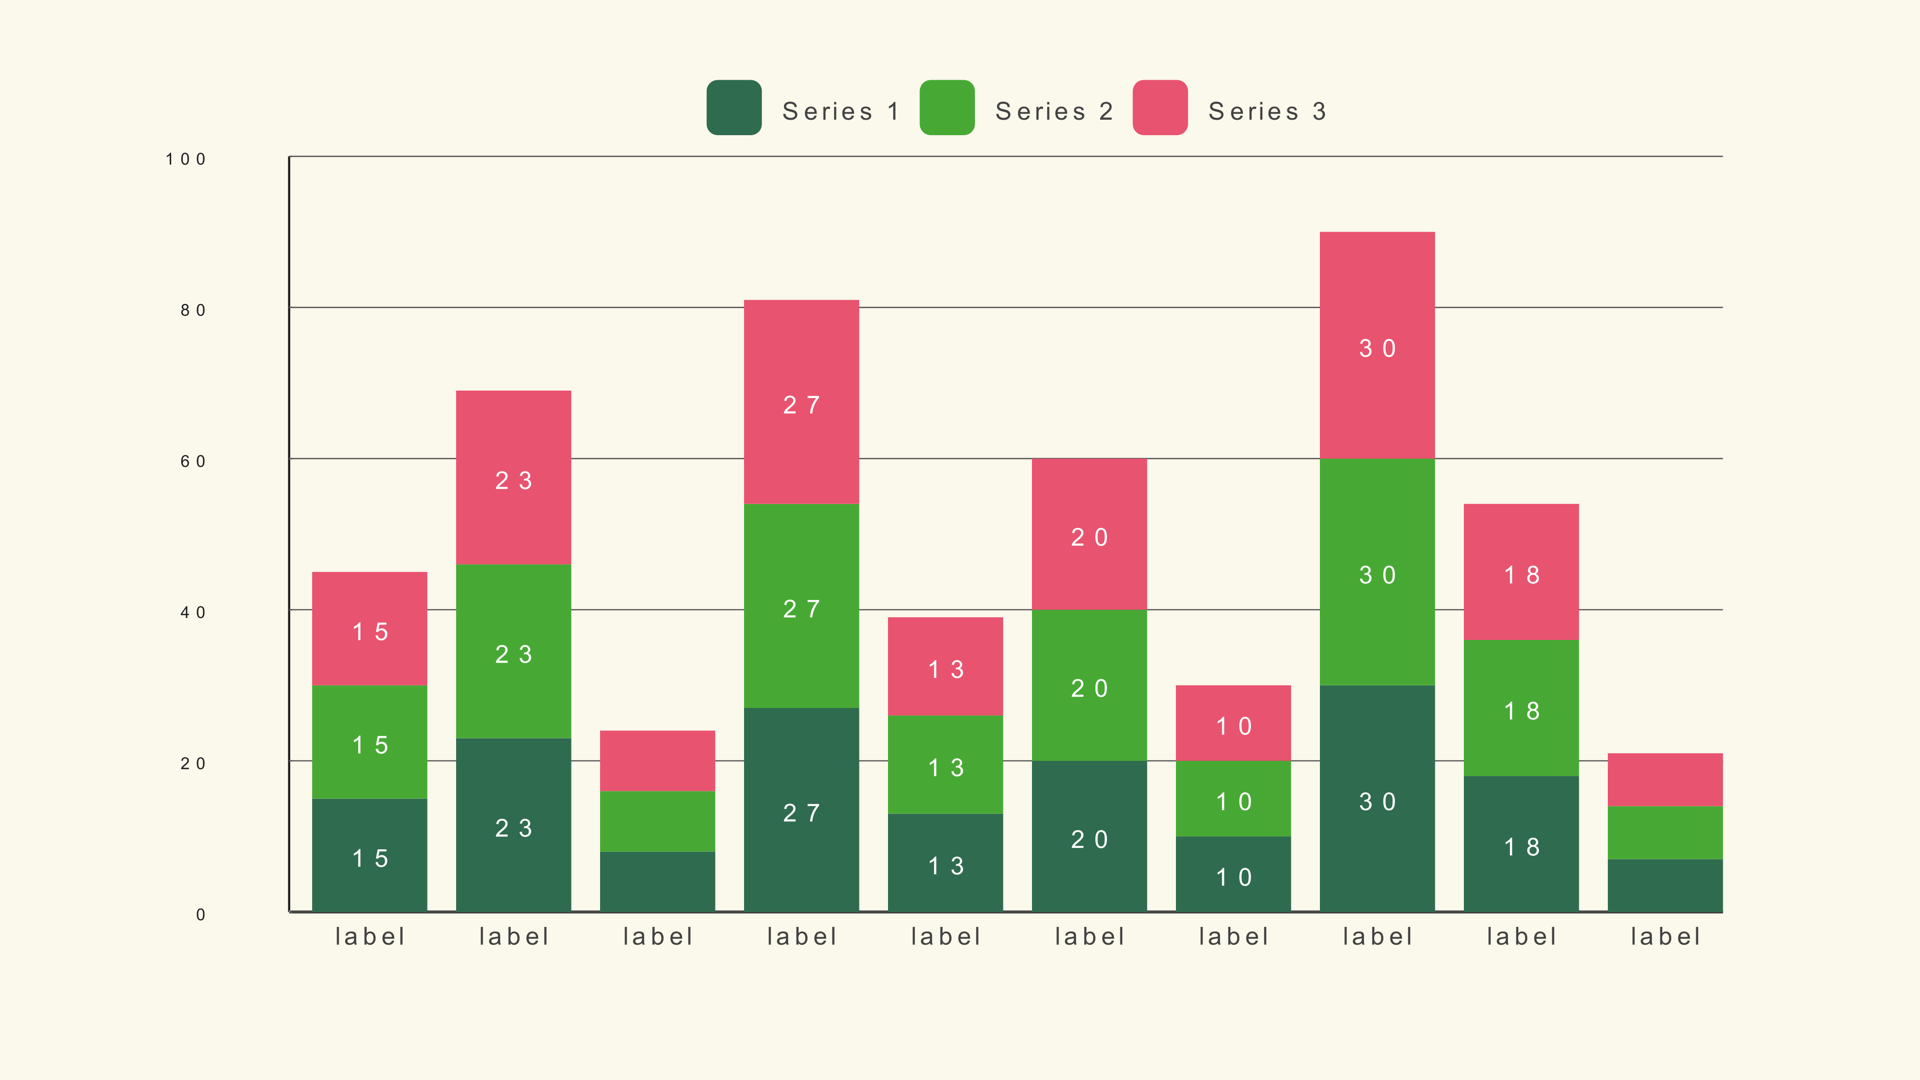
CSV is the bridge between a spreadsheet and a chart in DaVinci Resolve. Once the file is shaped correctly, a chart that would take twenty minutes to type by hand becomes a five-second import.
The hard part is not the import button. It is knowing which columns the generator expects, whether the first row is data or a header, and what to do when every bar comes in at the same height. This guide covers the shapes used by Noyris Charts and the fixes for the problems that come up most often.
What you need
- A CSV exported from a spreadsheet, database or text editor.
- A Noyris Charts generator on the timeline.
- The chart's Data page open in the Inspector.
- The sample files if you want a known-good starting point.
The chart reference links every generator and its sample file. You can also download the files directly from this guide.
The two CSV shapes
Most charts use one of two table shapes. Bar, line, pie, treemap and waterfall charts use the first. Bar race and some multi-series charts use the second.
Label/value tables
A label/value table has one text column and one or more numeric columns. The label names the category. The numbers drive the bars, slices or points.
Product,Revenue
Alpha,72
Beta,58
Gamma,91
Delta,44
Epsilon,83
Zeta,66
This is the shape used by bar-basic.csv, line-basic.csv, pie-basic.csv and treemap-basic.csv.
Multi-series tables
A multi-series table keeps the label column and adds one numeric column per series. For a stacked bar chart, each row is a category and each numeric column becomes one segment in the stack.
Region,Product,Service,Support
North,34,28,22
South,26,31,19
East,41,24,27
West,22,35,18
That is the shape used by bar-stacked.csv. The chart reads the label column first, then the series columns in order.
Wide timeline tables
A bar chart race needs a different shape: one label column, then one numeric column per time step. The first row is normally a header that names the years or months.
Series,2019,2020,2021,2022,2023,2024
Alpha,42,48,55,61,68,74
Beta,58,56,60,64,69,72
Gamma,35,39,44,50,57,65
Delta,66,63,58,54,49,45
Use bar-race.csv as the starting point. Bar Race defaults to Header Row First on, so the year names are treated as column names instead of data.
CSV rules that matter in the Inspector
| Rule | What to do |
|---|---|
| Column numbers are zero-based | The first column is 0, the second is 1, the third is 2. |
| Header rows are optional | Turn Header Row First on only when the first row contains column names. |
| Numbers are plain | Use 1200.50, not $1,200.50. Remove currency symbols, thousands separators and percent signs before import. |
| Blank rows break the rhythm | Delete empty rows and trailing commas before loading the file. |
| Use UTF-8 | Export CSV as UTF-8 so accented labels survive the round trip. |
| Keep one decimal style | Use a period for decimals. A comma is a column separator. |
If the file opens correctly in a spreadsheet but looks wrong in Resolve, check the column mapping first. Most import problems are a column number or a header-row setting, not a broken file.
Step-by-step: import a CSV into Bar Basic
- Download bar-basic.csv.
- Drag Bar Basic onto the timeline and select it.
- Open the Data page in the Inspector.
- Point CSV File at the downloaded file.
- Leave Header Row First off because the sample has no header.
- Confirm Label Column is 0 and Value Column is 1.
- Set Chart Max to 100 and Bars to the number of rows you want to show.
The sample has six rows, so set Bars to 6 for a one-to-one match. If you leave Bars at the default and the chart looks empty, check that the CSV path is set and that the file still exists where you saved it.
Import multi-series data
For a stacked chart, load the file, set the label column to 0, and confirm that the series columns start at 1. Each additional numeric column becomes another segment. The Bar Stacked guide lists the exact recommended settings, including Chart Max and legend options.
If the stacks are in the wrong order, reorder the columns in the CSV rather than rebuilding the chart. The generator reads the columns from left to right.
Special CSV cases
Bar race
Use a wide timeline table with one label column and one column per time step. Turn Header Row First on when the first row contains years or months. Set Timeline Column to the step you want to inspect, then enable playback from the comp clock for a moving race.
The full workflow is in the Bar Race guide.
Candlestick charts
Candle Body expects open and close values. Candle Wick adds high and low. The column order is open, high, low, close for the wick version, and open, close for the body version. Use candle-body.csv or candle-wick.csv as the reference.
Scatter plots
Scatter Plot expects a label, a Y value and an X value. The sample file uses label, Y, X in that order. The chart maps the points into a bounded plot rectangle and keeps the markers at a fixed radius.
Sankey diagrams
Sankey is manual-only. It does not use a CSV file because each node needs a label, a flow value and a parent link. Build the nodes in the Inspector using the field table in the Sankey guide.
Common CSV problems and fixes
| Symptom | Likely cause | Fix |
|---|---|---|
| Every bar is the same height | The value column is pointing at a label column, or Chart Max is far too high. | Check the Value Column number and set Chart Max from the highest value. |
| The first category is a header name | Header Row First is off on a file with a header. | Turn Header Row First on before loading, or remove the header row. |
| Labels are missing | The label column is mapped to a numeric column. | Set Label Column to the text column, usually 0. |
| Only some series appear | The chart expects more series than the CSV contains, or an extra column shifted the mapping. | Match the series count to the file and remove empty columns. |
| Decimals look wrong | The file uses commas as decimal separators. | Export a period-decimal CSV or replace the commas before import. |
| The chart is blank | The file path changed, or the first row was treated as data and failed. | Reload the file and check the header setting. |
Clean the data before you import
Spend two minutes on the spreadsheet before you touch Resolve. Remove merged cells, delete empty rows, put one value in each cell and keep the first row either completely data or completely headers. Export a fresh CSV rather than renaming an Excel file to .csv.
For labels, write the words you want on screen. "Q1 FY26" is a better label than "2026-01-01 to 2026-03-31" when the chart is the size of a lower third. For values, keep the units out of the cell and mention them in the chart title or a caption.
Sample files worth keeping
These files match the launch chart guides and are safe to load while you learn the controls:
- bar-basic.csv - label/value bar data.
- bar-stacked.csv - three series per category.
- bar-race.csv - wide timeline data with a header row.
- candle-body.csv - open and close values.
- candle-wick.csv - open, high, low and close values.
- scatter-plot.csv - label, Y and X values.
- waterfall.csv - label, delta and total marker.
The remaining sample files are linked from each chart guide in the chart reference.
Next steps
Once the data loads cleanly, the rest is layout and motion. Read How to Make a Bar Chart in DaVinci Resolve for the full styling and animation workflow, or open the Bar Stacked guide to work with multiple series.
If you want the exact generators used in these examples, the full pack is documented in the Noyris Charts documentation.