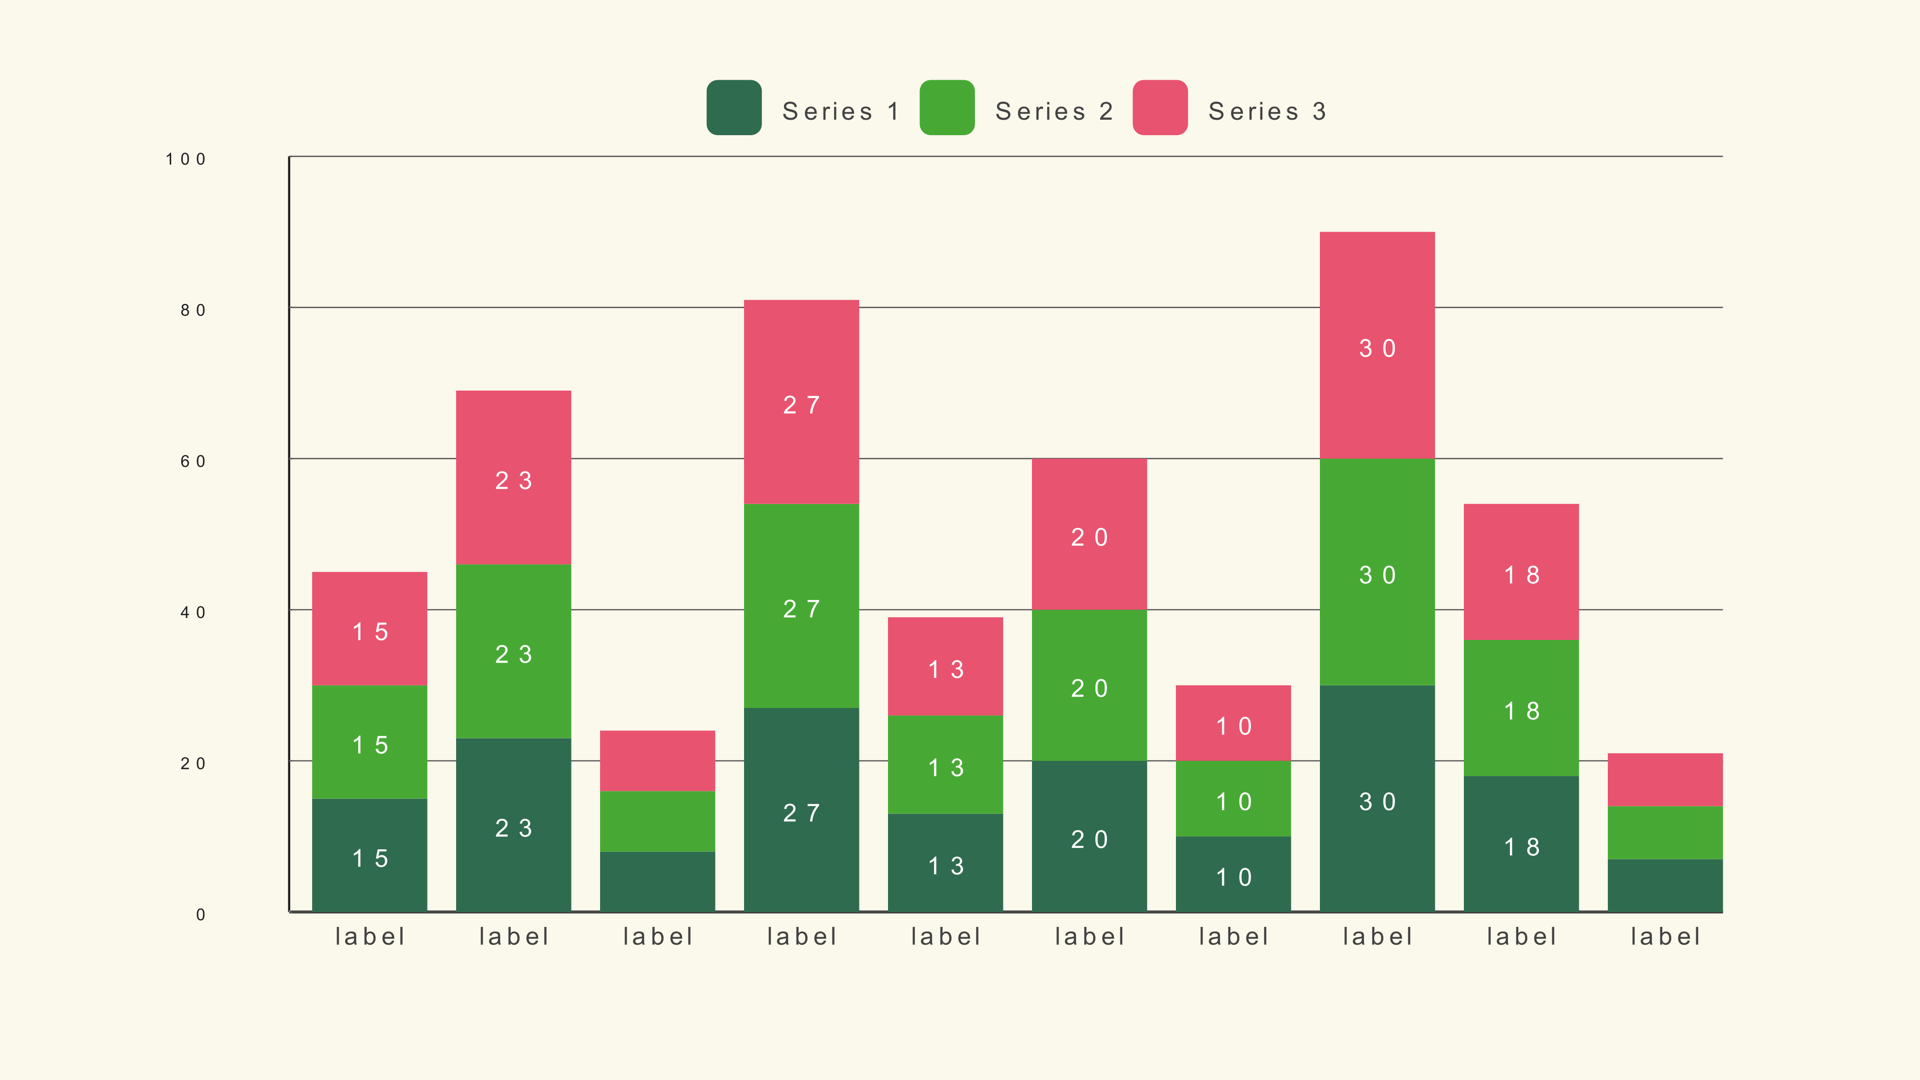
A stacked bar chart does two jobs at once. The full height of each bar shows a total, while the colored segments show how that total is divided. That makes it useful when the audience needs to compare overall size and composition in the same glance: revenue by quarter and product line, cost by department and category, audience by region and channel.
Bar Stacked is a native Fusion generator for DaVinci Resolve. It reads a multi-column CSV, draws up to 50 stacked bars and supports up to five series. This guide covers the data shape, the controls, the scale rule and the design decisions that keep a stack from turning into a color puzzle.
When stacked bars work
Use stacked bars when each category has the same set of components and the total matters. The chart is especially good when one bar is much larger than another and the viewer needs to see both the size gap and the mix behind it.
Stacked bars are less effective when the audience needs to compare individual segments across categories. The middle segments do not share a common baseline, so small differences are hard to read. If the story is "Product A grew faster than Product B," a grouped bar or a line chart is usually clearer.
Prepare the multi-column CSV
The CSV starts with a label column, followed by one numeric column per series. Each row is one stacked bar. Keep the columns in the same order you want the segments to appear.
Quarter,Product,Service,Support
Q1,34,28,22
Q2,38,30,24
Q3,41,32,25
Q4,45,35,27
The sample file is bar-stacked.csv. Leave Header Row First off if the first row is data. Turn it on when the first row contains series names. The full import rules are in How to Import CSV Data into DaVinci Resolve Charts.
Add Bar Stacked and load the data
- Drag Bar Stacked from Effects - Generators - Noyris Charts onto a clip above your footage.
- Open the Data page and point CSV File at the file.
- Set Bars to the number of rows.
- Confirm the label column and the first series column.
- Set the series count to match the number of numeric columns you want to show.
If a stack is missing a segment, the series count is probably lower than the number of columns in the file. If the colors repeat unexpectedly, check the series order and the per-series color overrides.
Set the series and names
Bar Stacked supports up to five series. Fewer series usually read better on video, especially when the chart is small. Name each series in the Inspector so the legend uses words instead of "Series 1" and "Series 2."
Keep the series order consistent across a sequence of charts. If Product is green in the first chart, it should stay green in the second. The viewer learns the color code once; changing it forces them to relearn the chart every time.
Fix the scale
Chart Max sets the top of the scale. For stacked bars, it needs to be at least as large as the largest total, not the largest individual segment. If the tallest stack adds up to 100 and Chart Max is 40, the stack will clip. If Chart Max is 400, every bar will look short and the differences will disappear.
Set Chart Max from the maximum row total, round up to a clean number, and keep it fixed across a series. If the chart is showing shares rather than raw totals, make sure the CSV is normalized consistently or explain the units in the title.
Labels and legend
A stacked chart almost always needs a legend because the colors carry meaning. Turn Show Legend on and place it where it does not compete with the bars. If the segments are large enough, value labels can sit inside the stack; if they are small, use the legend and keep the values out of the way.
Keep the category labels horizontal unless the names are long. The CatOrientation control can turn them upright, but vertical labels are harder to read and take more space. Shorten the category names before you rotate them.
Animate the stack
Animate the bars in category order so the viewer can compare the totals. A grow-in from the baseline is the clearest style for a stacked bar. A staggered reveal across categories adds a sense of sequence without obscuring the composition.
If the segments are the story, consider a slight stagger within each stack as well as across the categories. Keep the total animation short; the viewer needs to see the full stack, not watch every segment arrive separately.
Stacked vs. grouped bars
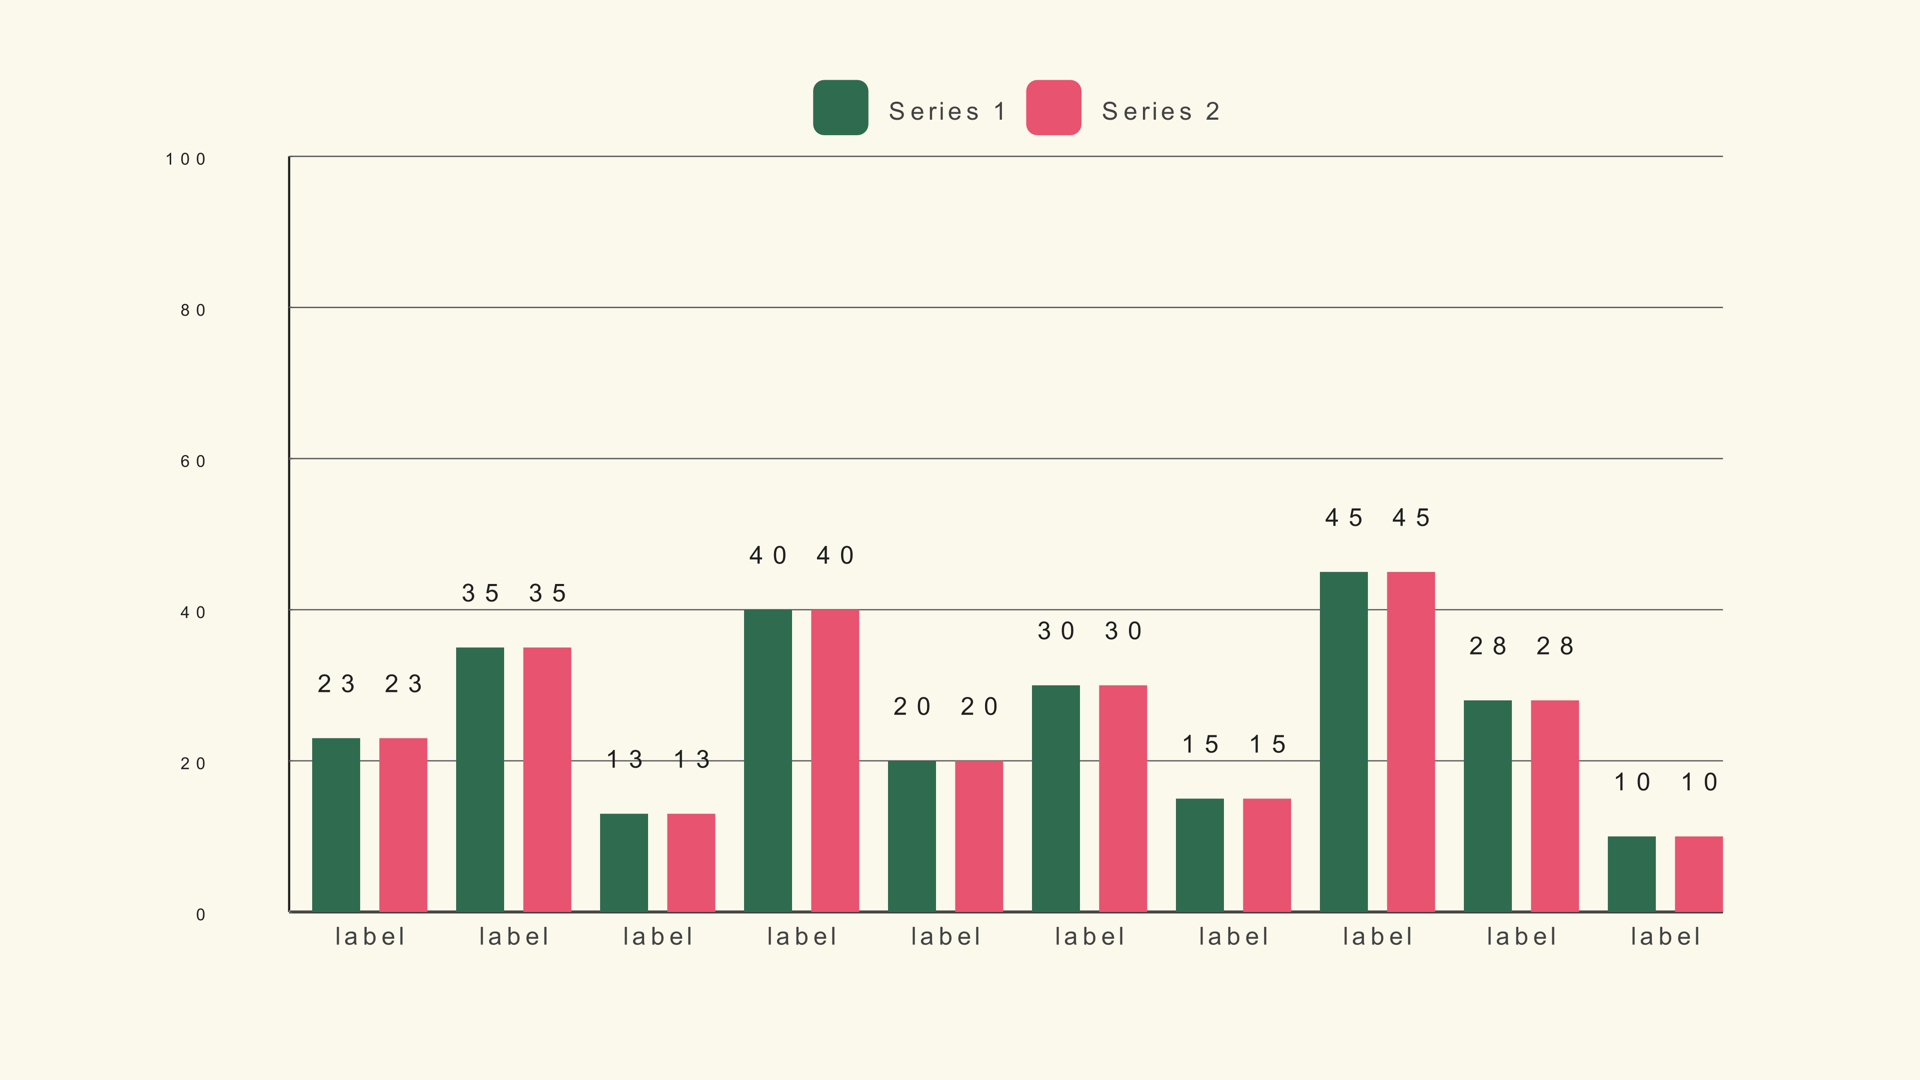
Use stacked bars when the total is the main comparison and the composition is secondary. Use grouped bars when each series needs its own baseline and the comparison between series matters more than the total. Use a waterfall when the story is a running total changing through a sequence of increases and decreases.
Common mistakes
- Chart Max set to a segment value. The tallest stack clips.
- Too many series. The legend becomes a color key nobody can remember.
- Comparing middle segments. Their baselines differ; use a grouped chart instead.
- Changing series colors between charts. The audience loses the code.
- Labels inside tiny segments. The text becomes unreadable noise.
Next steps
Load the stacked bar sample and rebuild it with three series. Then read the Bar Stacked guide for the full control reference and compare it with grouped bars.