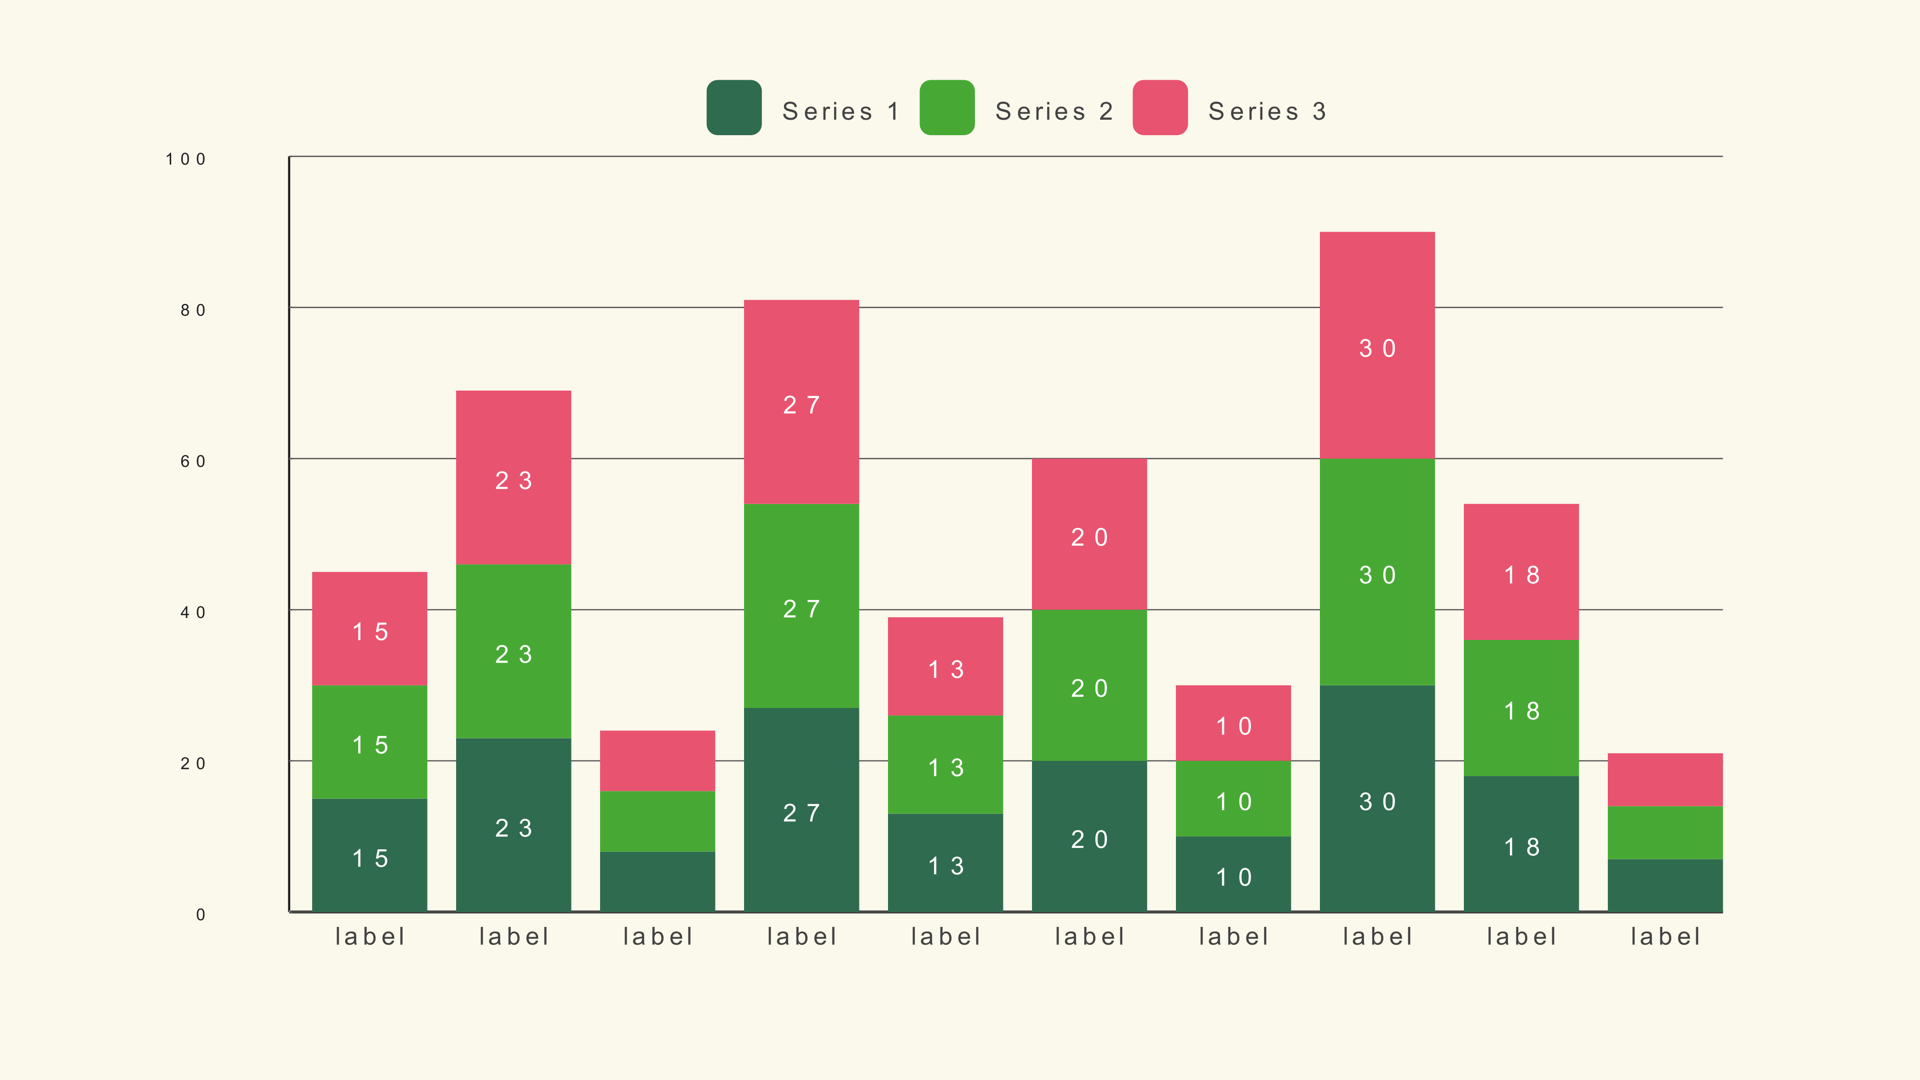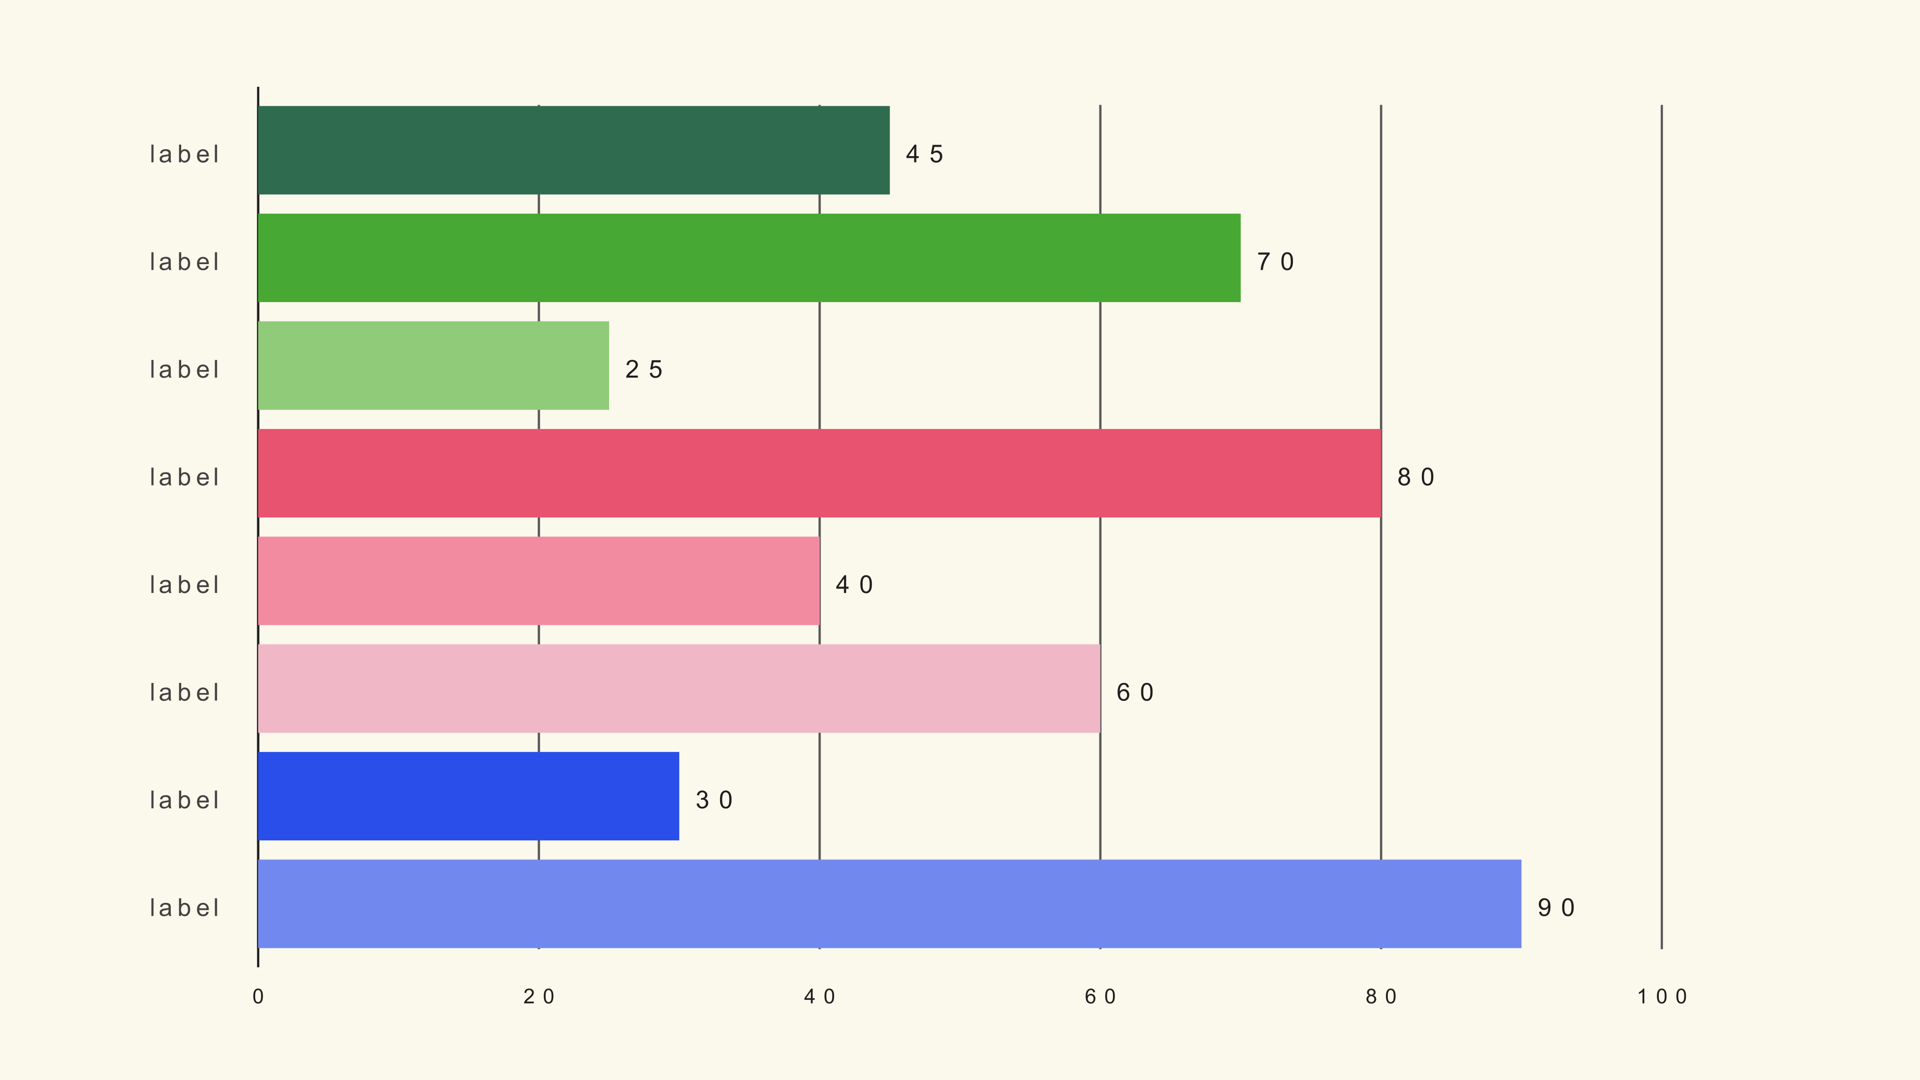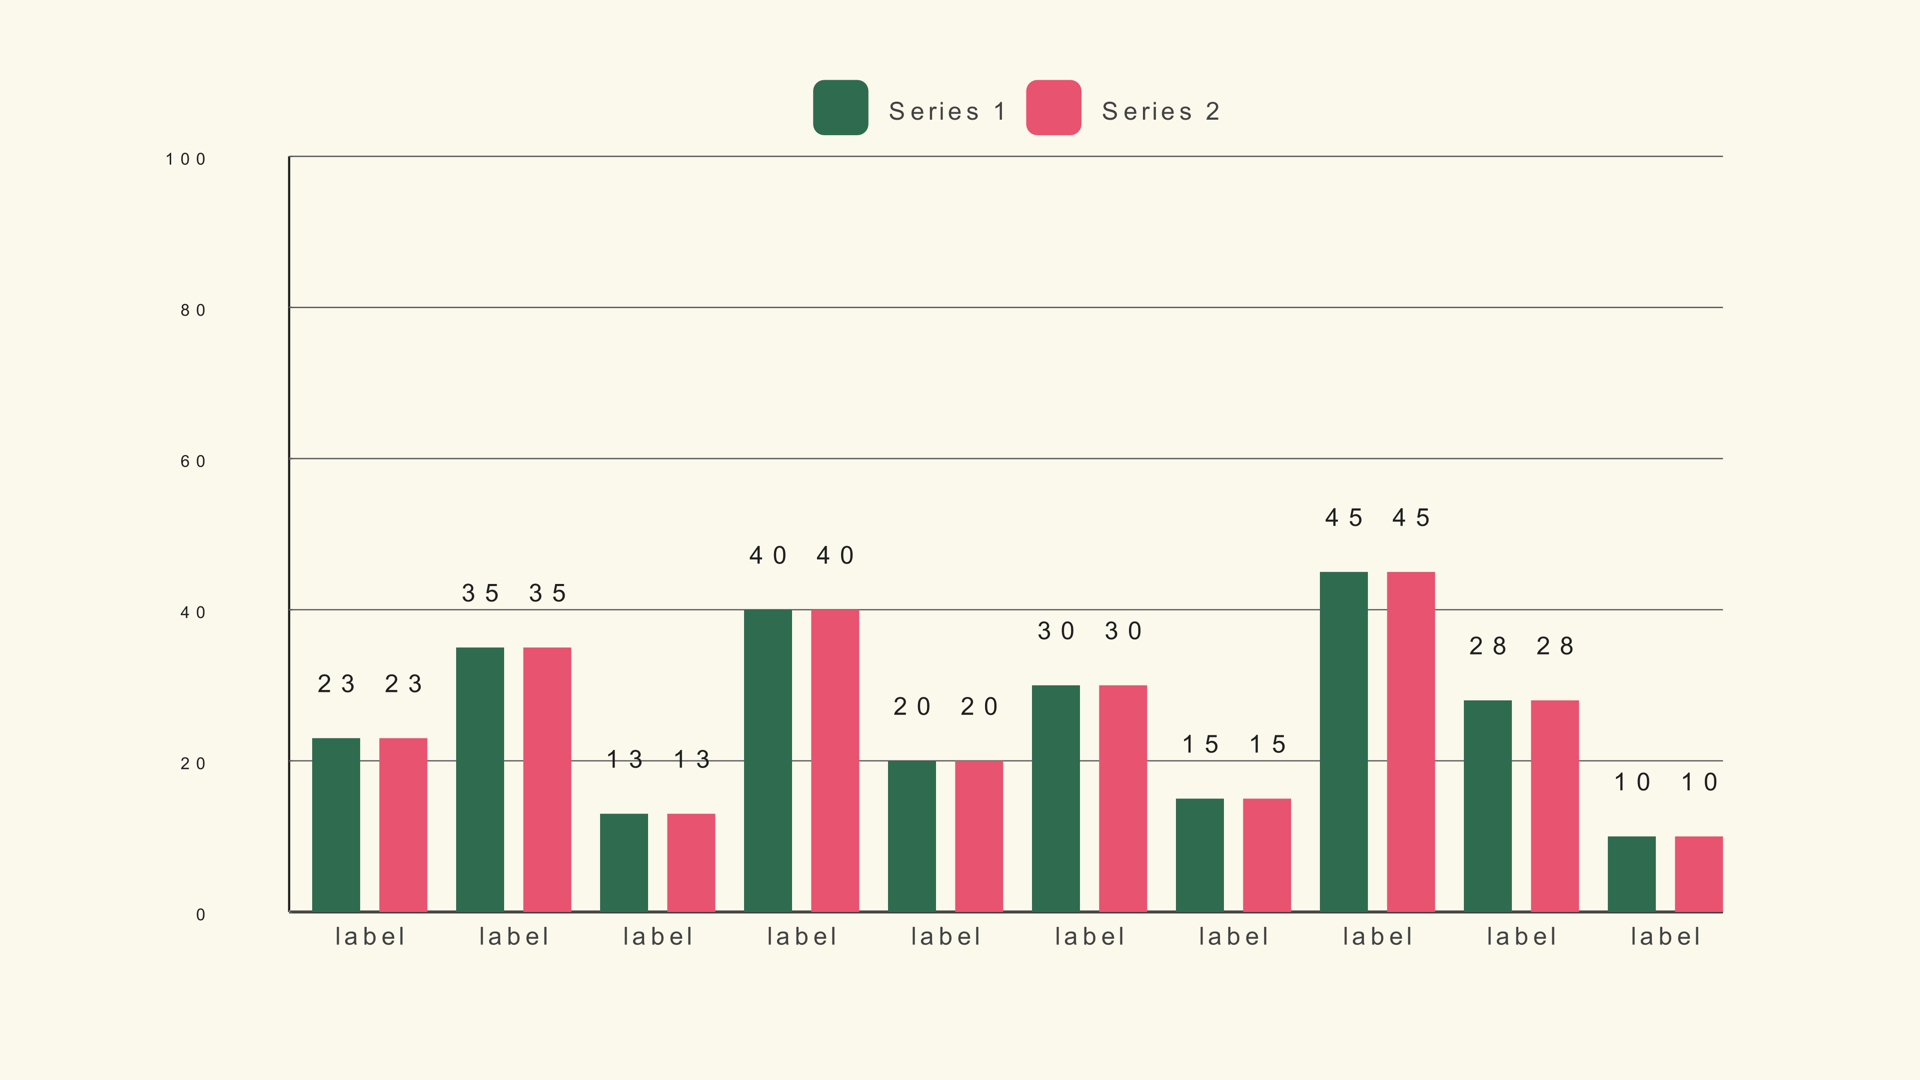
A grouped bar chart puts the series side by side inside each category. That gives every series its own baseline, so the viewer can compare Product A with Product B, or this year with last year, without the segments stacking on top of each other.
Bar Grouped is a native Fusion generator for DaVinci Resolve. It reads a multi-column CSV, draws up to five series per category and exposes the group spacing, colors, legend and animation in the Inspector. This guide covers the data shape and the controls that make the comparison readable.
When grouped bars work
Use grouped bars when the comparison between series is the story. If the audience needs to see which product grew faster, which region is ahead, or how this quarter compares with the same quarter last year, a grouped chart keeps the series adjacent and equally scaled.
Stacked bars are better when the total matters more than the individual series. A grouped chart does not show a total directly; the viewer has to add the bars mentally. If the headline is "total revenue," start with a stacked chart or a simple total bar instead.
Prepare the data
The CSV starts with a label column, followed by one numeric column per series. Each row is a category group. Keep the series columns in the order you want the bars to appear.
Region,Product,Service,Support
North,34,28,22
South,26,31,19
East,41,24,27
West,22,35,18
The sample shape is the same label/multi-series table used by stacked bars. If you already have a bar-stacked.csv file, you can load it into Bar Grouped to see how the same data changes when the segments sit side by side.
Add Bar Grouped and load the file
- Drag Bar Grouped from Effects - Generators - Noyris Charts onto a clip above your footage.
- Open the Data page and point CSV File at your table.
- Set Bars to the number of categories.
- Confirm the label column and the first series column.
- Set the series count to the number of numeric columns you want to compare.
If the groups contain the wrong number of bars, check the series count first. If the labels are shifted, check whether the first row was a header and whether Header Row First is set correctly.
Set the series names
Name each series in the Inspector so the legend reads like the source table. "Product," "Service" and "Support" are easier to follow than "Series 1," "Series 2" and "Series 3." Keep the names short enough to fit the legend at output size.
Use no more than three or four series in a video chart unless the frame is large and the chart has very few categories. Five series across twelve categories produces sixty bars, which is too much for a short graphic even when the geometry is correct.
Tune the group spacing
Two controls decide the rhythm. Bar Gap is the space between bars inside a group. Group Gap is the space between one category group and the next. The group gap should be visibly larger than the bar gap; otherwise the viewer cannot tell where one category ends and the next begins.
Start with the default bar width, increase the group gap until the categories separate, then adjust the overall chart size. If the labels collide, reduce the number of categories or rotate the labels before you shrink the type.
Fix the scale
Chart Max sets the height of a full bar. Use the largest value across all series, rounded up to a clean number. Unlike a stacked chart, the tallest bar is a single value, not a row total. If the chart is part of a sequence, keep Chart Max fixed so the bars remain comparable between shots.
Keep the baseline at zero for a bar chart. A truncated baseline exaggerates differences and is especially misleading when bars are placed side by side. If the differences are too small to see at a zero baseline, the chart may not be the right tool for that story.
Labels and legend
Turn on Show Legend so the series colors have names. Keep the category labels under the groups. Value labels can sit above each bar, but with three or four series the numbers can crowd the frame. If the exact values matter, consider a table or a simpler bar chart.
Use a palette with enough separation between the series. Adjacent bars make color contrast more important than in a single-series chart because the eye is switching between colors within a small area.
Animate the comparison
A grouped bar chart reads best when the bars grow together. If each bar in the group arrives at a different time, the viewer may read the group as a sequence rather than a comparison. Use a small stagger across categories, not within the group, or turn stagger off entirely.
Keep the reveal short. The point of the chart is the side-by-side comparison, so the motion should bring the whole group into view quickly and then hold. A one-second reveal is enough for most edits.
Grouped vs. stacked bars
Use grouped bars when each series needs its own baseline and the audience is comparing series. Use stacked bars when the total and composition matter. Use a line graph when the categories are time steps and the trend is continuous.
Common mistakes
- Too many series. The chart becomes a thicket of bars.
- No group gap. The categories blur together.
- A different baseline per group. Grouped bars need one shared scale.
- Animating each bar separately. It turns a comparison into a sequence.
- Using grouped bars for a total. The viewer cannot see the sum without adding.
Next steps
Load the multi-series sample into Bar Grouped and compare it with the stacked version. Then read the Bar Grouped guide for the full control list and the CSV guide for column mapping.