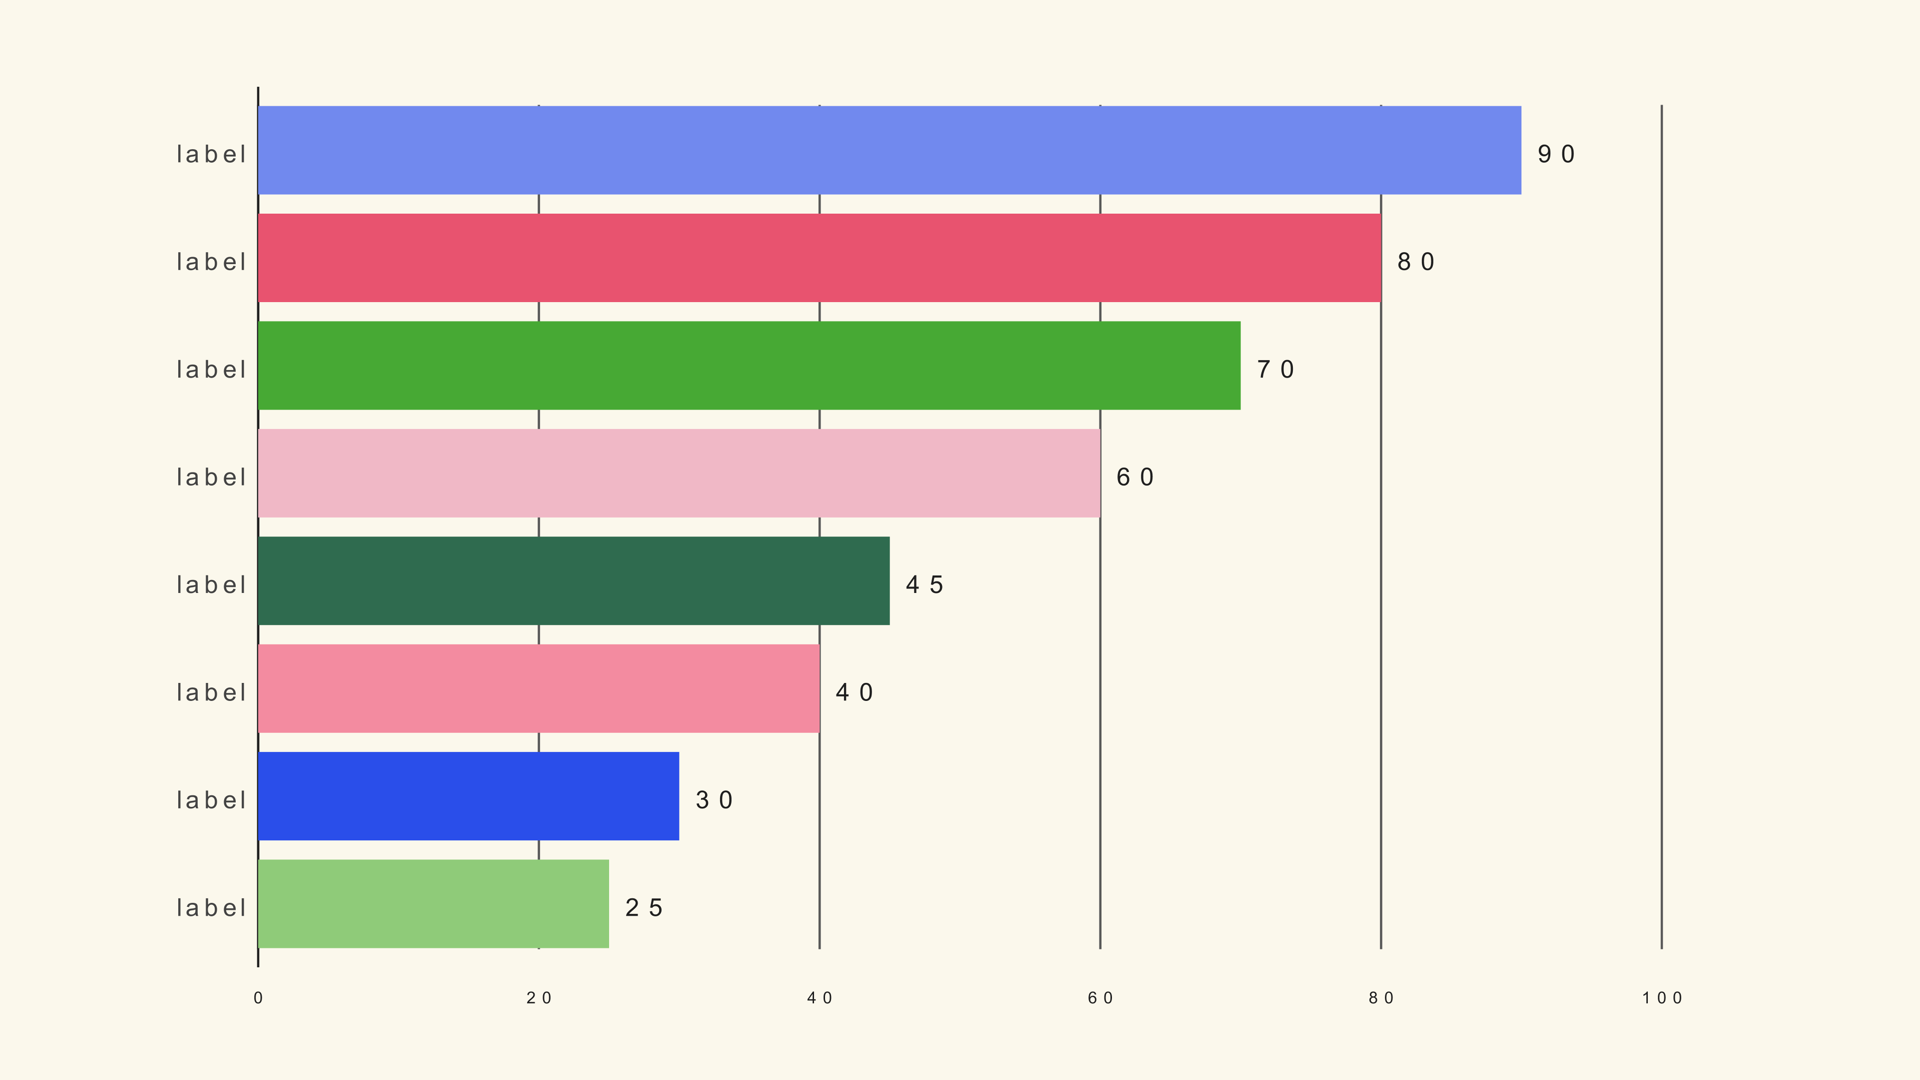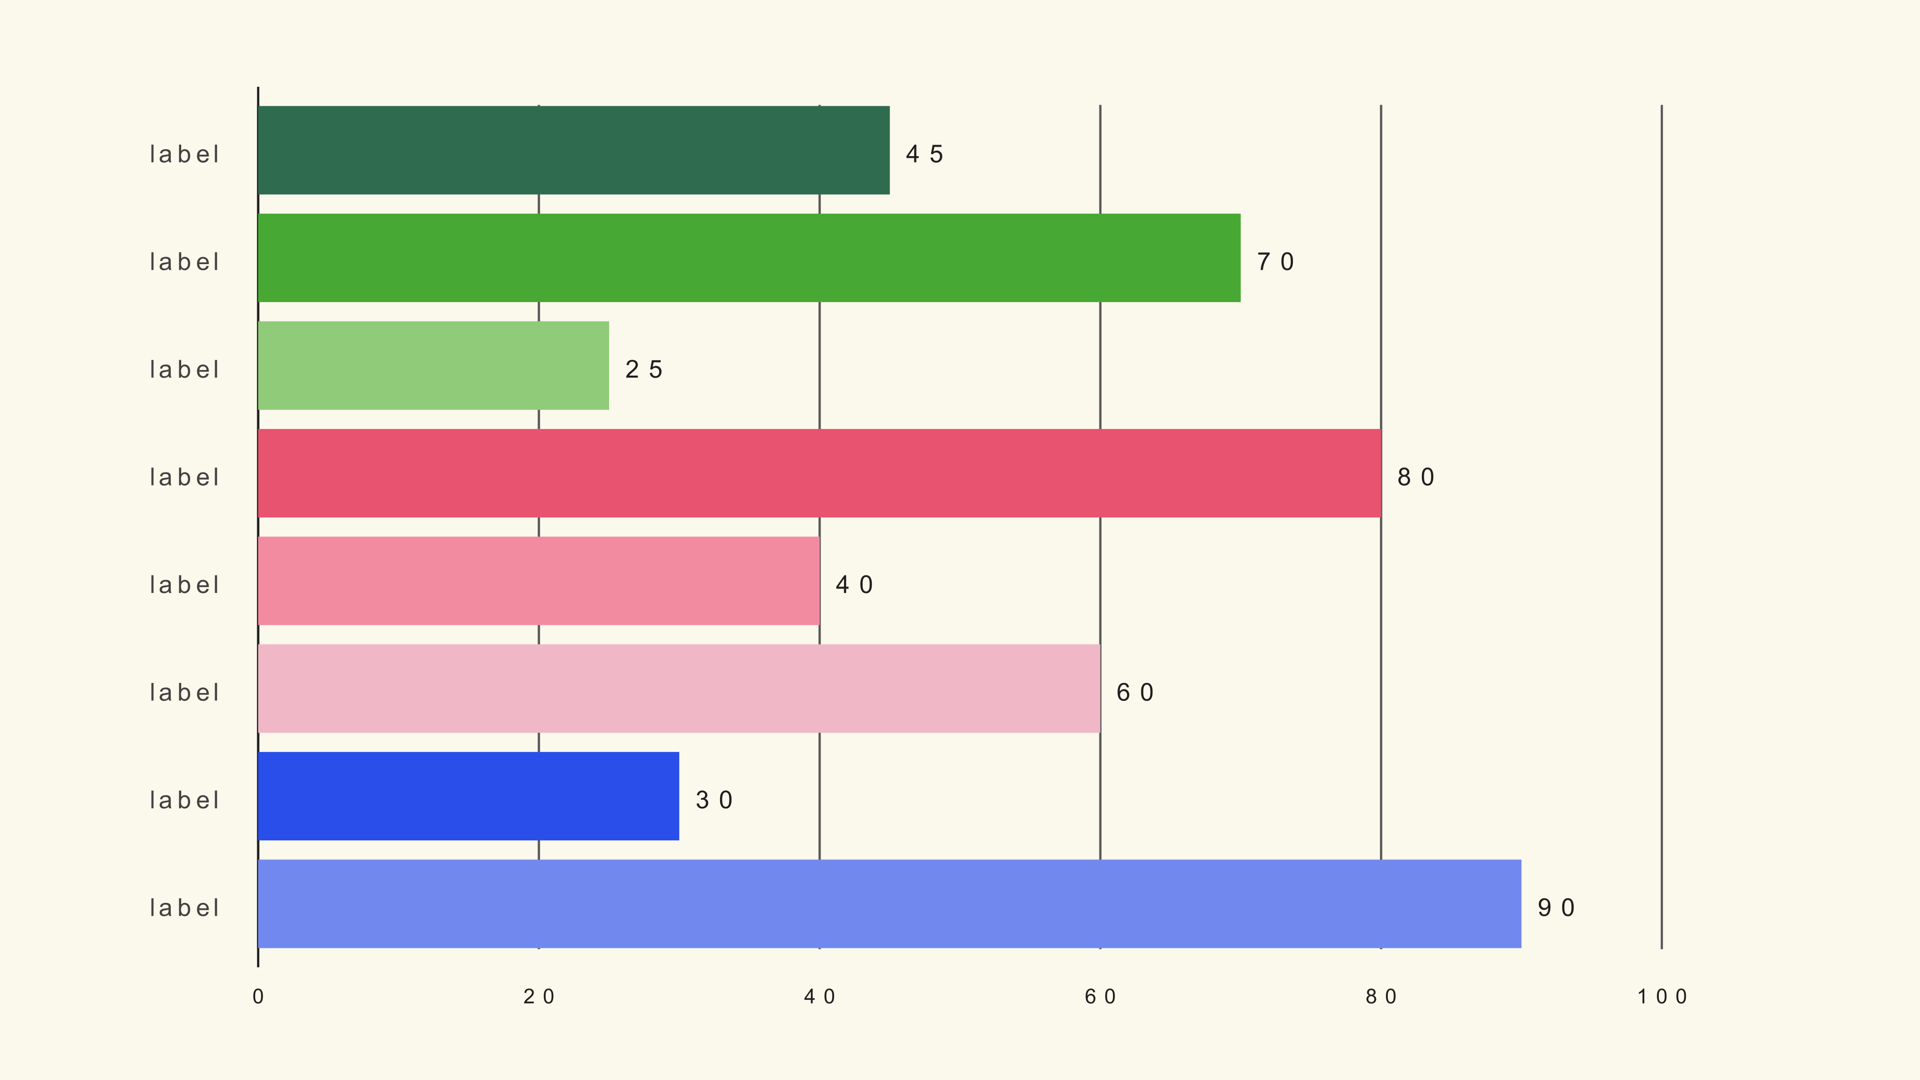
A horizontal bar chart turns a long list into something the viewer can scan. The category names sit on the left, the bars extend to the right, and the ranking is obvious without rotating your head or shrinking the labels. That makes it a strong fit for country lists, product rankings, survey responses, names of people and any lower-third graphic with limited vertical space.
Bar Horizontal is a native Fusion generator for DaVinci Resolve. It reads a label/value CSV and draws one horizontal bar per row. This guide covers the data, the sorting decision, the scale rule and the design choices that keep a ranked list readable on video.
When horizontal bars work
Use horizontal bars when the category labels are long or when the list is a ranking. The layout gives the text a natural reading direction and lets the bars share a common baseline on the left. It is also useful for a chart that sits beside a presenter or a headline, where a vertical bar chart would need too much height.
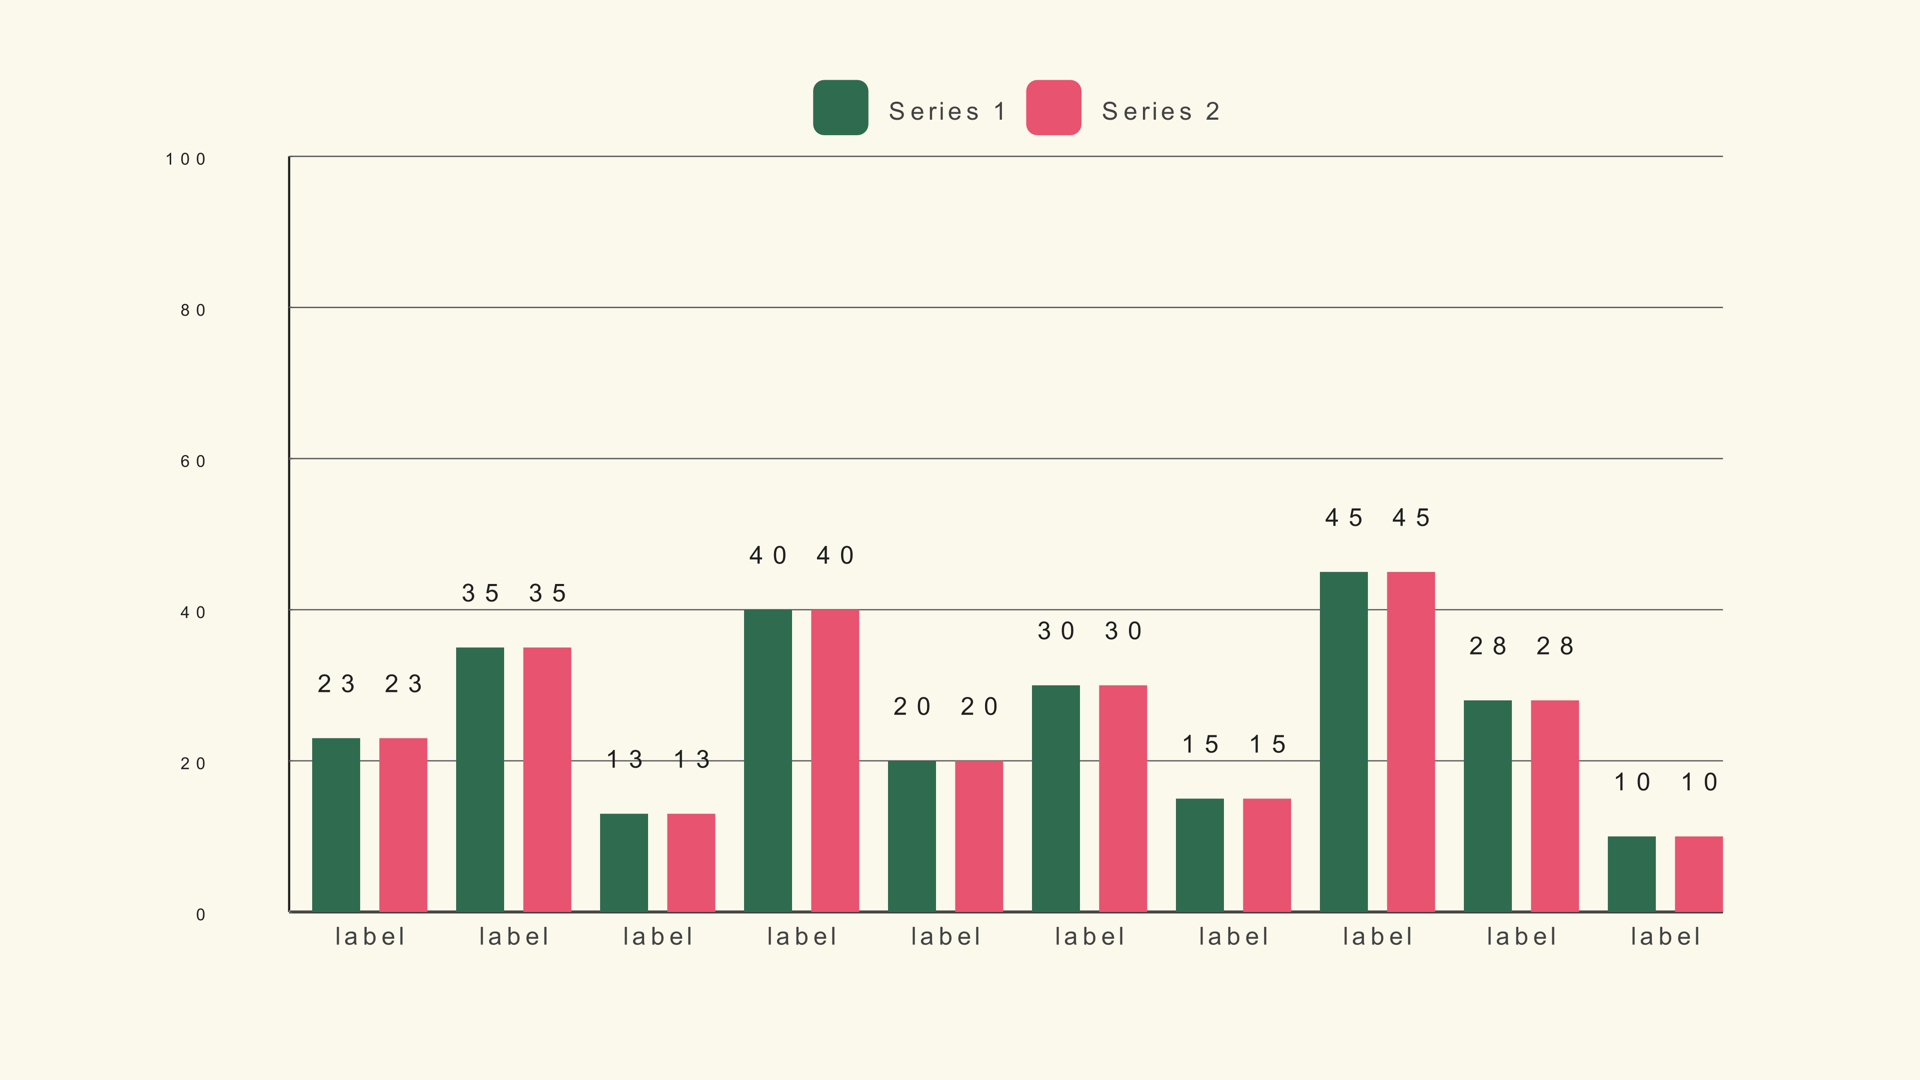
Vertical bars are often better for time-based categories or a small number of short labels. The choice is not about which chart looks more modern; it is about which one makes the labels and the comparison easier to read in the available frame.
Prepare and sort the data
Bar Horizontal expects a label/value table. Sort the rows in the order you want them to appear. The generator draws the rows from the file; it does not automatically rank them for you unless you use a race chart or sort the CSV before import.
Country,Users
India,420
United States,310
Brazil,180
Germany,140
United Kingdom,120
If the story is "the top five," put the largest value at the top of the file. If the story is alphabetical, sort alphabetically. The chart should not make the viewer guess the order.
Add Bar Horizontal to the timeline
- Drag Bar Horizontal from Effects - Generators - Noyris Charts onto a clip above your footage.
- Open the Data page and point CSV File at the table.
- Set Bars to the number of rows.
- Confirm the label column is 0 and the value column is 1.
- Check that the longest label still fits inside the frame.
If only the first few bars appear, the Bars control is lower than the row count. If the labels are missing, the label column is probably pointing at a numeric column.
Set the scale
Chart Max sets the length of a full bar. Use the largest value, rounded up to a clean number. If the chart is part of a series, keep the same Chart Max so the bars can be compared between shots.
For a ranking where the values are close, a zero-based scale is still the honest choice. If the differences are too small to see, consider showing the values as labels or using a dot plot instead of stretching the scale. A bar chart is a comparison of length; a truncated baseline breaks that contract.
Style the labels and bars
Keep the category labels horizontal. The orientation control can turn them upright, but horizontal text is faster to read and uses the space beside the bar naturally. If the labels are too long, shorten them or increase the left margin before rotating the text.
Use one accent color for the bar the story is about and a quieter color for the rest. A ranked list with twenty different colors is harder to scan than a single-color list with one highlighted row. Value labels at the end of the bars can replace the value axis when the exact numbers matter.
Animate the ranking
A top-to-bottom grow-in follows the reading order. Set a small stagger so the bars arrive in sequence, but keep the duration short enough that the last row appears before the voiceover moves on. A fade is acceptable for a list with many rows, but a directional grow is more informative.
If the chart is a static ranking, do not animate the bars reordering. That is a race, and it needs the Bar Race generator and a wide timeline table. A static horizontal chart should communicate a fixed order.
Horizontal bars vs. a bar race
Use a horizontal bar chart for a snapshot. Use Bar Race when the ranking changes over time and the movement is the story. The two charts share a horizontal geometry but answer different questions.
Common mistakes
- Unsorted data. The ranking looks random.
- Labels that run off the frame. Increase the margin or shorten the names.
- A truncated baseline. The length comparison becomes misleading.
- Too many rows. The labels shrink below readability.
- Animating a static ranking like a race. The viewer expects the order to change.
Next steps
Load the bar sample into Bar Horizontal to see the same values in a different orientation. Then read the Bar Horizontal guide and compare it with the bar race workflow.