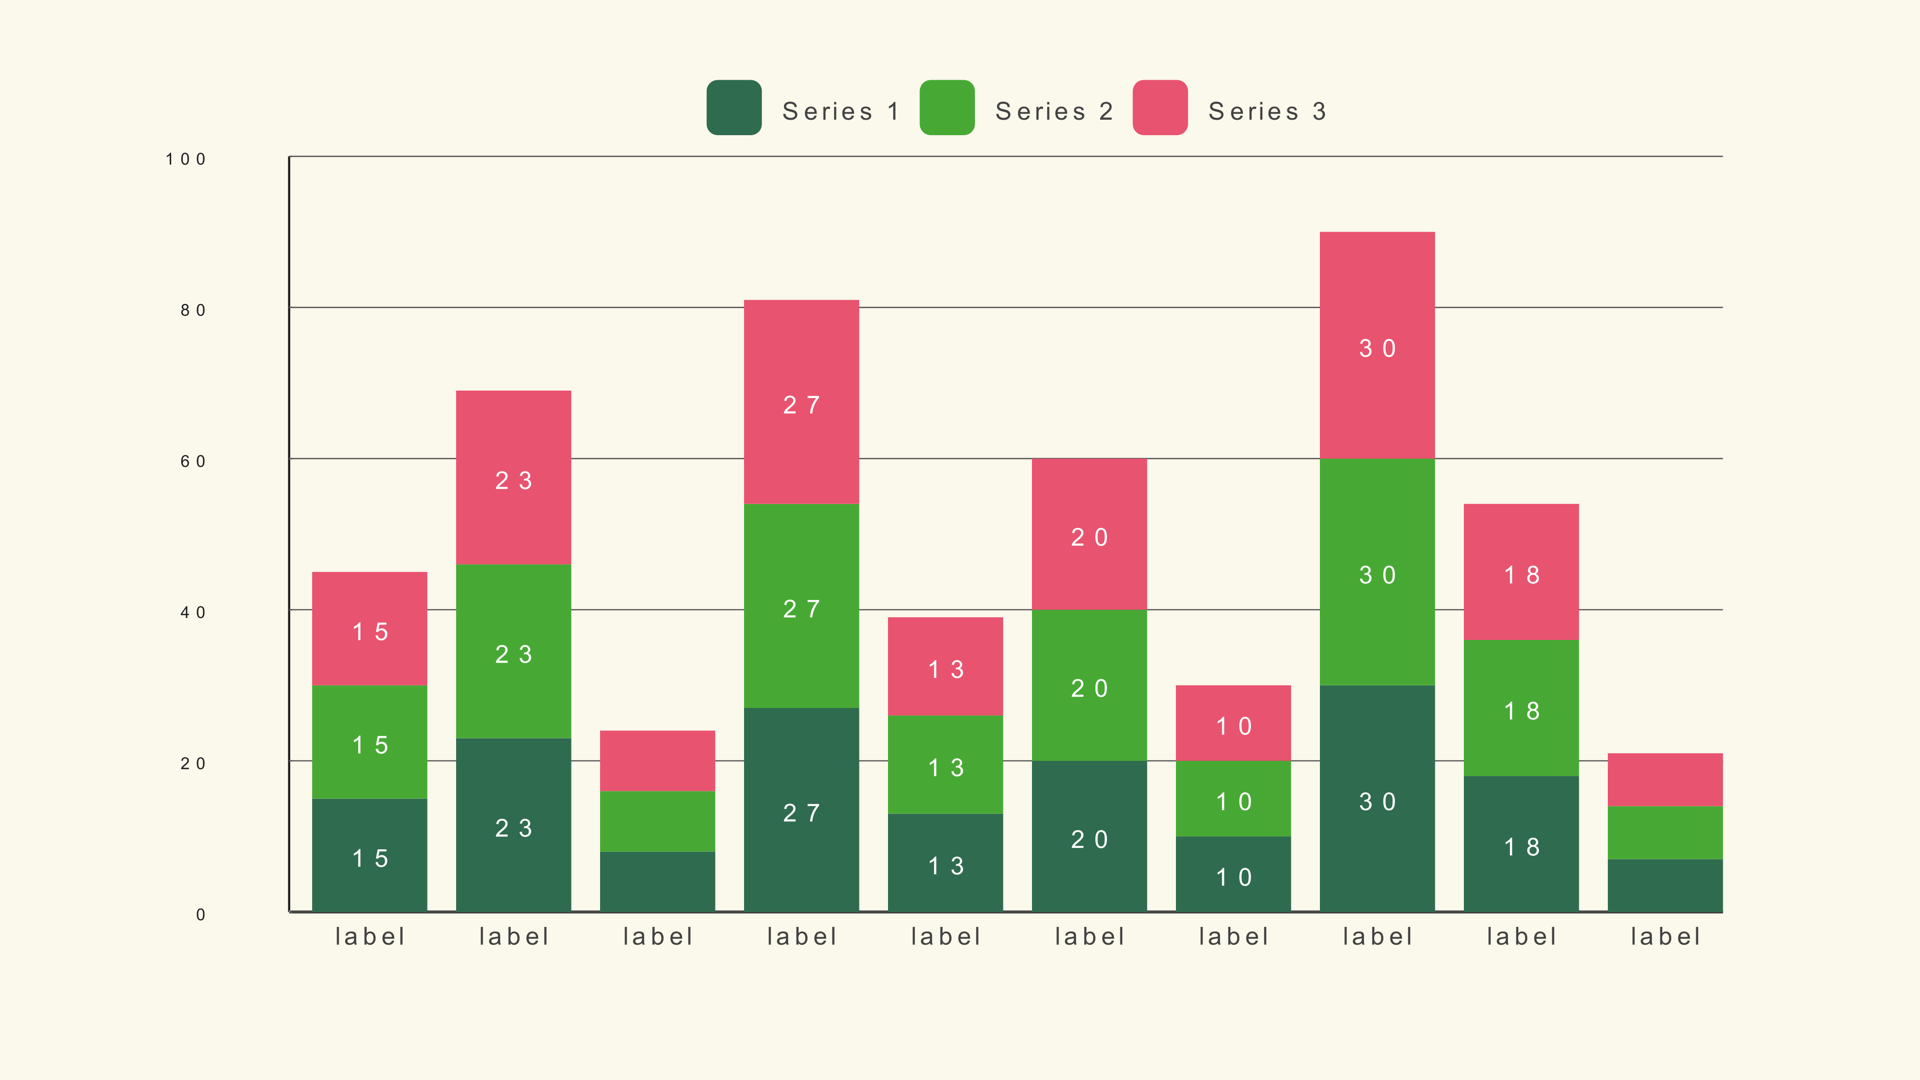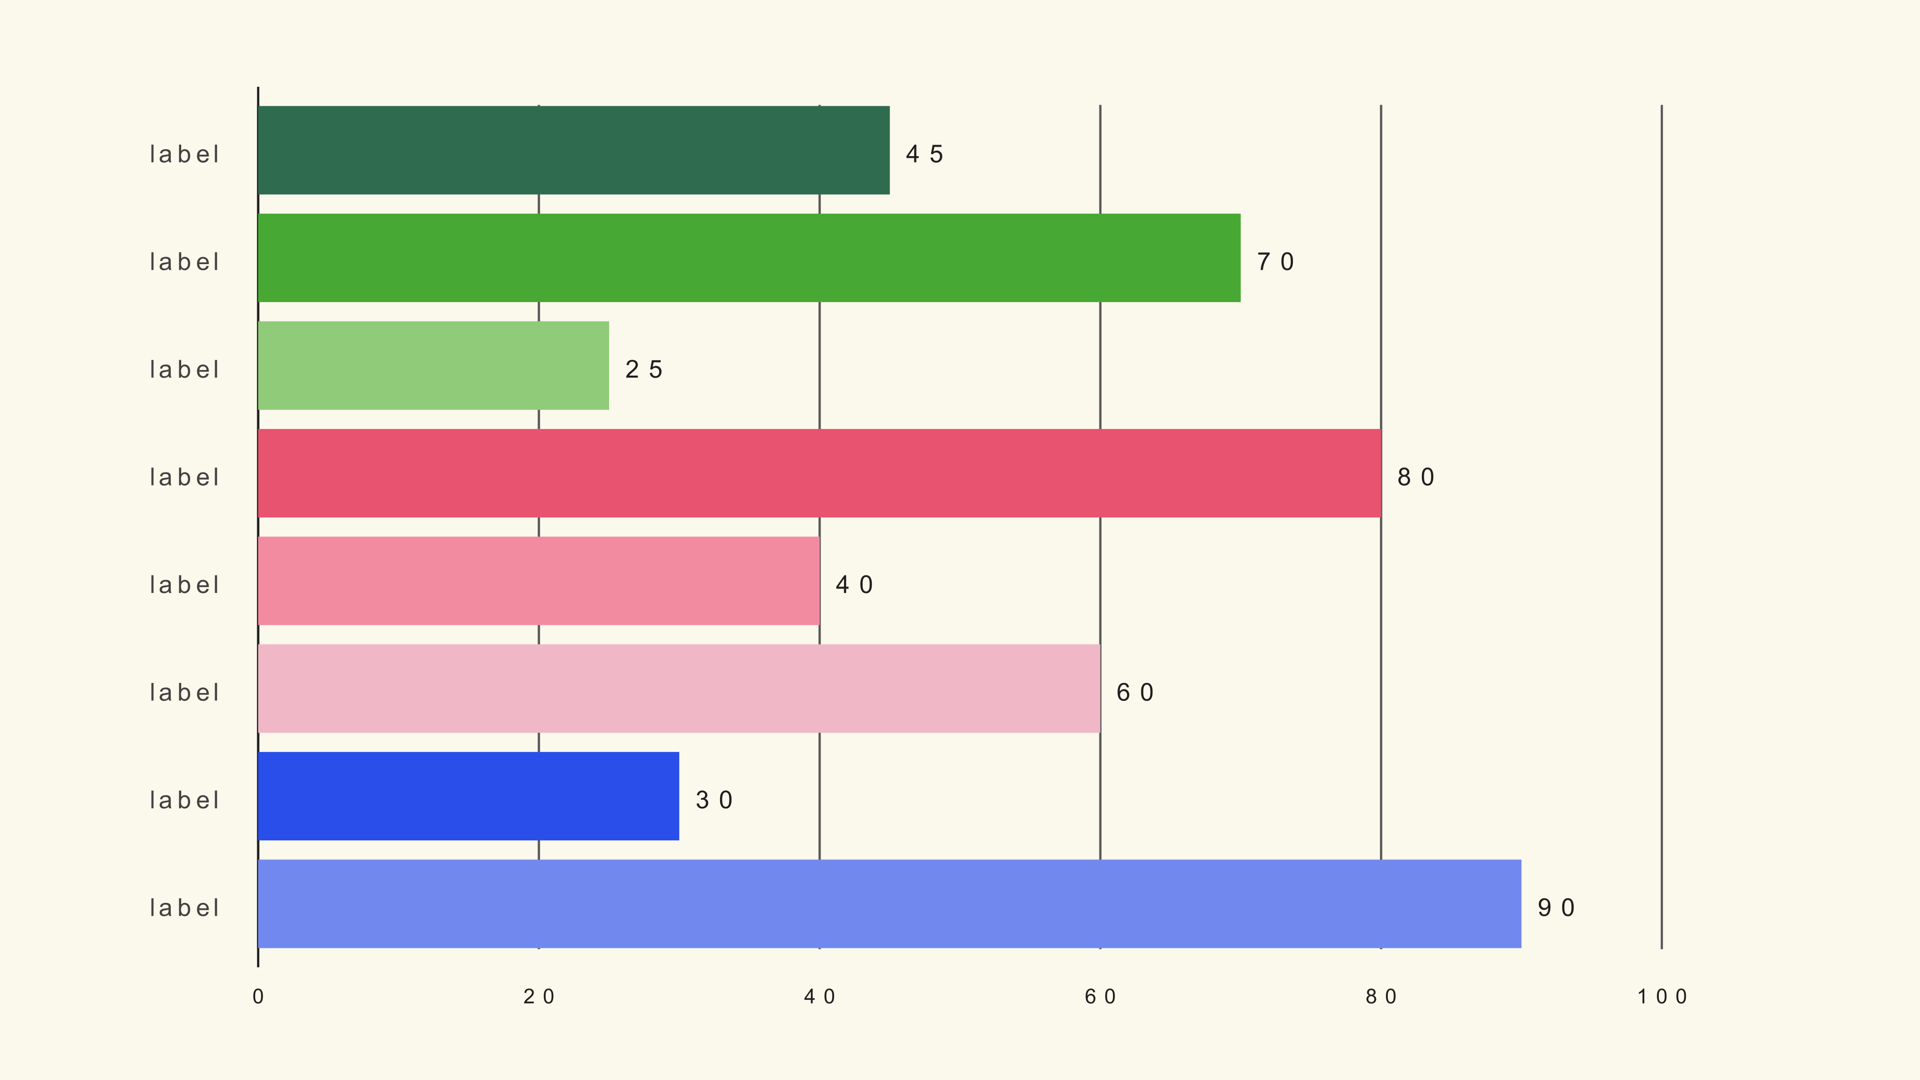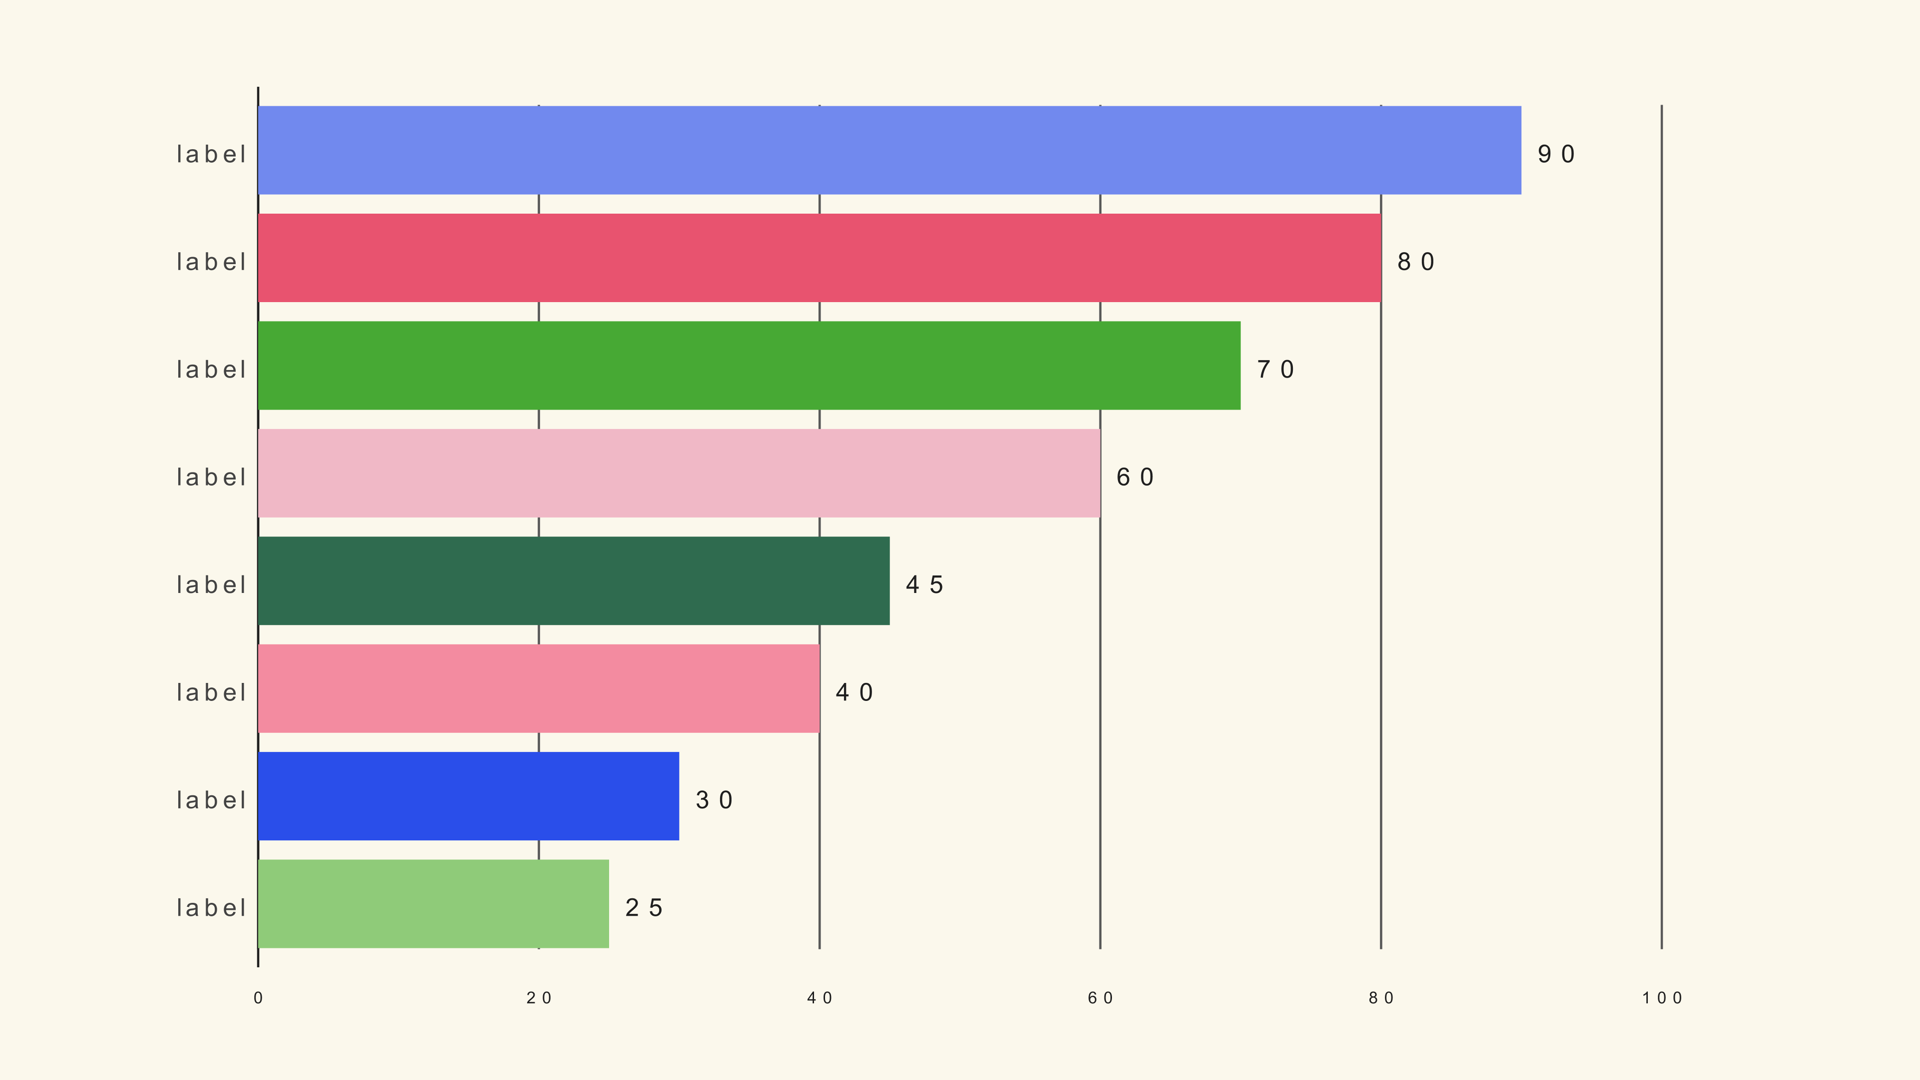
A bar chart race makes change over time feel physical. The bars keep their category identity while their lengths and rank change, so the audience can follow a market share battle, a follower count race or a polling swing without reading a table.
Bar Race in Noyris Charts is a native Fusion generator for DaVinci Resolve. It reads a wide timeline table, sorts the bars by value and can advance through the timeline columns from the comp clock. This guide covers the data shape, the ranking controls, the scale rules and the motion settings that keep the race readable.
When a bar race works
A race works when the ranking itself is the story. Use it for market share, audience growth, election polling, sports tables or any dataset where the leader changes and the movement matters. Do not use it for a single snapshot; a static bar chart is faster to read and easier to label.
The chart also works when the audience already knows the categories. If every bar is a new name, the viewer spends the first half of the graphic reading labels instead of watching the rank change. Keep the cast small and consistent.
Prepare the wide table
Bar Race expects a wide table, not a long one. The first column holds the category label. Each following column is one time step, with the time label in the header row.
Series,2019,2020,2021,2022,2023,2024
Alpha,42,48,55,61,68,74
Beta,58,56,60,64,69,72
Gamma,35,39,44,50,57,65
Delta,66,63,58,54,49,45
Every row must have the same number of values, and every time column must use the same unit. If one column is in millions and the next is in billions, the race becomes a lie. Keep the rows in the same order in every column so the chart can track each category.
The sample file is bar-race.csv. It uses years as the header row and four categories as the rows. If you need a refresher on CSV mapping, read How to Import CSV Data into DaVinci Resolve Charts.
Add Bar Race to the timeline
Install Noyris Charts, restart Resolve, then drag Bar Race from Effects - Generators - Noyris Charts onto a clip above your footage. Select the generator and open the Inspector. The Data page has two CSV sections: the simple label/value import and the race timeline import. Use the race section for this workflow.
Point Race CSV File at the file. Leave Header Row First on because the first row contains the years. Set Timeline Column to the step you want to inspect. Column 1 is the first time step after the label column.
Control the ranking
Sort by Value is on by default and keeps the largest bar at the top. Show Rank adds a rank number in front of each category label, which makes the position change explicit. Show Top N limits how many bars are visible; a value of 8 is a practical starting point for video, even if the data contains more categories.
If the chart looks crowded, reduce the number of visible bars before you shrink the labels. A race with eight readable bars is more useful than a race with twenty bars nobody can name. The hidden rows still exist in the data; they simply do not compete for space.
Fix the scale
Chart Max is the most important control in a race. It sets what a full-length bar means. If Chart Max changes between time steps, a bar can grow while its value stays the same, or shrink while it is actually rising. Set Chart Max from the largest value anywhere in the table, then leave it fixed for the entire sequence.
If you want the bars to fill more of the frame, lower Chart Max only after you have checked that the largest value still fits. If the values are percentages, 100 is usually correct. If the values are raw totals, round up to a clean number above the maximum.
Keep the same scale across a series of charts as well. If one video shows a race from 0 to 100 and the next shows the same categories from 0 to 1,000, the audience will misread the second chart unless the change is on screen.
Animate the race
For a static snapshot, animate the bars in and leave Timeline Column on one step. For a moving race, the generator supports playback from the comp clock, which advances the displayed timeline column as the playhead moves. Timeline Column remains the fallback when playback is off.
Set Start, Duration and Stagger so each ranking settles before the next change. A short stagger around 0.04 seconds works for a race because the bars are already moving between time steps. A long stagger fights the race motion and makes the chart feel like it is stuttering.
If the playhead moves faster than the data can be read, slow the sequence in the edit rather than adding more easing. A bar race is a reading graphic; the viewer needs enough time to see who is first and who is gaining.
Style the leader
Use one strong accent for the category the story follows and a quieter palette for the rest. If the leader changes, a single accent color can stay with the category rather than the rank, so the viewer can follow the same bar through the race. Turning Apply Theme off and setting per-bar colors is the reliable way to do that.
Keep the value labels on if the exact number matters. If the story is only about rank, the rank number and category label may be enough. Avoid a dense grid behind a race; the moving bars already provide plenty of visual activity.
Render and check
Scrub through the entire race before rendering. Check the first frame, the moment the lead changes, and the final frame. Look for labels that collide, bars that disappear because Chart Max is too low, and time steps that change too quickly to read. Then render from the Deliver page as usual.
If the race is part of a longer explainer, render a version with a transparent background for compositing, or keep the background card if the chart needs to sit on its own. The chart is vector geometry at the timeline resolution, so a 4K timeline produces a 4K chart.
Common mistakes
- A moving scale. Chart Max changes between steps, so the bars lie.
- Too many visible rows. The ranking becomes a wall of labels.
- A long CSV with mismatched time units. The race jumps for the wrong reason.
- Showing every time step at full speed. The viewer cannot read the change.
- Changing category colors. The audience loses track of who is who.
Next steps
Load the sample race file and rebuild the chart once with the default settings. Then read the Bar Race guide for the full control reference and try How to Animate a Chart in DaVinci Resolve for timing.