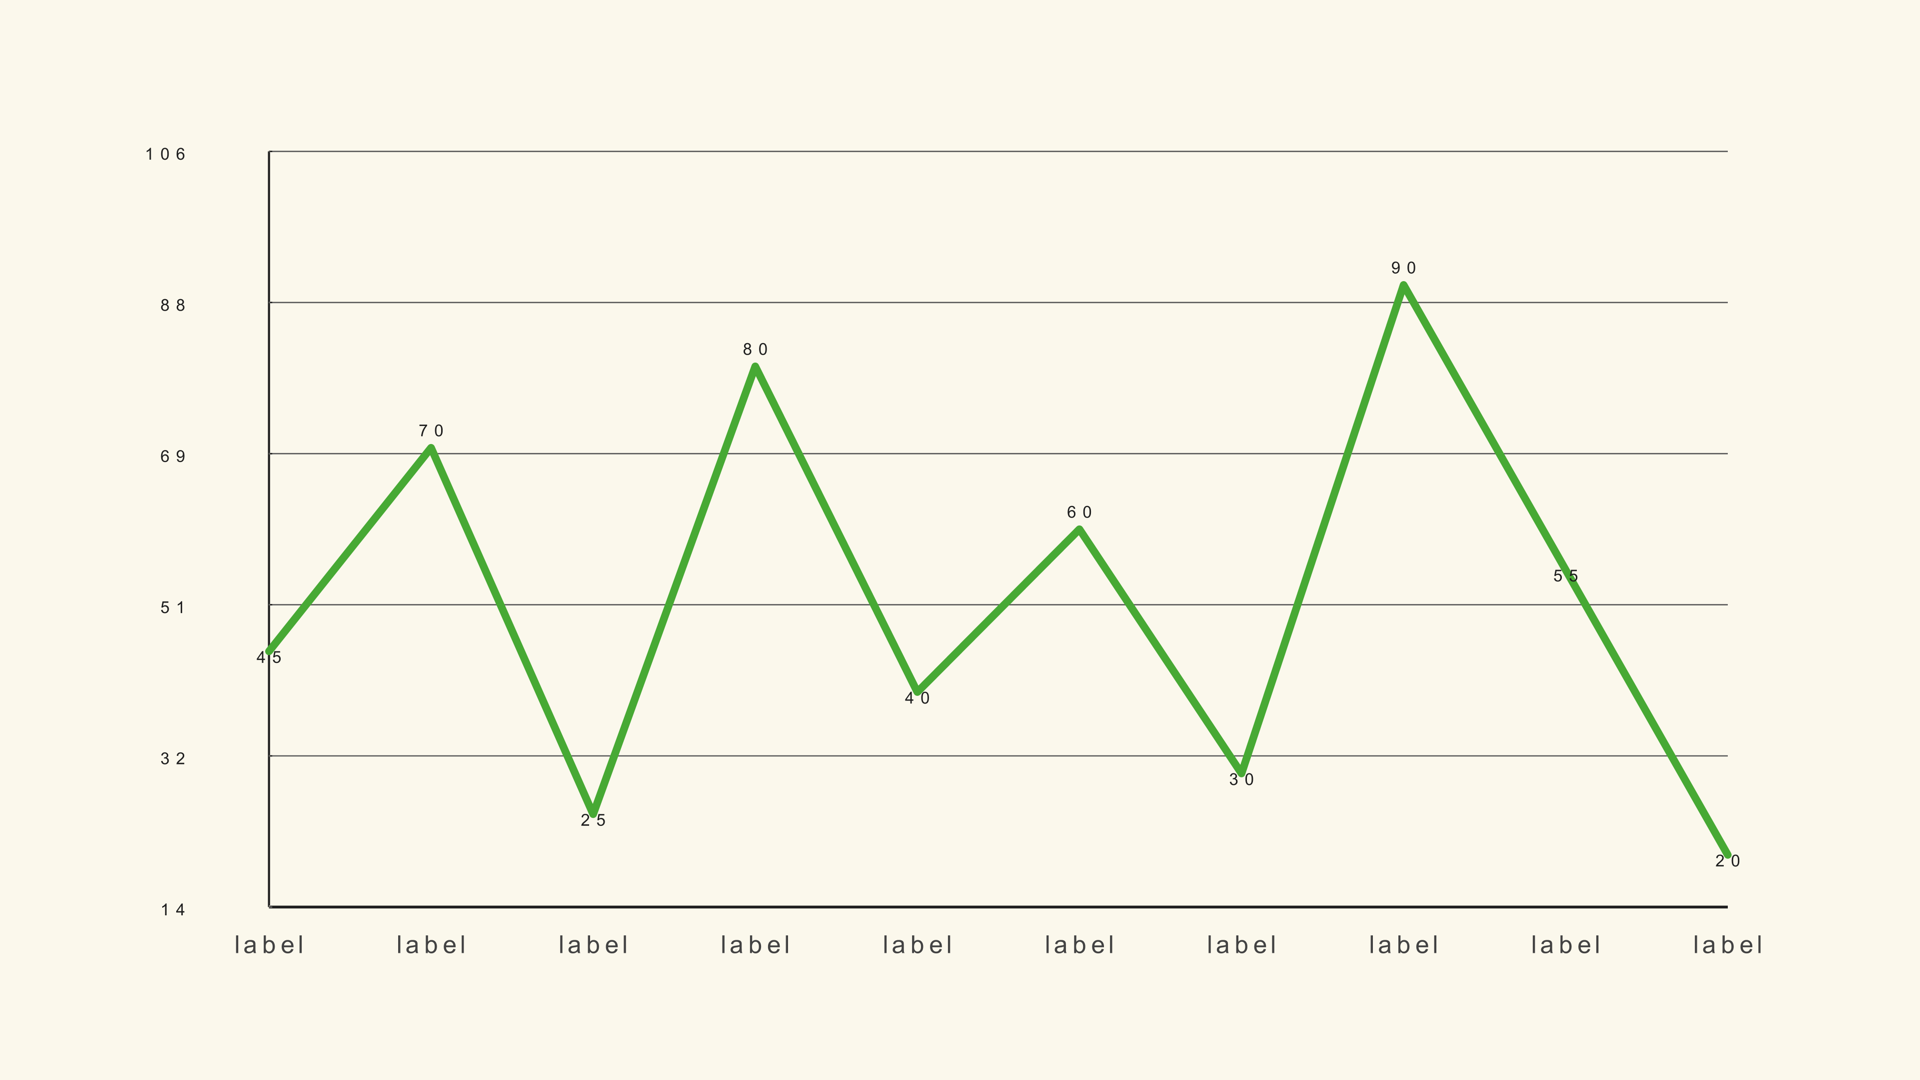
A line graph is the right choice when the audience needs to see direction. Revenue climbing, traffic falling, temperature rising, a metric flattening after a launch: all of those stories read faster as a line than as a row of bars. The line also makes the space between values visible, which is useful when the change matters more than the exact number at each step.
Line Basic is a native Fusion generator for DaVinci Resolve. It reads a label/value CSV or manual values, plots a single series and supports a draw-on reveal. This guide covers the data shape, the scale decision that makes or breaks the chart, and the style choices that keep the line readable on video.
When to use a line graph
Use a line graph for a continuous series: months, weeks, years, frames or any ordered progression. The x-axis should have a natural sequence. If the categories can be reordered without changing the meaning, a bar chart is usually clearer.
Line graphs are also good for comparing a value against a target, showing momentum before and after an event, or making a small but consistent change visible over a long period. They are less good for exact category comparisons, where a bar chart gives the eye a stronger common baseline.
What Line Basic does
Line Basic handles one series. It plots up to 300 points from the manual controls and up to 1,000 rows from a CSV. The generator supports a draw-on reveal, a fit-to-data mode, configurable margins and the same theme and label controls as the bar charts.
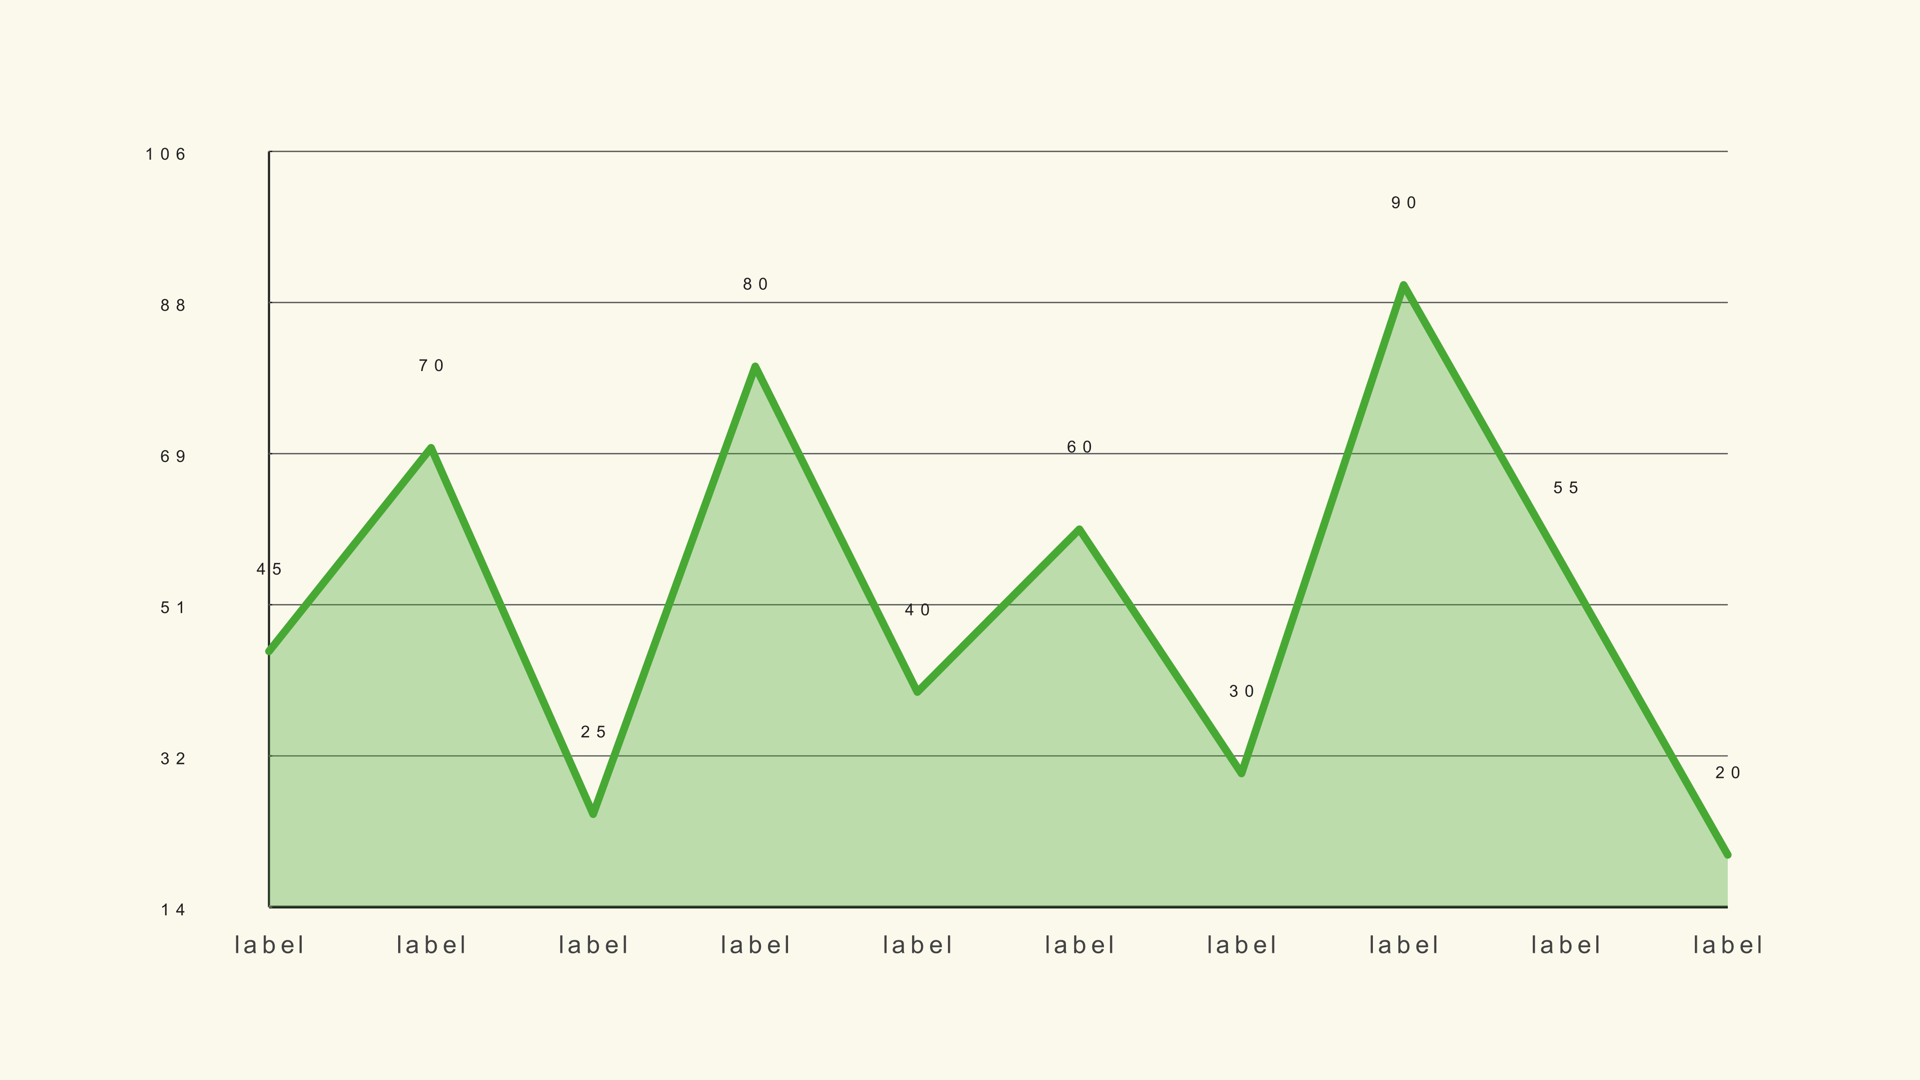
If you need two or more lines on the same axes, use the Multi Line generator. If the area under the line is part of the story, use an area chart. Keeping Line Basic single-series is a feature: it forces the edit to decide which trend is the subject.
Prepare the data
The CSV is a label/value table. The first column is the time label, the second is the numeric value. Leave the header off if the first row is data; turn Header Row First on if the first row contains column names.
Month,Revenue
Jan,42
Feb,48
Mar,45
Apr,57
May,63
Jun,68
The sample file is line-basic.csv. Keep one decimal style and remove currency symbols or thousands separators before import. The full CSV rules are in How to Import CSV Data into DaVinci Resolve Charts.
Load the series into Resolve
- Drag Line Basic from Effects - Generators - Noyris Charts onto a clip above your footage.
- Select the generator and open the Data page.
- Point CSV File at the downloaded file.
- Leave Header Row First off for the sample.
- Set Points to the number of rows you want to plot.
If the line stops early or includes an empty point at the end, the point count does not match the file. Set Points from the actual row count before you tune the layout.
Choose the scale
This is the most important decision in a line chart. Fit to Data rescales the plot to the minimum and maximum values in the series. That is the right choice for a narrow range, such as conversion rate moving from 4.2 to 4.8 percent. A zero-based axis would make that change look almost flat.
Turn Fit to Data off when the baseline is part of the story or when several charts need the same scale. Then set Chart Max and the axis margins deliberately. A chart that hides a zero baseline should say so in the title or caption; the goal is not to avoid a baseline, it is to avoid an accidental one.
For a series that crosses zero, check the negative range as carefully as the positive range. A line that clips below the plot is worse than a chart with extra empty space.
Style the line and the frame
Aim for a stroke width that survives compression. The default is thin enough for a clean documentary look, but a line that sits over footage may need more weight or a subtle shadow. Use a single accent color and let the grid recede.
Turn point markers on only when each data point is part of the explanation. For a monthly trend, the line is usually enough; the labels can carry the time steps. If the chart appears for only a second or two, reduce the number of labels and keep the value labels off.
Keep the plot margins generous enough for the first and last labels. A line that runs into the frame edge looks clipped even when the data is complete.
Animate the line draw
On the Animation page, switch Animate on and choose a line-friendly style. A draw-on reveal should move from left to right, following the time axis. Pair it with a short label fade so the labels do not pop in before the line reaches them.
A one-second draw with a small stagger is a reliable start. If the chart covers a long period, lengthen the duration so the viewer can follow the direction. If the line has a dramatic turn, consider holding the final frame longer rather than adding a second animation.
Line animation is about continuity. Avoid bounce or elastic styles unless the edit is playful; a trend line that wobbles can look like noise in the data.
Line graph vs. other charts
Use a line graph for direction over time. Use a bar chart for exact category comparison. Use a stacked bar chart when each category has multiple components. Use an area chart when the magnitude under the line matters, and a scatter plot when two numeric variables need to be compared.
Common mistakes
- Using a line for unordered categories. The line implies continuity that does not exist.
- An accidental zero baseline. A narrow trend flattens into a straight line.
- Too many points. Every tiny fluctuation becomes visual noise.
- Too many labels. The time axis turns into a wall of text.
- A line that only makes sense while animating. Check the final frame without motion.
Next steps
Load the line sample and try Fit to Data on and off. Then read the Line Basic guide for the full control list and try How to Animate a Chart in DaVinci Resolve for timing.