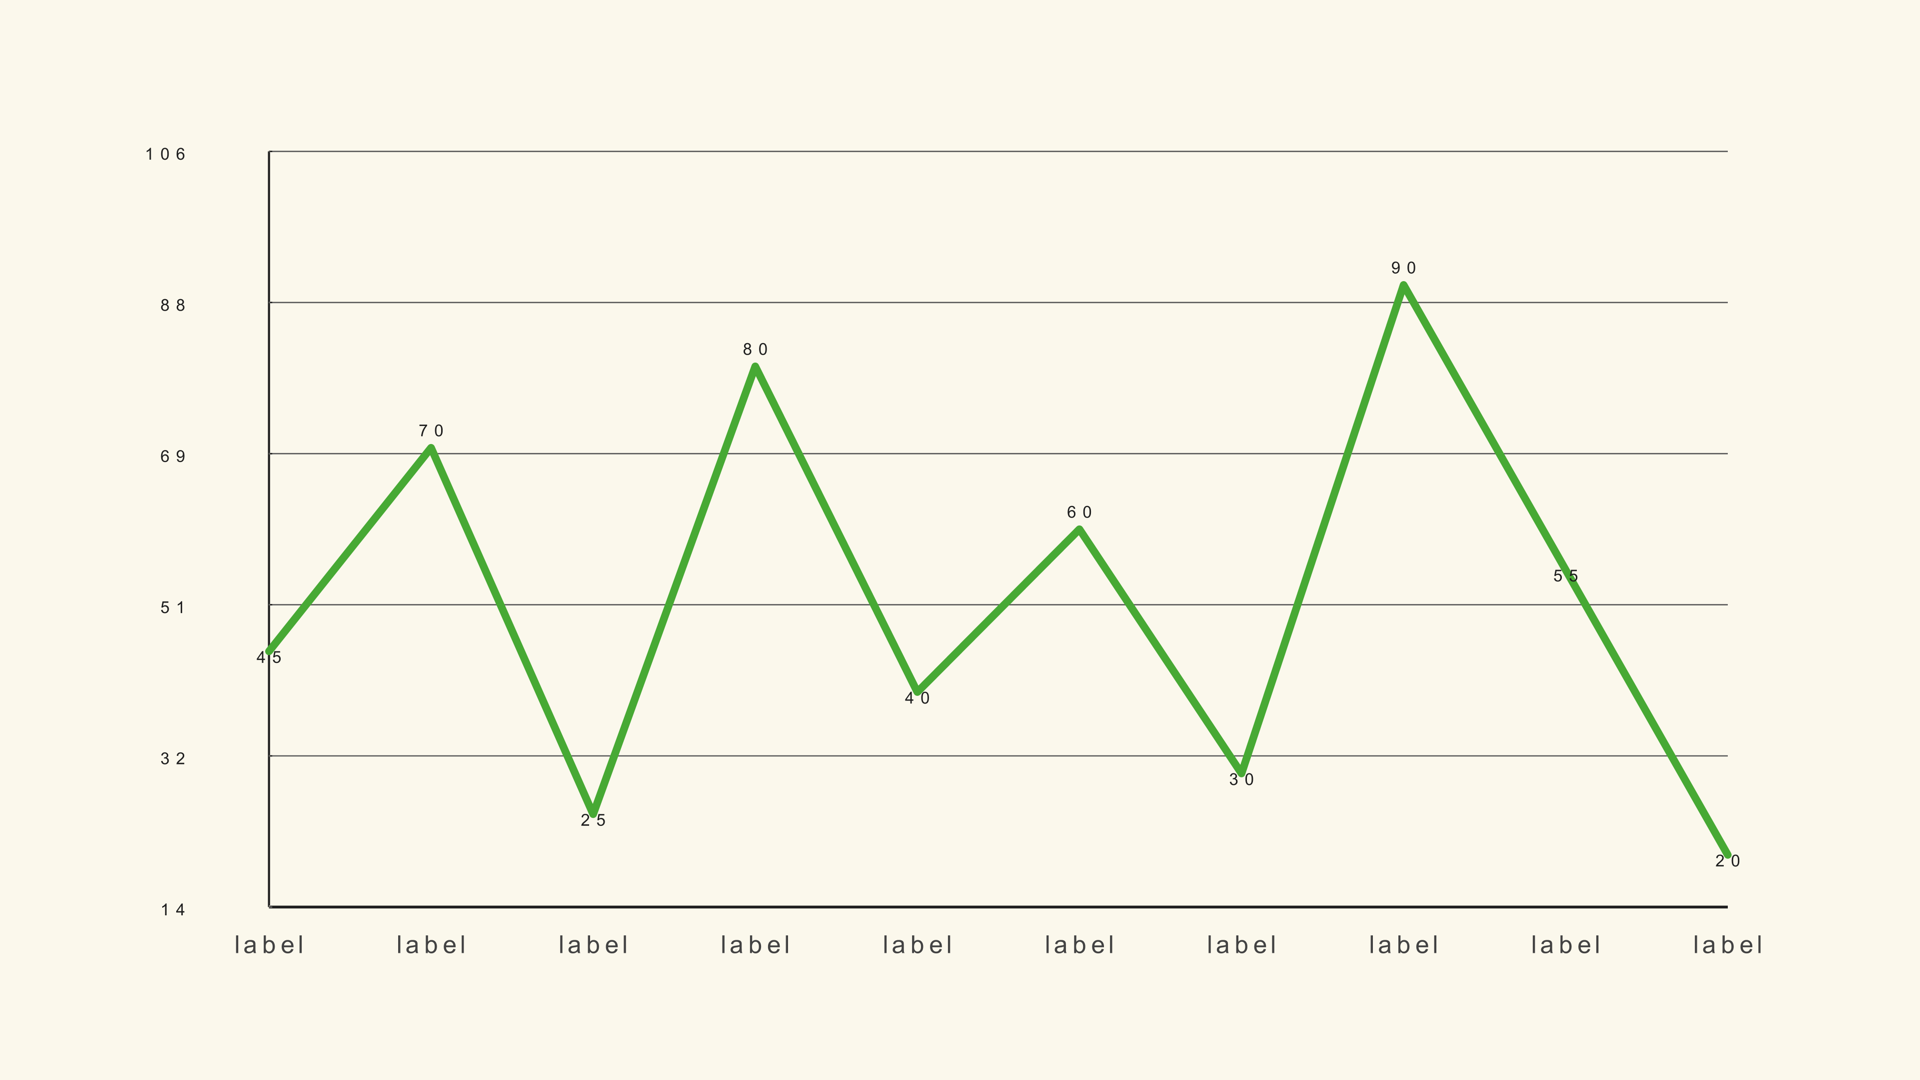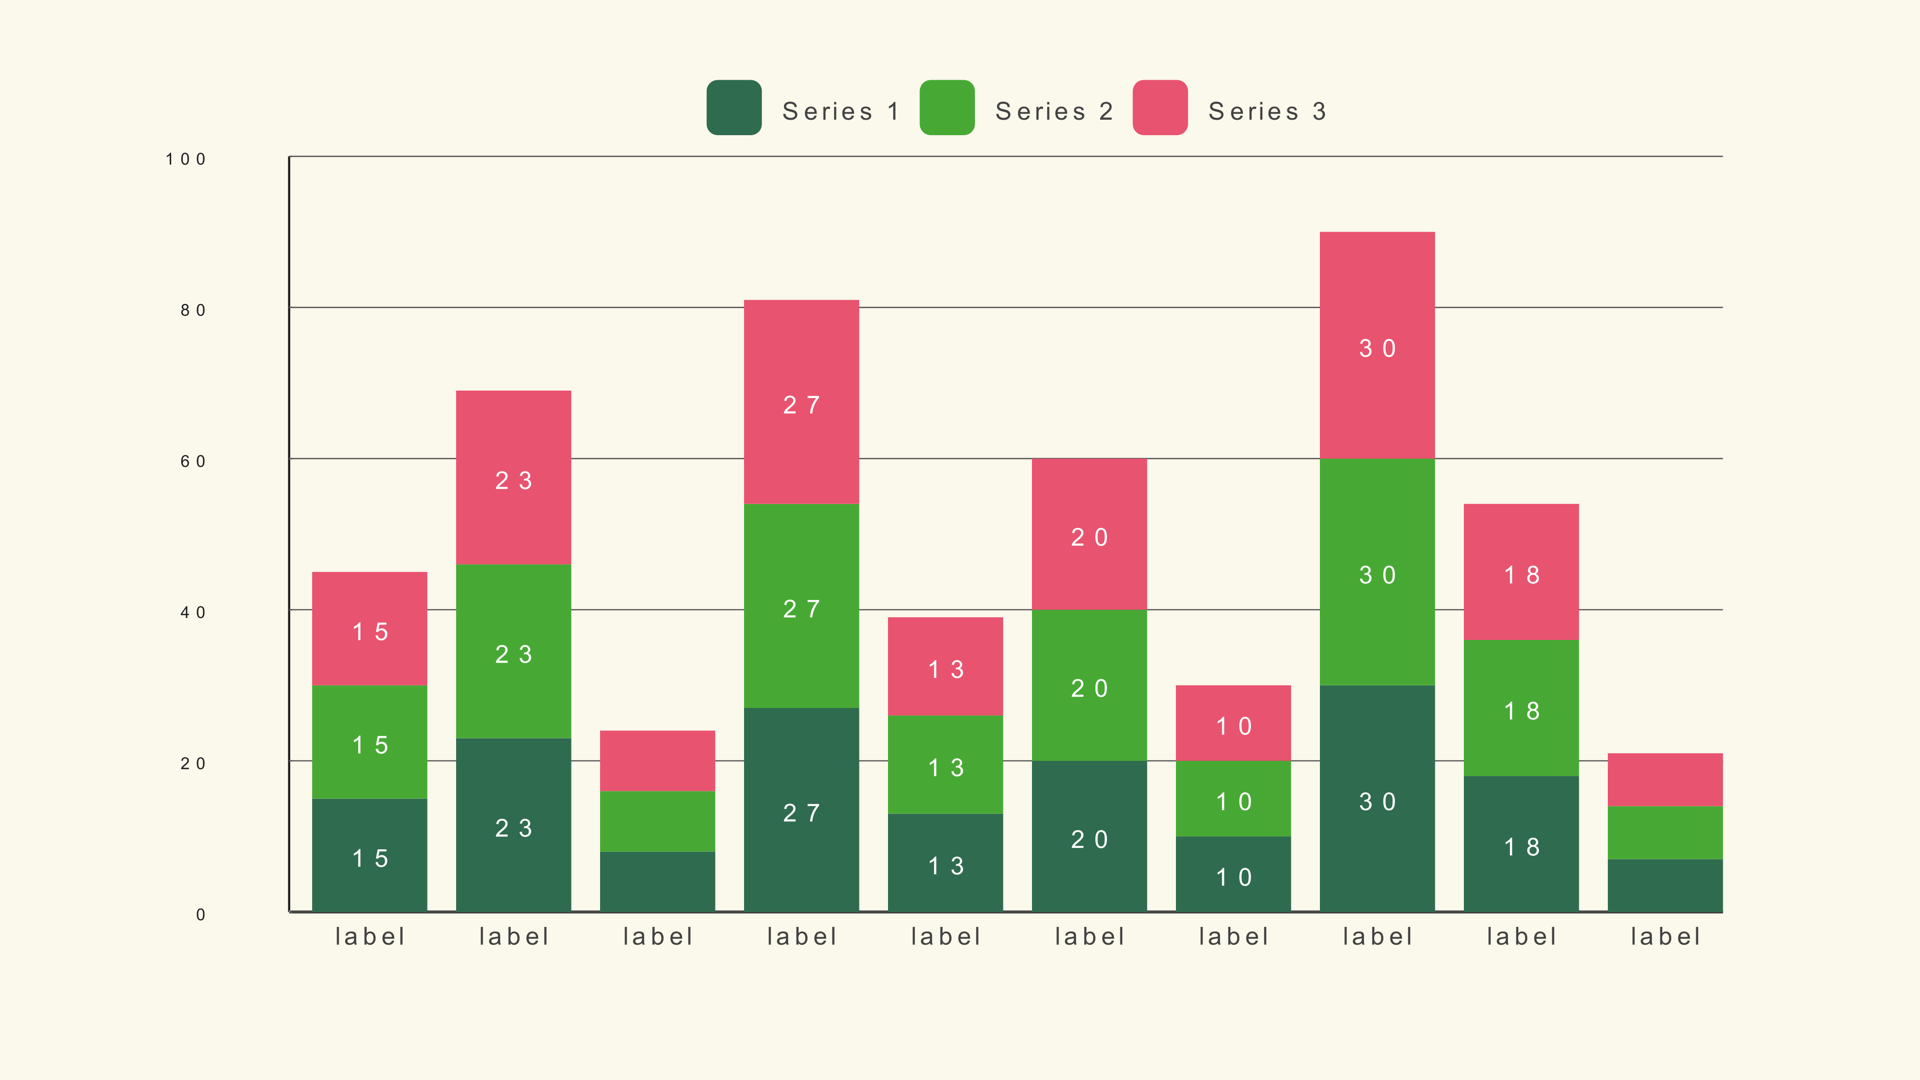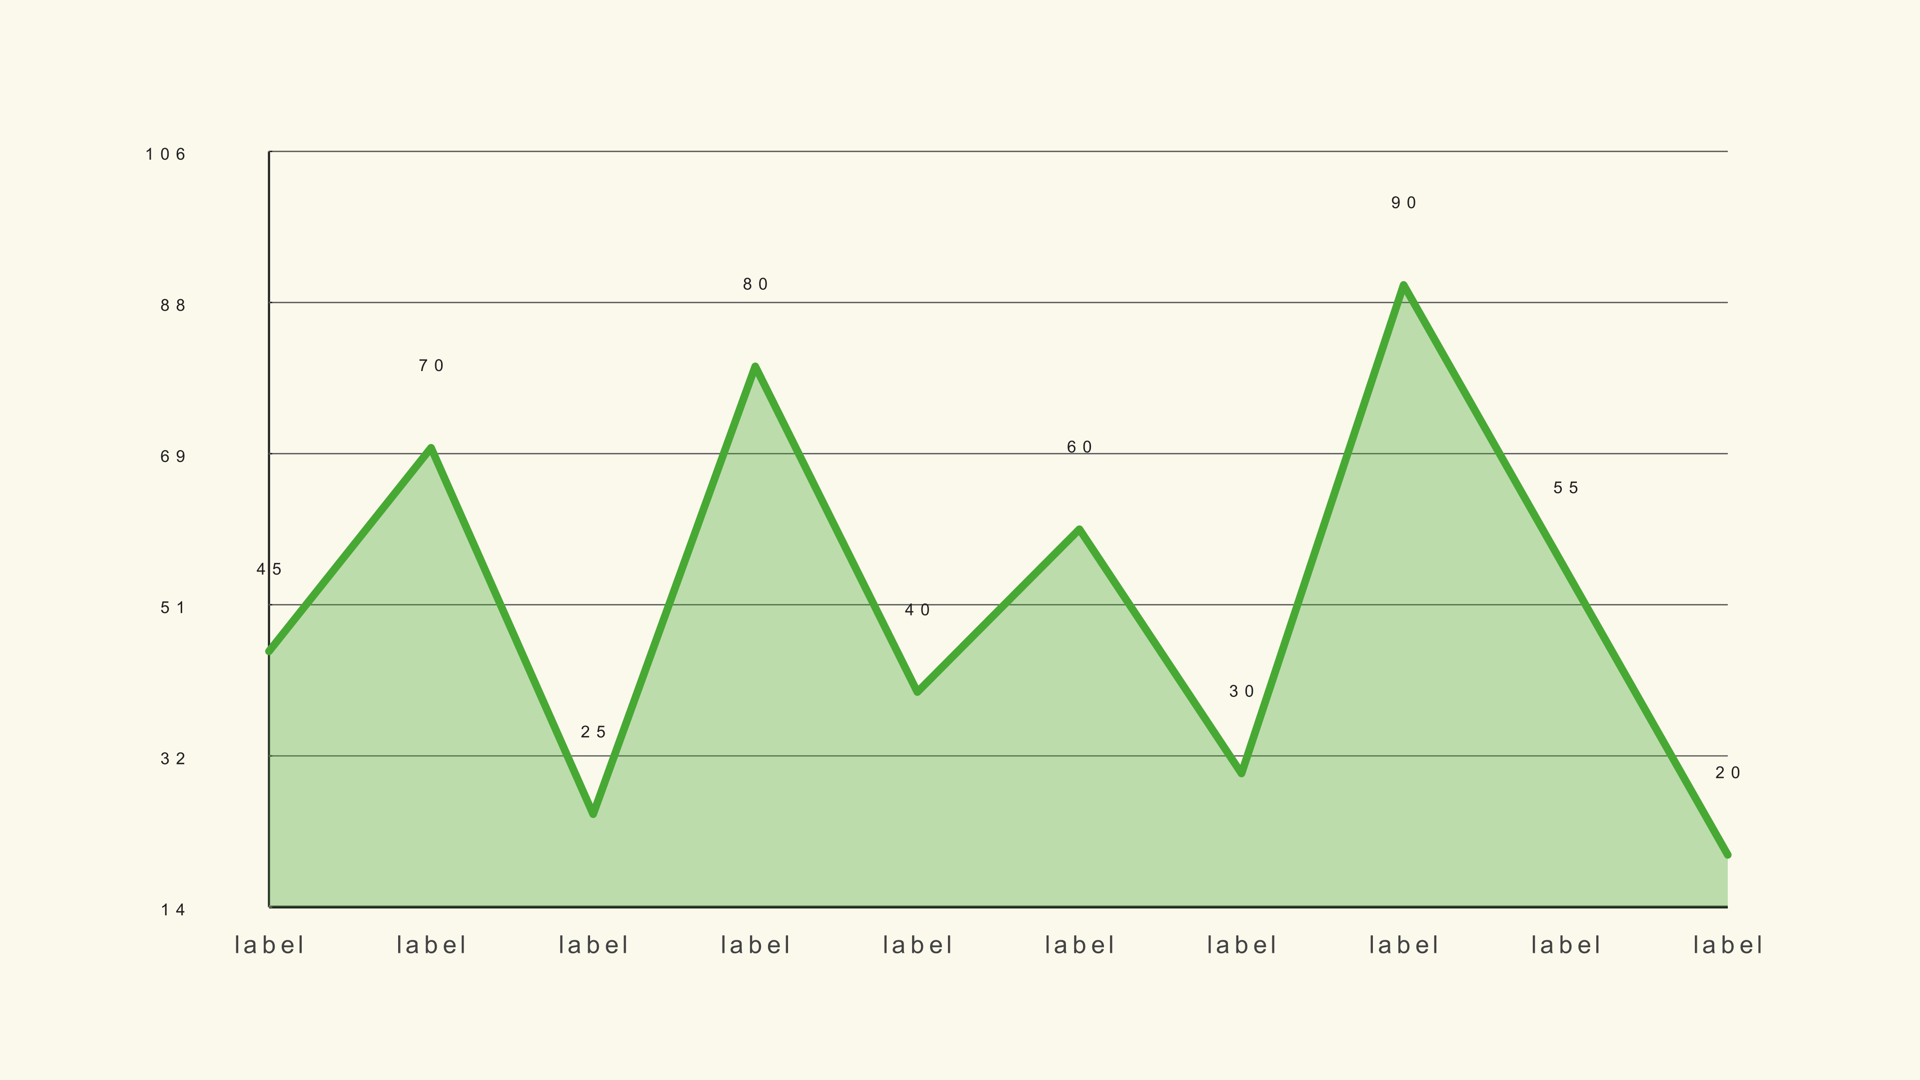
An area chart is a line chart with weight. The line still shows the trend, but the filled area makes the magnitude feel larger and more present. That makes it useful when the volume under the line matters: total users, energy demand, revenue over time or the growing share of a category.
Noyris Charts includes three native area generators for DaVinci Resolve: Area Basic for a single series, Area Multi for up to five overlaid series and Stack Area for a cumulative composition. This guide covers the data, the scale, the fill and the animation that keeps the chart readable.
When an area chart works
Use an area chart when the trend and the magnitude both matter. A line chart is enough when the direction is the whole story; the fill adds emphasis, not information. If the chart is small or the frame is busy, a line may be the cleaner choice.
Use a stacked area chart when the series add up to a meaningful total and the composition matters over time. Use a multi-area chart when the series are separate but comparable. Do not use an area chart for unordered categories; the fill implies continuity.
Prepare the data
Area Basic expects a label/value table. The label is the time step and the value is the height of the area at that point.
Month,Users
Jan,42
Feb,48
Mar,45
Apr,57
May,63
Jun,68
Area Multi and Stack Area use a label column followed by one numeric column per series. Keep the columns in the order you want the series to stack or overlay. The import rules are the same as the line and bar charts.
Load the series
- Drag Area Basic from Effects - Generators - Noyris Charts onto a clip above your footage.
- Open Data and point CSV File at the table.
- Set Points to the number of rows.
- Confirm the label and value columns.
- Choose Fit to Data or set Chart Max manually.
For Area Multi, set the series count and name each series so the legend is readable. For Stack Area, check that the series order matches the columns.
Choose the scale
Fit to Data uses the actual value range and is useful for a narrow series that would flatten on a zero-based axis. Turn it off when the baseline is part of the story or when several charts need the same scale.
For a stacked area chart, Chart Max must cover the sum of the series, not the largest individual series. If the top of the stack clips, the chart is showing the wrong total.
Tune the fill
Show Area Fill turns the fill on or off. Fill Opacity controls how much of the grid and background show through. A low opacity keeps the chart airy; a high opacity makes the area feel solid but can hide the grid and the line.
Keep the line stroke readable against the fill. If the fill is dark, the line may need a lighter color or a subtle outline. If the chart sits over footage, turn the background card off and test the fill against the busiest part of the frame.
Labels and grid
Area charts can get busy quickly. Keep the category labels minimal, especially when the time axis has many points. Value labels are usually unnecessary because the height carries the value; use a callout for the exact number if the script needs it.
Keep the grid subtle. The fill already provides a large shape; a heavy grid competes with it. If the chart is an overlay, a single baseline may be enough.
Animate the area
A draw-on reveal follows the time axis. For a single area, the fill can grow with the line or appear after the line is drawn. For a stacked area, reveal the series in order so the composition builds logically.
Keep the animation short. The final frame should show the full area and the labels without motion. If the chart is part of a longer sequence, hold the finished shape long enough to read.
Area vs. line and stacked bar
Use a line graph when the direction is enough. Use a stacked bar chart when the categories are discrete and exact comparison matters. Use an area chart when the trend and the volume should be felt together.
Common mistakes
- Using area for unordered categories. The fill implies continuity.
- A stacked area with a clipped total. Chart Max is set to a single series.
- Full-opacity fill. The grid and line disappear.
- Too many series. The overlay becomes a muddy color blend.
- No baseline explanation. Fit to Data hides where zero is.
Next steps
Load the line sample into Area Basic to see how the fill changes the emphasis. Then read the Area Basic guide and compare it with Area Multi and Stack Area.