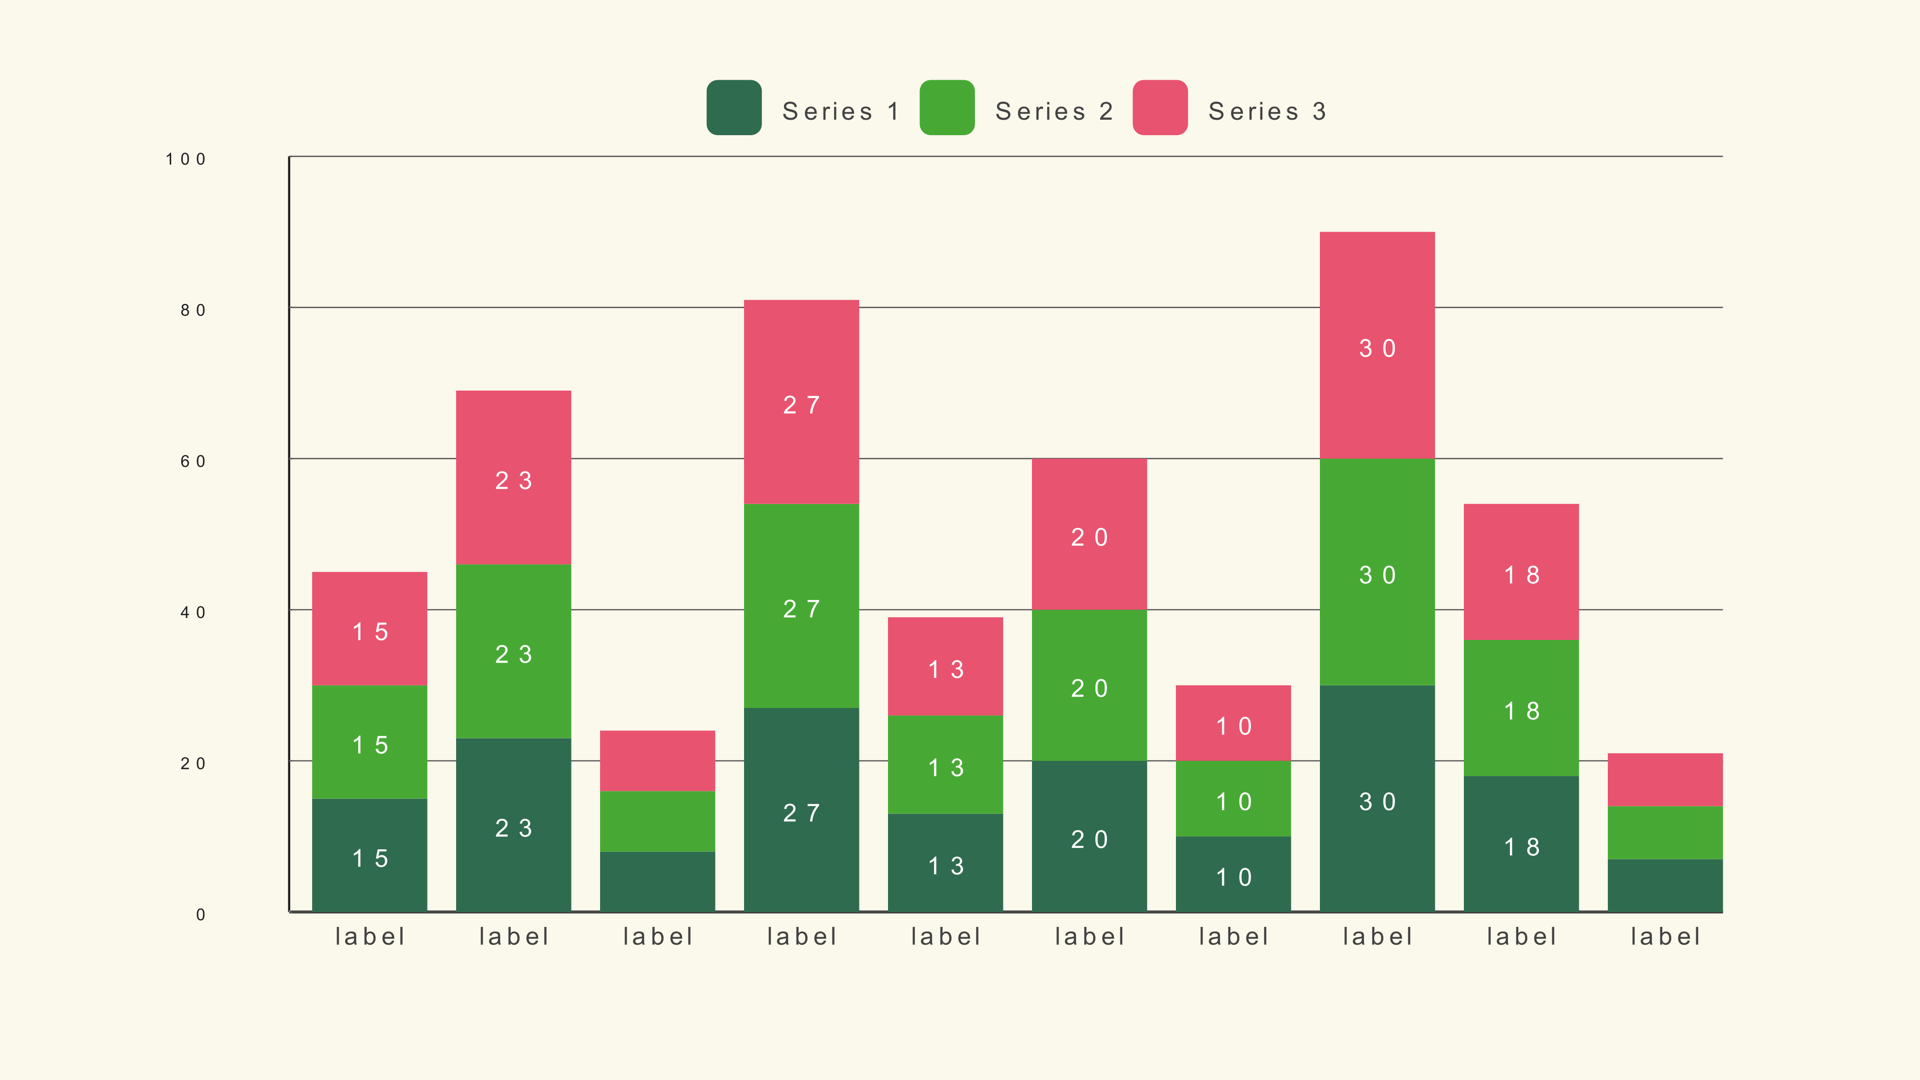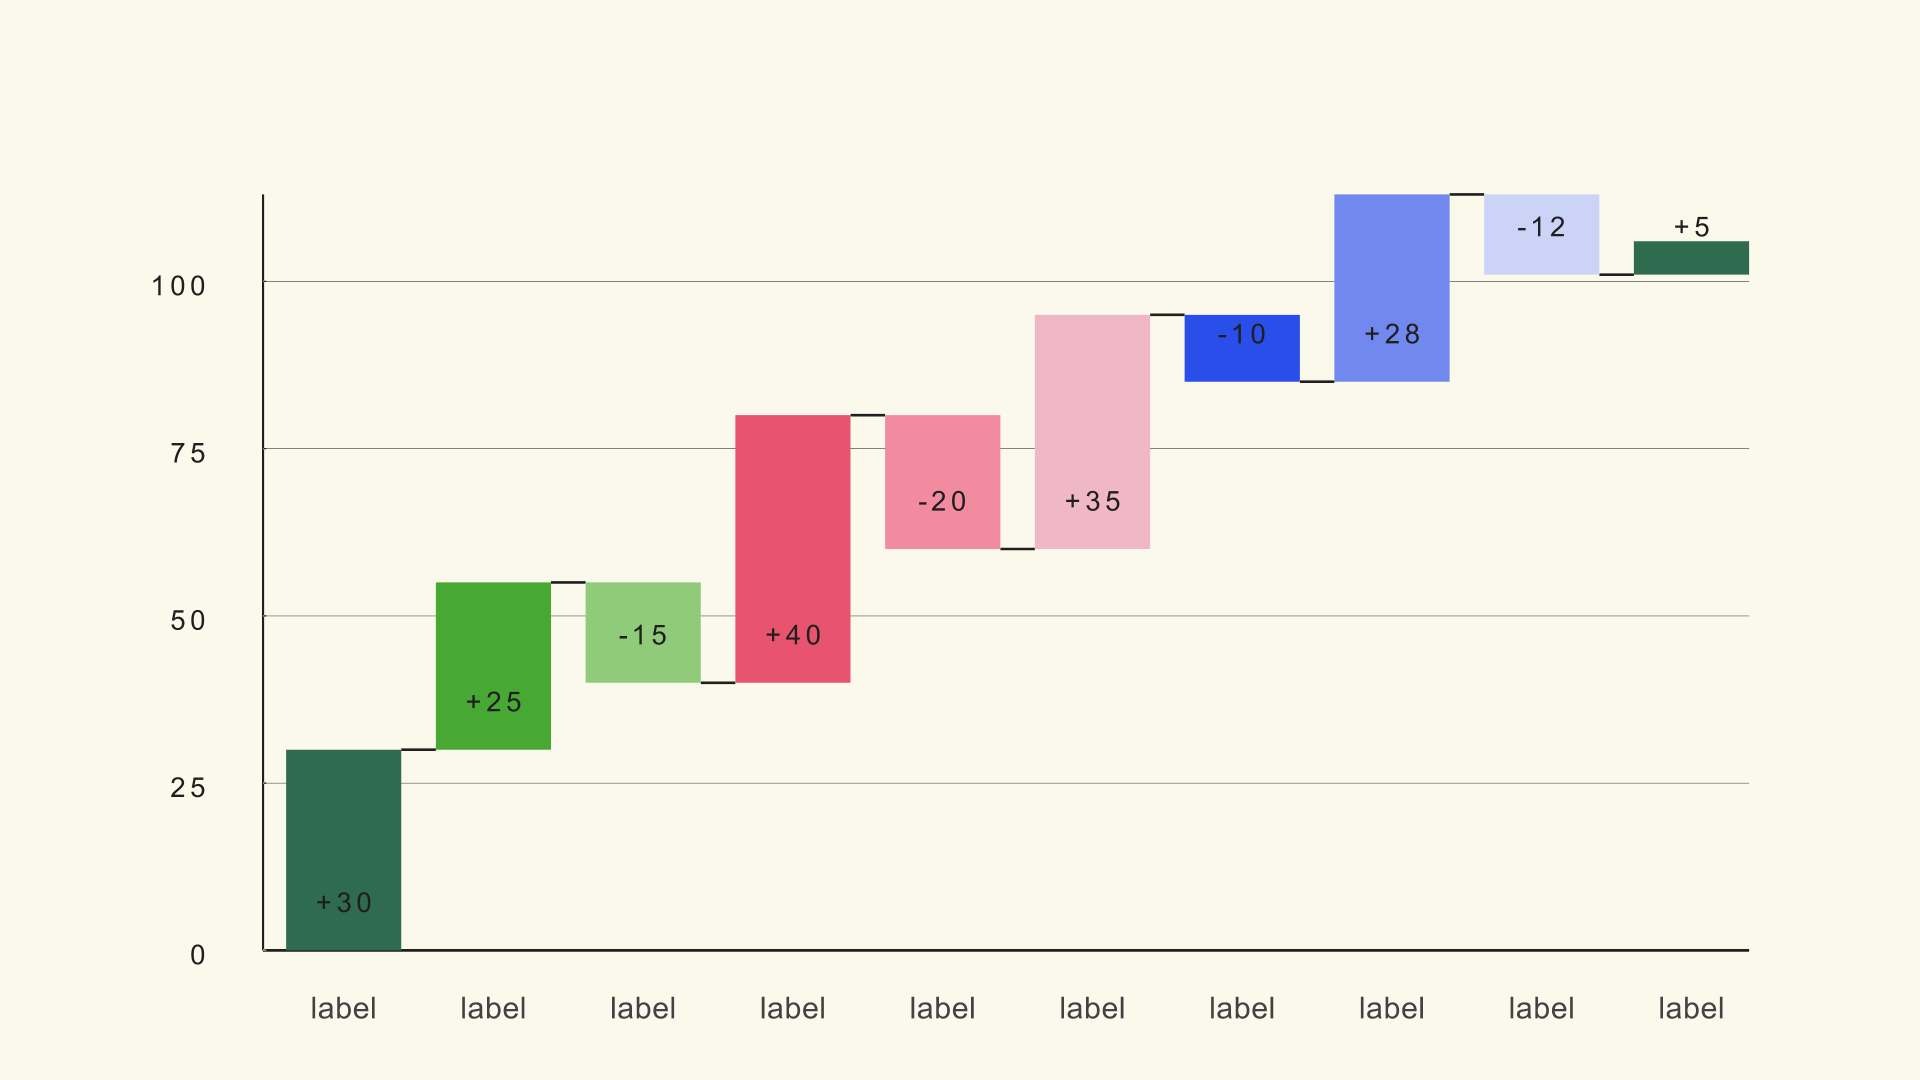
A waterfall chart answers a specific question: how did we get from this number to that number? It is the chart for profit bridges, budget variance, energy transitions and any story where a sequence of increases and decreases changes a starting total into an ending total.
Waterfall is a native Fusion generator for DaVinci Resolve. It reads a label/delta table, supports summary rows and draws connectors between the steps. This guide covers the delta table, the total flag, the scale and the color logic that makes the bridge readable.
When a waterfall works
Use a waterfall when the order of changes matters. A bar chart can show the final values; a waterfall shows the path between them. That makes it useful for explaining why profit fell even though revenue rose, or how a budget moved from plan to actual.
A waterfall is not a replacement for a line chart. If the story is a continuous trend, use a line. If the story is a category comparison, use a bar. The waterfall is for a sequence of discrete changes that accumulate.
Build the delta table
The CSV uses three columns: a label, a delta and an optional total flag. The delta is the change from the previous level. A positive value rises, a negative value falls. The total flag marks summary bars; a value above 0.5 turns the row into a total.
Step,Delta,Total
Revenue,120,0
Cost of sales,-45,0
Gross profit,0,1
Marketing,-18,0
Operations,-22,0
Net profit,0,1
The sample file is waterfall.csv. The labels should describe the step, not the direction. "Marketing" is clearer than "Marketing decrease"; the color and the bar direction already show the sign.
Load the file and mark totals
- Drag Waterfall from Effects - Generators - Noyris Charts onto a clip above your footage.
- Open Data and point CSV File at the table.
- Set Bars to the number of rows.
- Set Total Column (0=none) to the flag column index. If the flag is the third column, use 2.
- Check that the summary bars span from the baseline to the running total at that point.
If every bar looks like a normal step, the total column is not set. If the summary bars are in the wrong place, check the flag values and the row order.
What good waterfall data looks like
A waterfall is only as clear as the row order. Put the steps in the order the voiceover will explain them, not necessarily the order they appear in the spreadsheet. If the story is a profit bridge, start with revenue, show the major cost lines, and finish with net profit. If the story is a budget variance, start with the plan and end with the actual.
Keep the summary rows meaningful. A total bar should mark a checkpoint the audience cares about, such as gross profit, operating profit or final budget. Adding a total after every step turns the chart into a staircase and removes the sense of a running bridge.
Check the arithmetic before you style anything. Each delta should move the running total to the next level, and each total row should match the running total at that point. If the numbers do not reconcile, the chart will show the error clearly, which is useful for catching a spreadsheet mistake and embarrassing if it reaches the render.
Set the scale
Chart Max fixes the top of the scale. Set it above the largest running total, not just the largest single delta. A waterfall can climb higher than any individual step because the running total accumulates.
Negative steps may extend below the baseline. Check that the chart still fits after the largest decrease. If the labels are clipped at the bottom, increase the chart size or reduce the number of steps.
Color the directions
Use one color for increases, one for decreases and a neutral color for totals. The viewer should be able to read the direction before reading the label. Keep the colors distinguishable after compression; a bright green and a bright red on a dark background can vibrate.
Turn Show Connectors on so the eye can follow the running total from one step to the next. Keep the connectors subtle. They are a guide, not the main event.
Animate the bridge
Reveal the steps in order. A forward grow or a left-to-right stagger makes the accumulation legible. If the chart has six to ten steps, a one-second reveal with a small stagger is usually enough.
Pause on the summary bars if the voiceover calls them out. The final total is the payoff; make sure it has a moment on screen before the clip ends.
Common mistakes
- Using deltas as absolute values. The bars show changes, not the final totals.
- Forgetting the total flag. The summary rows draw as ordinary steps.
- Chart Max too low. The running total clips at the top.
- Too many steps. The bridge becomes a jagged line nobody can follow.
- Colors that do not separate after compression. The direction is lost.
Next steps
Load the waterfall sample and rebuild the bridge with the total flags on. Then read the Waterfall guide for the full control list and compare it with the stacked bar workflow.