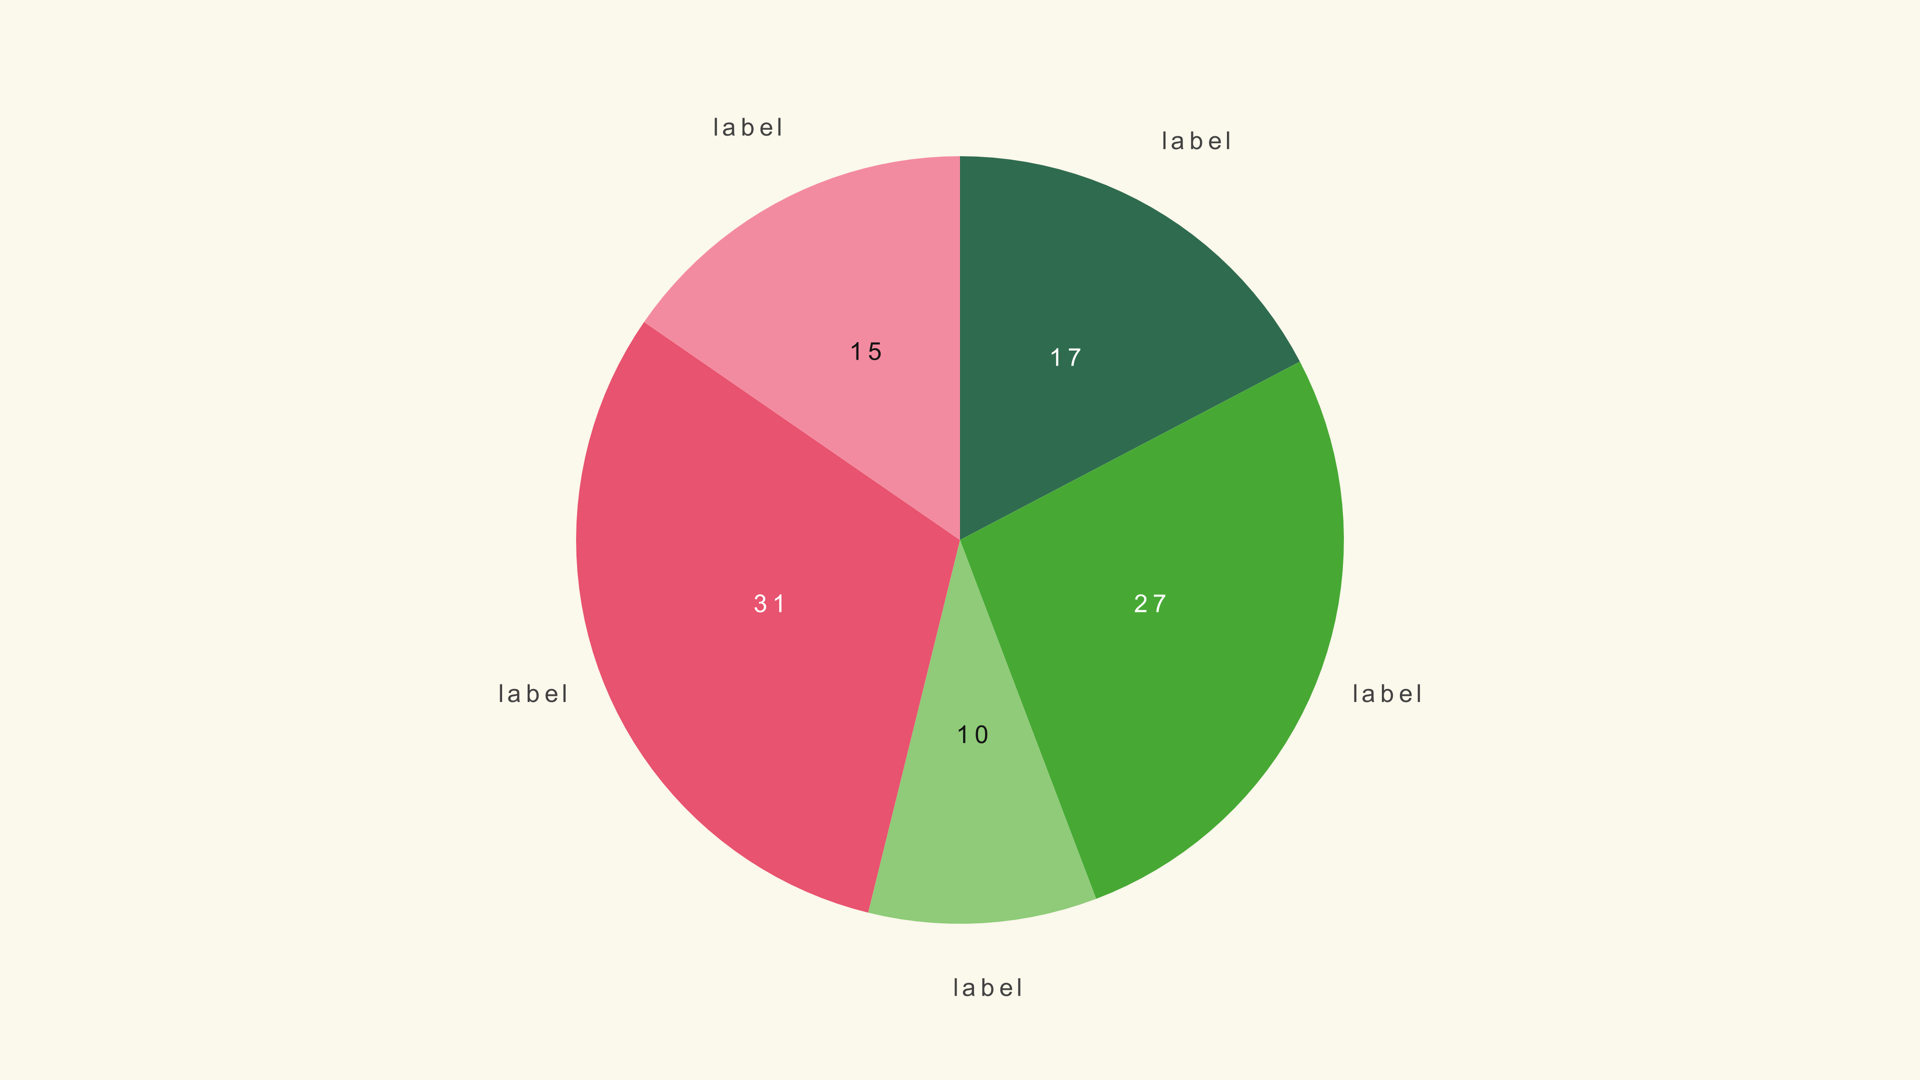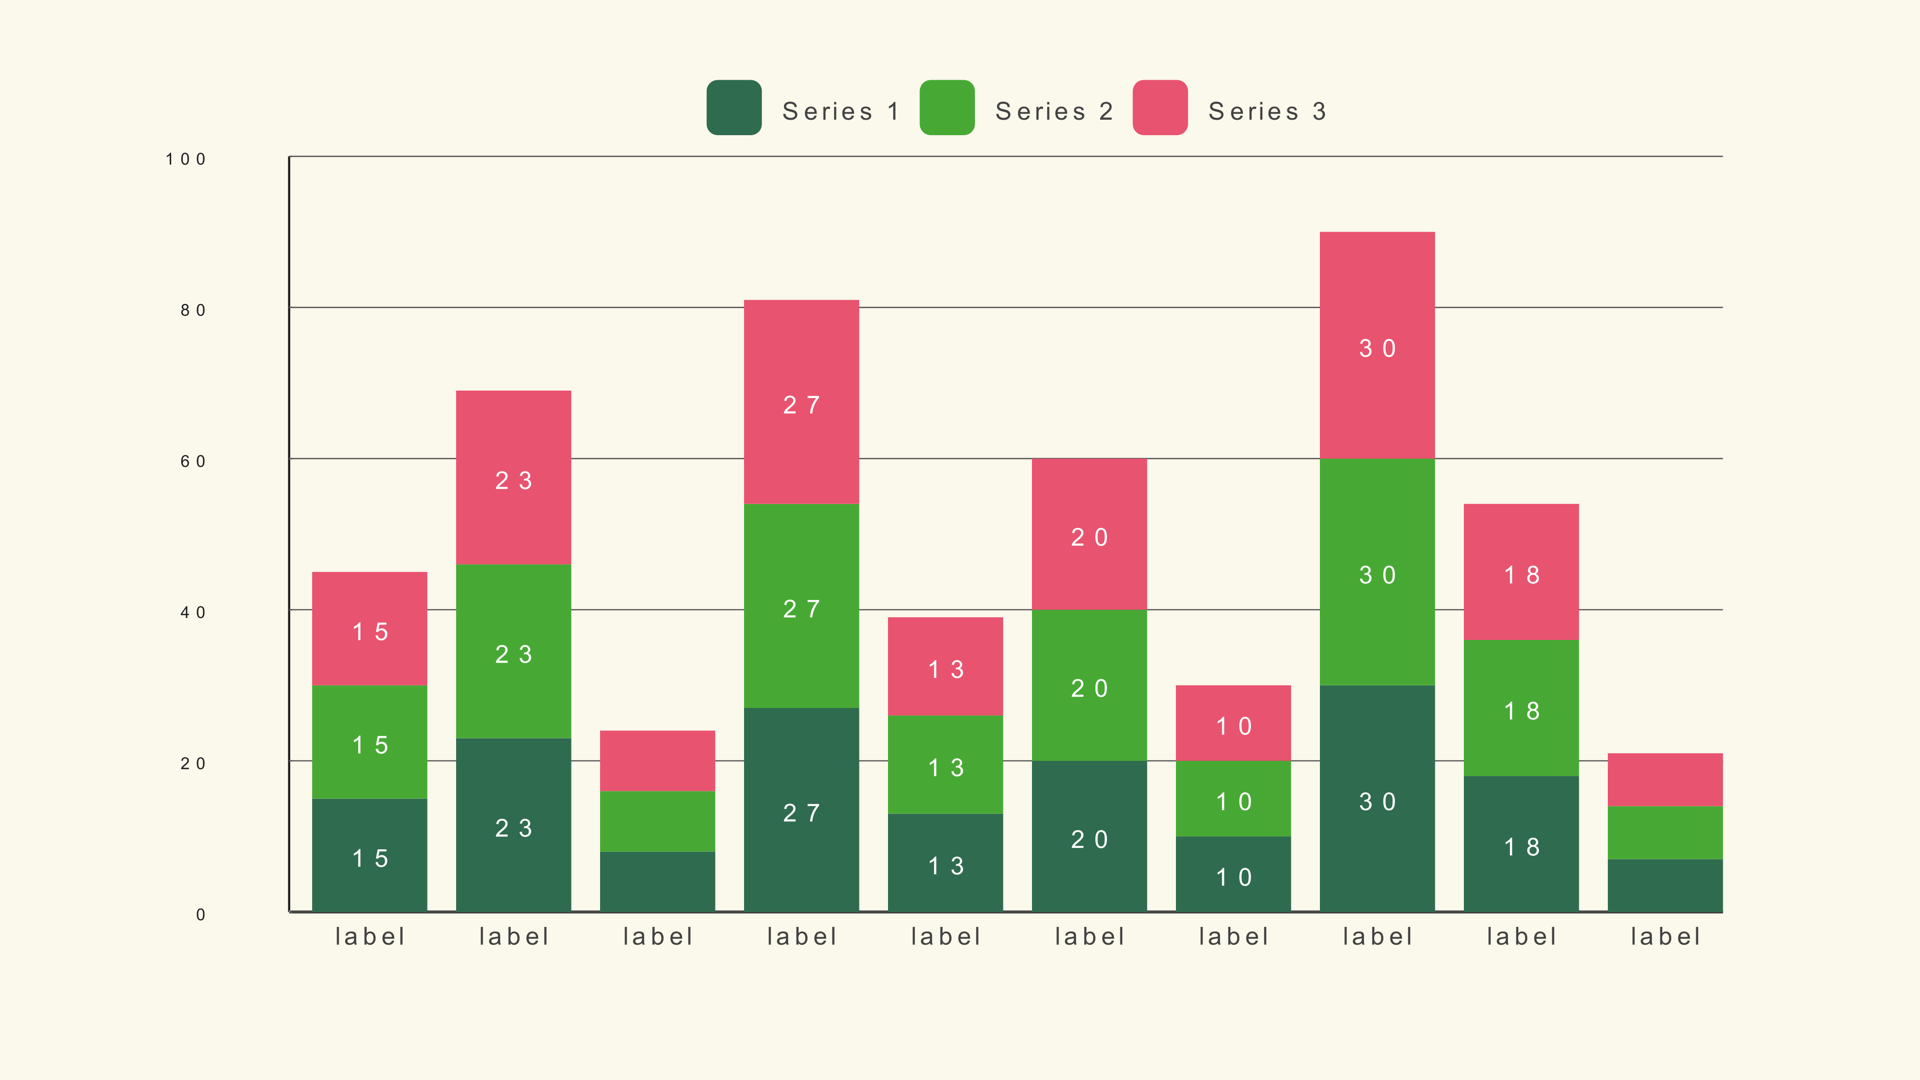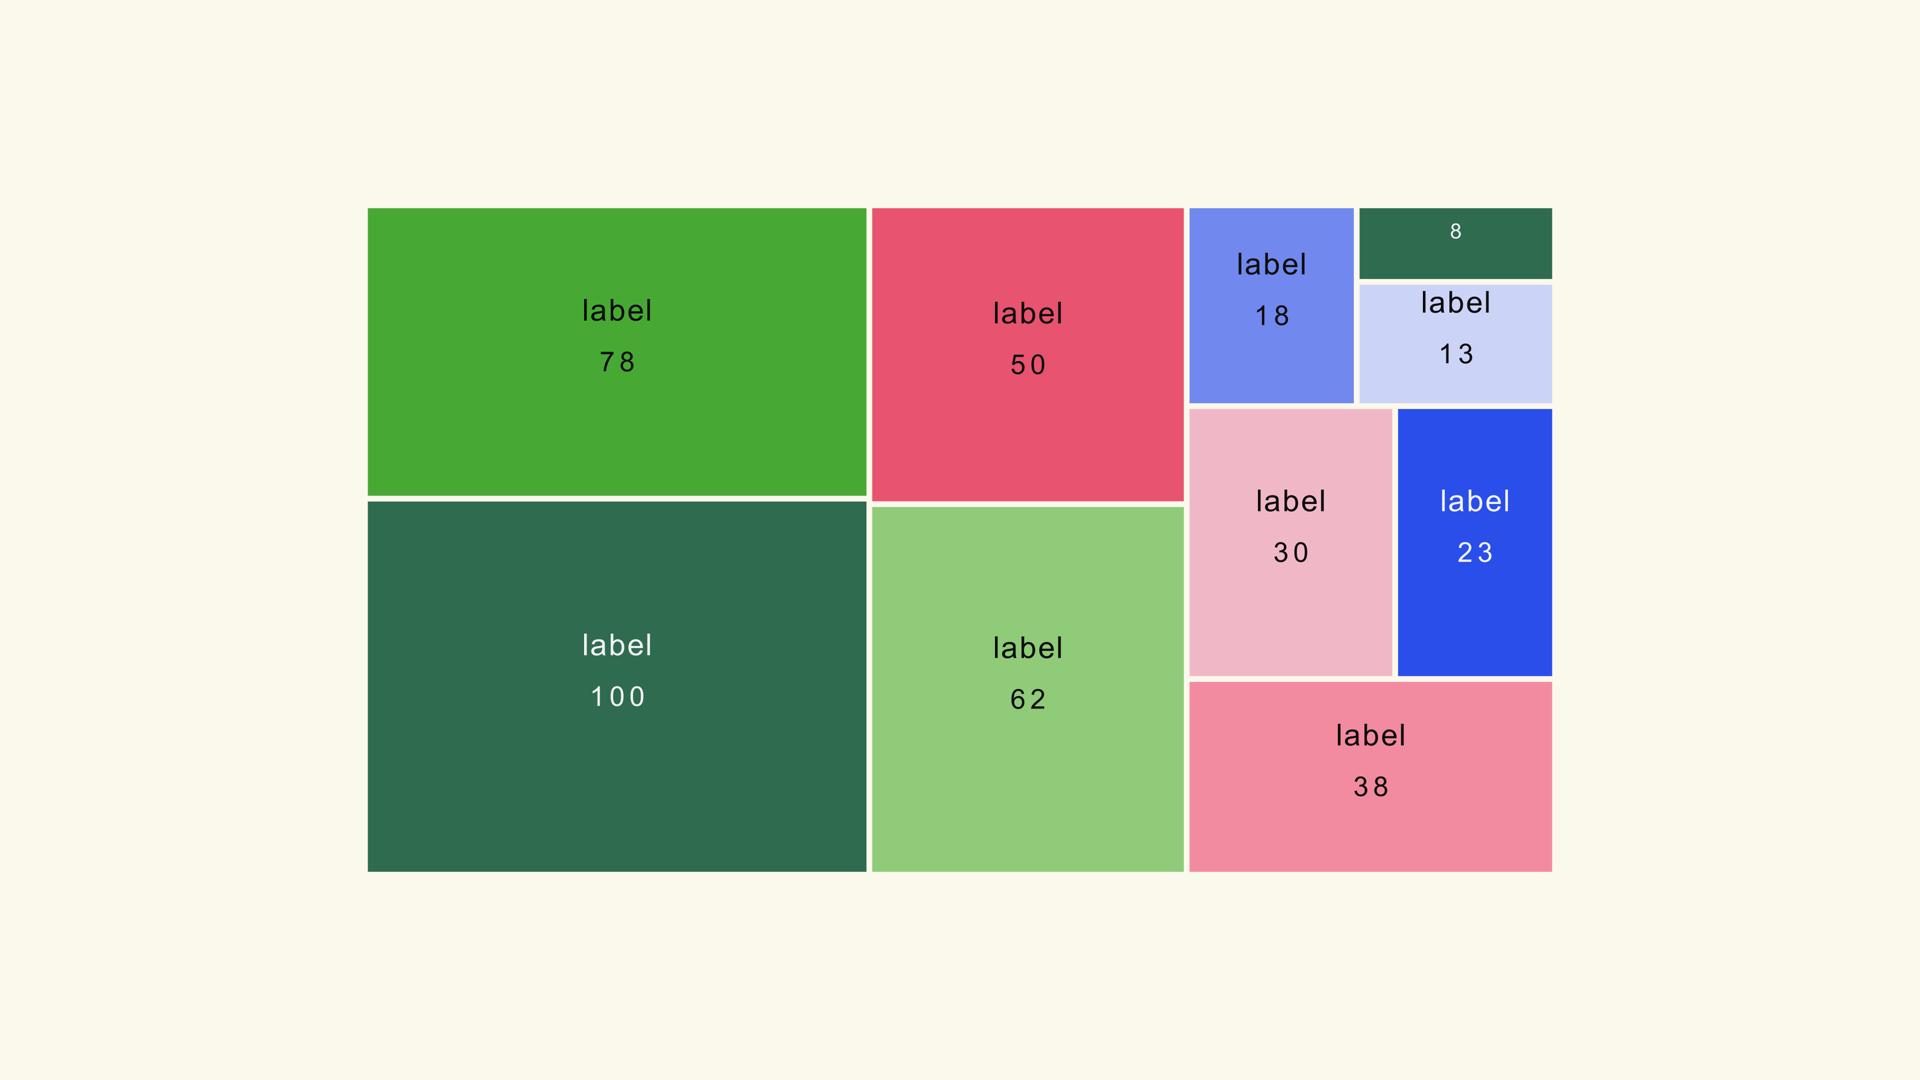
A treemap packs many categories into one frame by making each tile's area proportional to its value. It is the compact alternative to a long bar chart or a crowded pie: the viewer sees the big shapes first, then reads the labels on the tiles that carry the story.
Treemap Basic is a native Fusion generator for DaVinci Resolve. It uses a squarified layout, supports up to 100 tiles and exposes the gap, corners, labels, colors and animation in the Inspector. This guide covers the data, the layout controls and the cases where a different chart is a better fit.
When a treemap works
Use a treemap when the audience needs the overall composition and there are too many categories for a pie. Market share, budget allocation, portfolio composition and a compact category overview are all good fits. The chart is especially useful when one or two tiles dominate and the rest form the tail.
A treemap is less precise than a bar chart. Area is harder to compare than length, so it is a poor choice when the script says "ten percent larger" or when the values are close. If exact comparison matters, use bars.
The chart also earns its place when the frame is shared with a headline or a presenter. A horizontal bar chart needs a long runway for the labels; a treemap can hold the same categories in a compact rectangle. That compactness is a design advantage, not a data advantage, so keep the values simple enough that the viewer can still read the overall composition.
Prepare the data
Treemap Basic expects a label/value table. The values set the tile area and can be percentages or raw totals. The chart is flat: one row becomes one tile, so roll subcategories into a single value before import if you need a simple overview.
Category,Value
Cloud,34
Hardware,22
Services,18
Support,12
Training,8
Other,6
The sample file is treemap-basic.csv. Keep the labels short; a tile only has the area its value earns, and a long label in a small tile becomes unreadable.
Add Treemap Basic to the timeline
- Drag Treemap Basic from Effects - Generators - Noyris Charts onto a clip above your footage.
- Open Data and point CSV File at the table.
- Set Tiles to the number of rows.
- Confirm the label and value columns.
- Check that the smallest tile is still large enough for its label.
If the layout looks empty, the tile count may be lower than the row count. If the labels are missing, the label column is probably mapped to a numeric column.
Tune the tile layout
Tile Gap separates the tiles. Keep it small; the layout needs area more than decoration. Rounded Corners can soften the geometry, but a sharp default often reads better for a data graphic. The squarified layout keeps tiles close to square, which makes the sizes easier to compare.
If one tile is huge and the rest are slivers, consider grouping the small categories into "Other." The chart should show the story, not every row in the spreadsheet. A treemap with six to fifteen tiles is usually the most readable.
Labels and colors
Turn on Show Value Labels when the exact number matters. Keep the category labels for the tiles that are large enough to hold them. For very small tiles, the label may need to be dropped or moved to a callout.
Use a theme with a clear shade ramp so adjacent tiles separate without heavy borders. If you need to highlight one category, turn Apply Theme off and set that tile's color. Keep the rest of the palette consistent so the highlight reads as an exception.
Animate the tiles
A short staggered reveal brings the tiles in as a sequence. Keep the duration near one second; the viewer needs to see the full layout, not watch every tile arrive separately. The final frame should be stable and readable without motion.
If the chart is part of an explainer, consider revealing the largest tile first and letting the smaller tiles fill in around it. That mirrors the way the viewer reads the composition.
Treemap vs. other charts
Use a treemap when many categories need to fit in one frame. Use a pie chart for a small number of slices. Use a stacked bar when each category also has internal composition. Use a bar chart when exact comparison matters.
Common mistakes
- Nested data in a flat chart. Treemap Basic is one level; roll up subcategories first.
- Too many tiny tiles. The labels become unreadable.
- Using area for precise comparison. Use bars when the exact gap matters.
- A heavy border around every tile. The frame becomes a grid instead of a composition.
- Long labels in small tiles. Shorten the name or move the detail to a callout.
Next steps
Load the treemap sample and rebuild it with six tiles. Then read the Treemap Basic guide and compare the layout with the pie chart workflow.