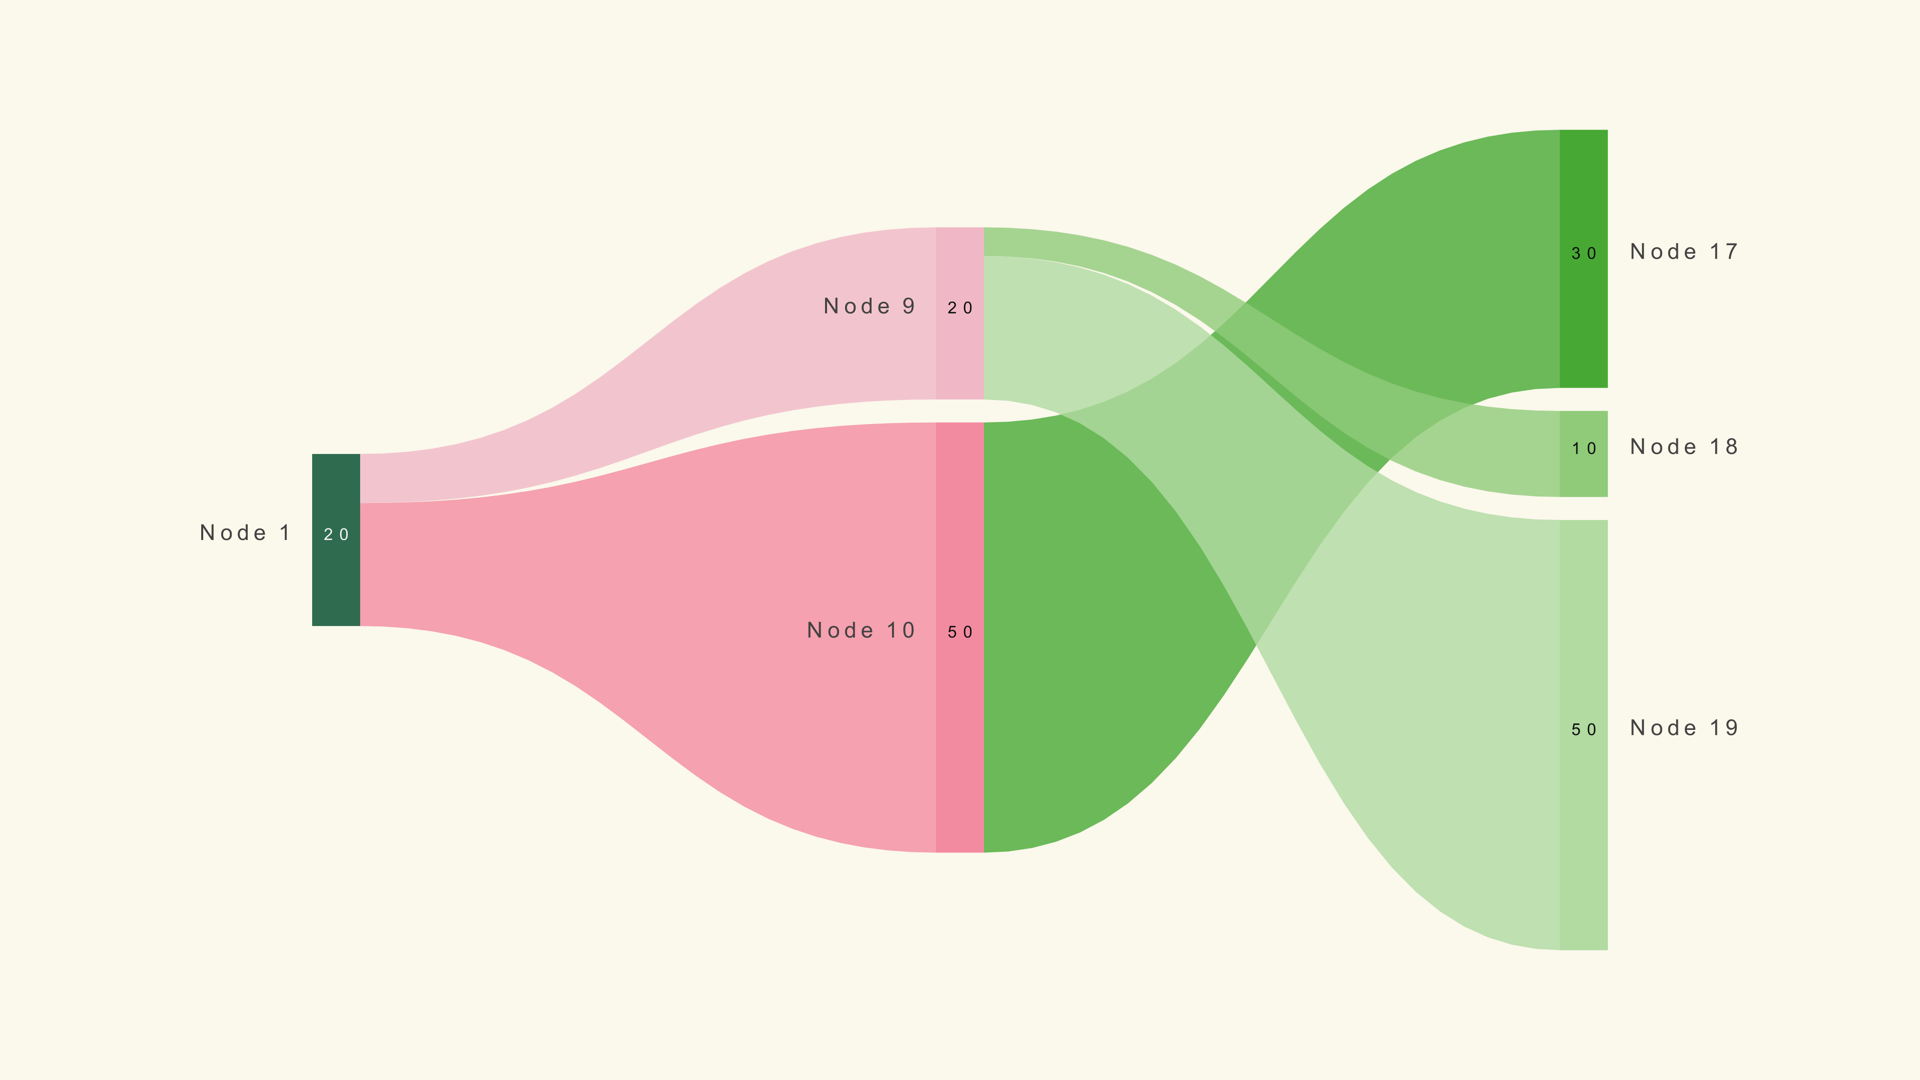
A Sankey diagram makes flow visible. A budget splits into departments, energy moves through conversion stages, or an audience branches across channels. The ribbon width shows how much volume follows each path, so the viewer can see where the flow enters, splits and leaves.
Sankey is a native Fusion generator for DaVinci Resolve. It is manual-only by design: you build a small set of nodes, give each one a flow value and connect it to a parent in the previous stage. This guide covers that structure, the layout controls and the motion that makes the flow readable.
When a Sankey works
Use a Sankey when the story is about movement between stages. The chart is especially good when a total splits into parts and those parts continue into later stages. It is not a good choice for a simple category ranking or a share of a whole at one point in time.
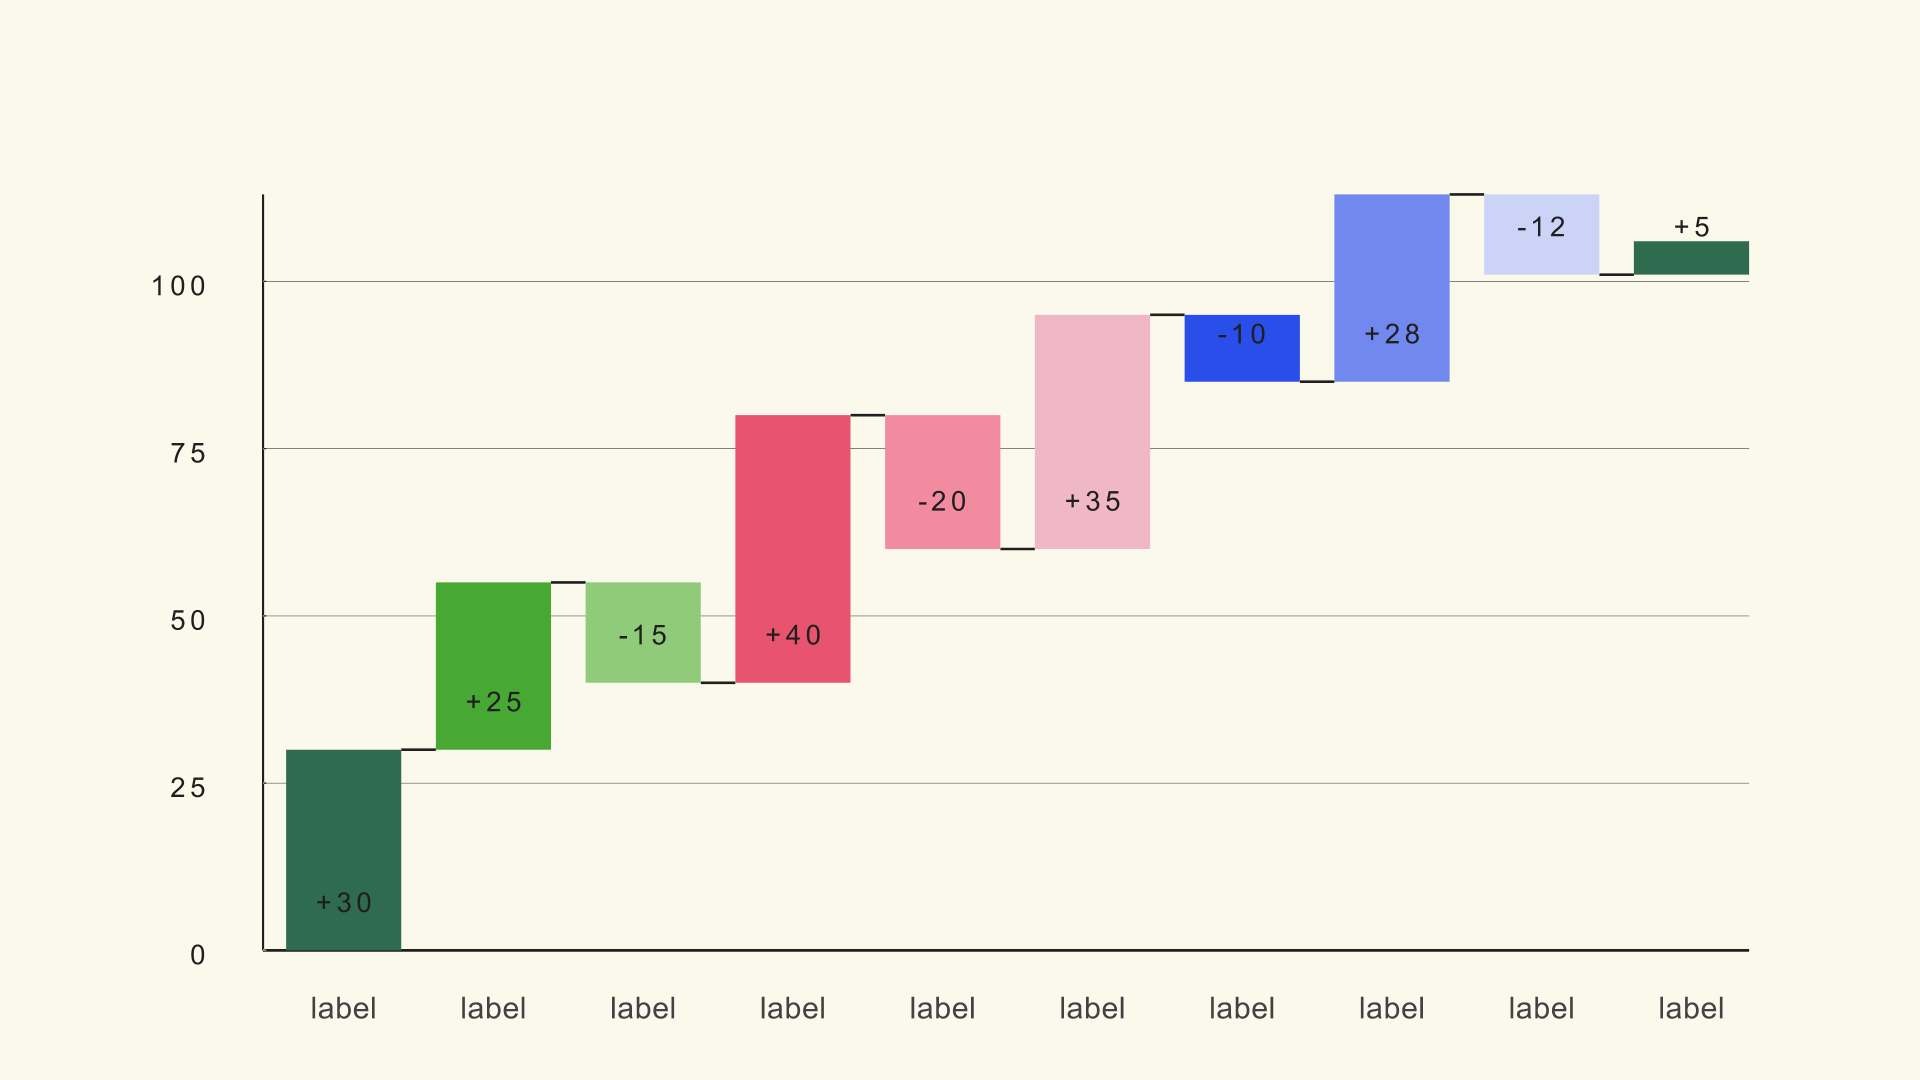
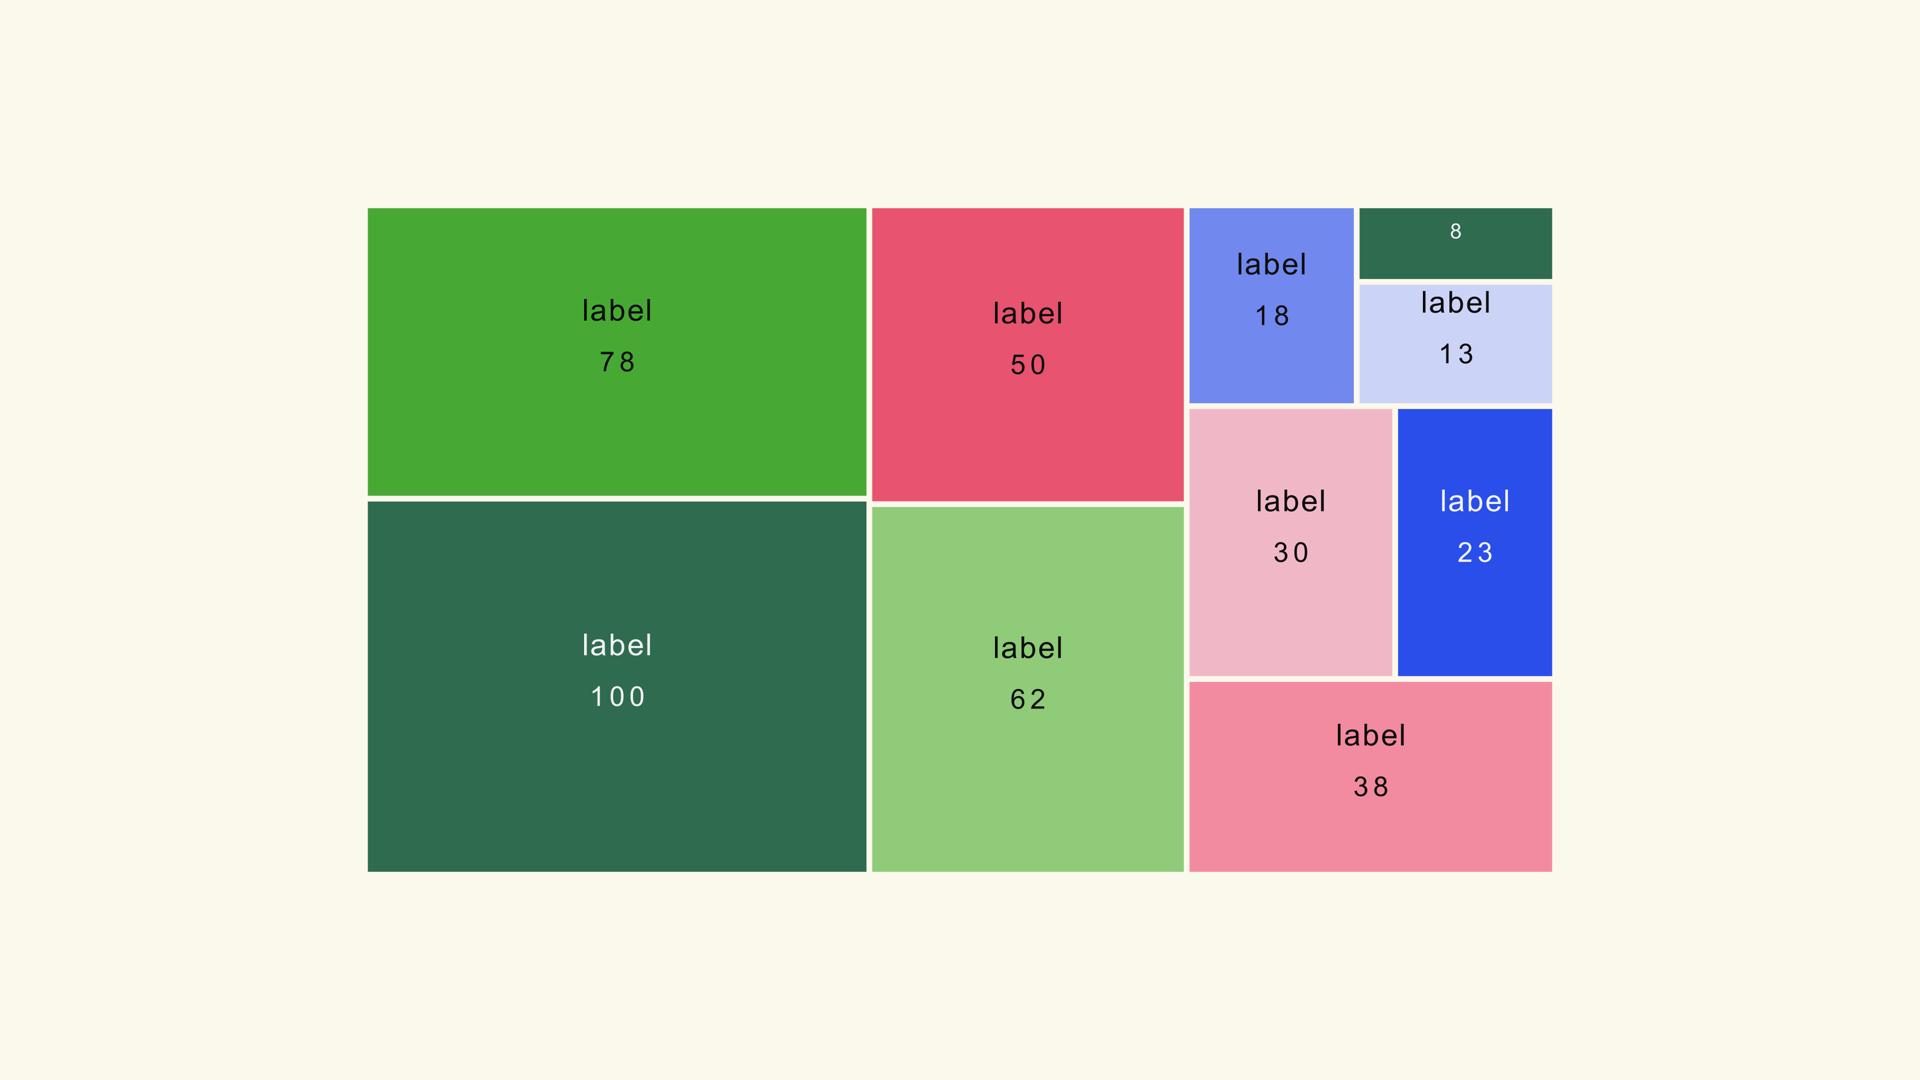
If the story is "how did revenue become profit," a waterfall is often clearer. If the story is "how is the budget split right now," a treemap or stacked bar is simpler. The Sankey earns its complexity when the paths matter.
How the generator thinks
The diagram is built from nodes and parent links. A node in the first column is an input. A node in a later column points back to the node that feeds it. The ribbon connects the parent to the node, and its width follows the node's flow value.
The generator supports up to eight stage columns. Three to five stages is usually enough for a clear story. More stages add detail but also add crossings, smaller labels and more ways for the viewer to get lost.
Build the first stage
- Drag Sankey from Effects - Generators - Noyris Charts onto a clip above your footage.
- Open Data and set Columns to the number of stages.
- Set Active Column to the first column.
- Set Nodes in Column and give each node a label and a flow value.
- Move to the next column and add nodes that point back to the first stage.
Work left to right. Building the downstream stages before the source is settled makes the parent links harder to check.
Set the links
Links From is the control that creates the ribbon. For a later node, point it at the parent in the previous stage. If the parent is missing or not adjacent, the ribbon does not draw.
Check the flow values against the parent. A child cannot carry more volume than the parent unless the data represents a different unit or a new input. If the ribbon widths look wrong, the problem is usually the flow value or the parent link, not the geometry.
Tune the layout
Auto Arrange reduces crossings while you build. Column Gap leaves room for the node labels. Ribbon Curviness controls how S-shaped the flow path is; a full curve reads as a flow, while a straight line reads as a diagram edge.
Normalize Column Heights is off by default, which keeps the ribbon widths honest to the values. Turn it on only when the visual comparison between stages matters more than the absolute scale. If you change it, say so in the caption or voiceover.
Color the flow
Color by source group so the viewer can follow a ribbon across multiple stages. Link Color can follow the source or the target; source color makes a path easier to trace. Keep the ribbon opacity below full so overlapping flows remain visible without turning into a solid block.
Use a theme with enough separation between the source colors. A Sankey with five similar blues is harder to follow than one with five distinct, muted colors.
Animate the path
Reveal the diagram by column. A draw or grow style that follows the flow from left to right tells the viewer how to read the chart. Stagger By Column keeps the stages in order instead of revealing every node at once.
Keep the animation slow enough that the viewer can follow a single ribbon from source to target. A Sankey is a reading graphic; the motion should not outrun the eye.
Common mistakes
- Too many stages. The paths cross and the labels shrink.
- A missing parent. The ribbon for that node disappears.
- Inconsistent units. The ribbon widths compare values that are not comparable.
- Full-opacity ribbons. Overlaps hide the flow structure.
- Animating all nodes at once. The viewer cannot follow the path.
Next steps
Read the Sankey guide for the full node and layout reference, then compare the flow story with the waterfall chart and the treemap.