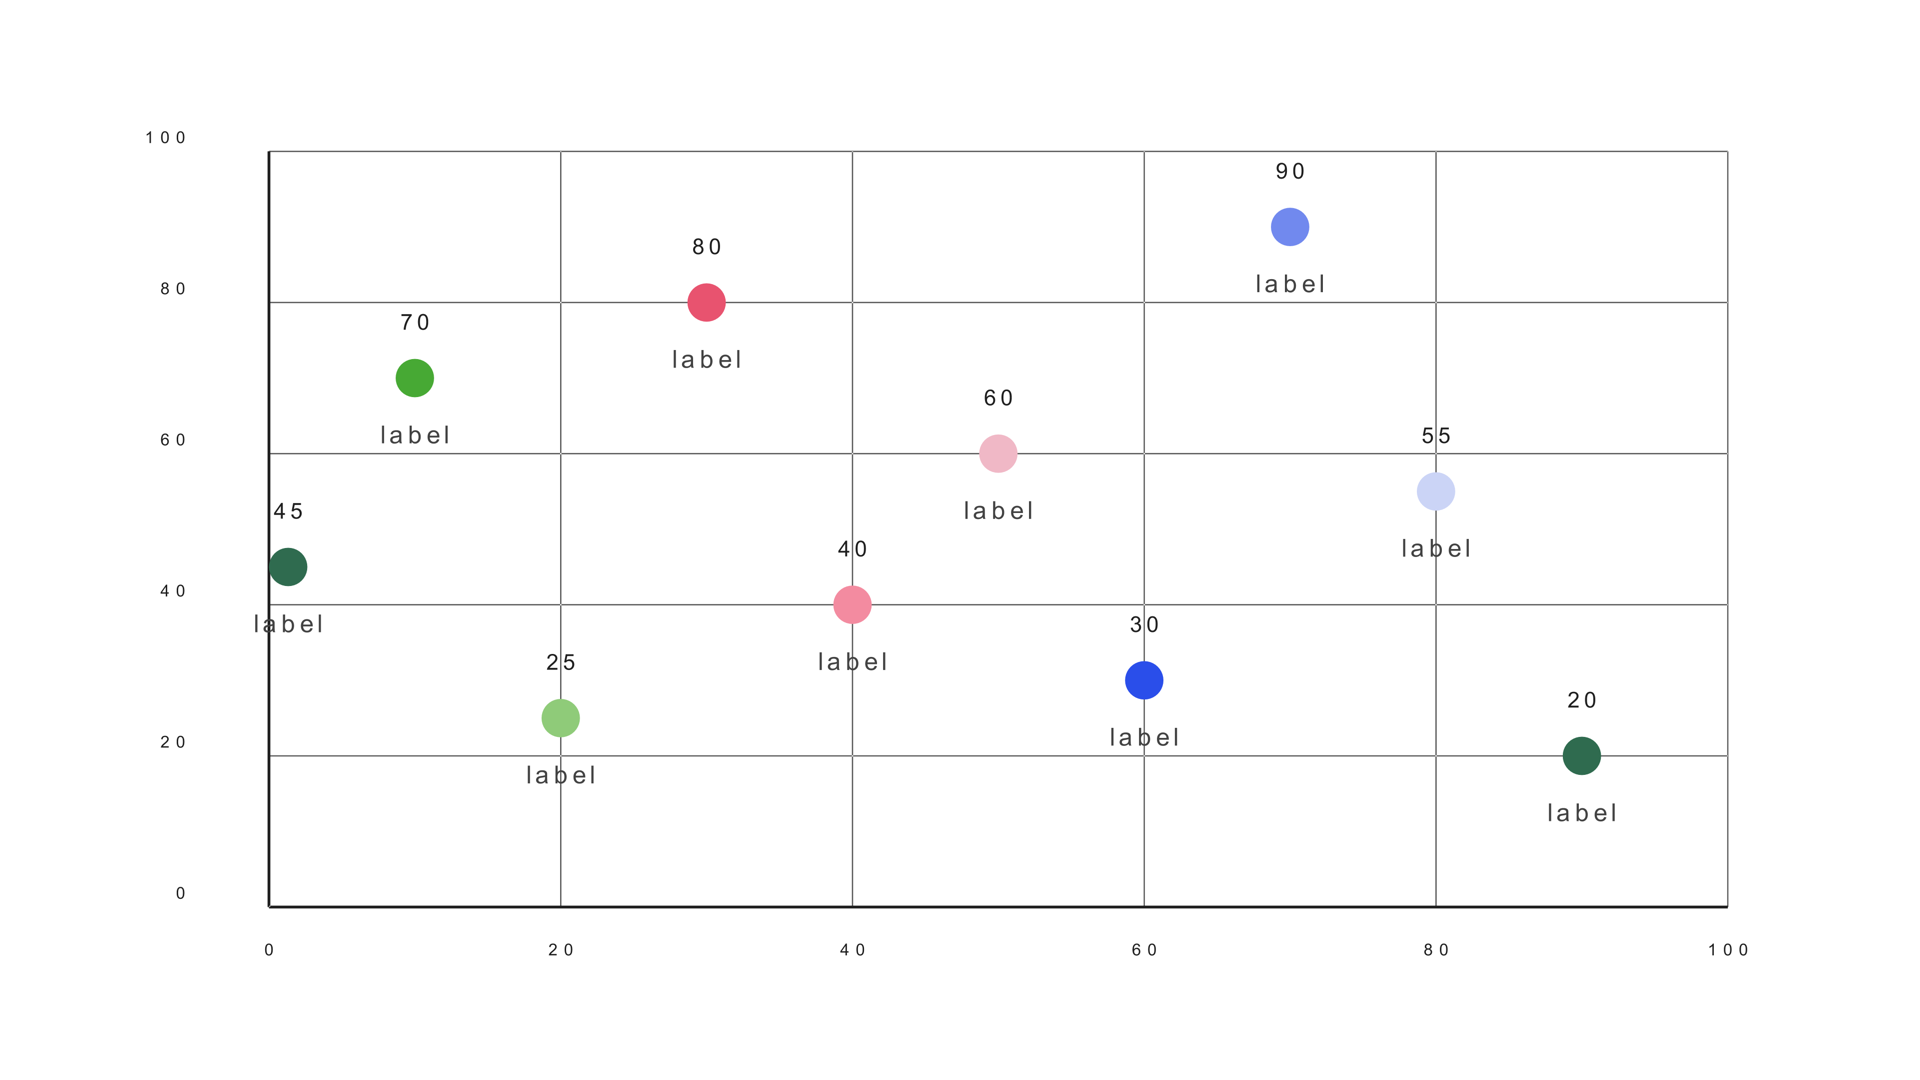
A scatter plot puts two numbers on two axes and lets the viewer see the relationship. Are the points clustered, spread out, rising together or moving in opposite directions? The shape of the cloud is the story, and a single outlier can be the most important mark on screen.
Scatter Plot is a native Fusion generator for DaVinci Resolve. It reads a label/Y/X CSV, maps the points into a bounded plot rectangle and uses fixed-radius markers. This guide covers the data, the axes, the marker settings and the labels that make the plot readable on video.
When a scatter plot works
Use a scatter plot when two numeric variables need to be compared across many subjects. Risk versus return, income versus life expectancy, price versus demand and country comparisons are all natural fits. The chart shows the distribution rather than a ranked list.
A scatter plot is not a time series. If one axis is time, a line chart is usually clearer. It is also not a ranking; if the audience needs to know which subject is first, sort a bar chart instead.
Prepare the X/Y data
Scatter Plot expects a label, a Y value and an X value. The Y value is read from the Value column and X from the next numeric column. Keep the rows in a consistent order so the labels match the points.
Company,Growth,Size
Alpha,72,18
Beta,58,34
Gamma,91,52
Delta,44,61
Epsilon,83,77
The sample file is scatter-plot.csv. Check the ranges before loading: a single value outside the axis maximum will be clipped or compressed against the edge.
Load and place the points
- Drag Scatter Plot from Effects - Generators - Noyris Charts onto a clip above your footage.
- Open Data and point CSV File at the table.
- Set Points to the number of rows.
- Confirm Label 0, Y 1 and X 2.
- Check that the points land inside the plot rectangle.
If the points form a diagonal line from bottom-left to top-right, the Y and X columns may be swapped. The sample expects Y before X, not the other way around.
Set both axes
X Axis Max and Y Axis Max set the top of each scale. Choose values that frame the data with a little padding. A point on the exact maximum can look clipped, so round up to a clean number above the largest value.
Keep the axes consistent across a sequence of charts. If the same subject appears in two shots with different scales, the viewer cannot compare the positions. If one axis starts at zero and the other does not, say so in the labels or caption.
Style the markers
Point Radius controls the marker size. Keep it small enough that overlapping points still read as a cluster. Point Shape can be a circle, triangle, square or X. Use one shape for the whole set unless the shape carries a category distinction.
The default single color is usually right. If you need to highlight an outlier, turn Apply Theme off and set the per-point color for that mark. A second color can separate two groups, but more than two colors turns the plot into a legend exercise.
Label the story
Category labels can make or break a scatter plot. Labeling every point creates a wall of text. Label the outliers, the points the voiceover mentions and the two or three subjects the audience needs to remember.
Value labels are rarely needed in a scatter plot because the position already carries the values. If the exact numbers matter, use a callout or a table. The plot is for the relationship, not the precise coordinates.
Animate the points
A short staggered reveal helps the viewer see the distribution build. A fade or grow is usually enough. Keep the stagger small; a long sequence makes the plot feel like a slideshow rather than a single distribution.
Check the final frame with the labels on. The plot should read without motion, and the labels should not overlap the points they describe.
Scatter vs. bubble
Use a scatter plot when position alone carries the meaning. Use a bubble chart when marker size needs to encode a third value. Bubble charts add information but also add a comparison problem: humans are not good at comparing circle areas, so use them when the size difference is large and the story is simple.
Common mistakes
- Swapped X and Y columns. The relationship appears inverted.
- Labeling every point. The labels cover the data.
- A clipped outlier. The axis maximum is too low.
- Using a scatter for time. A line chart is clearer when one axis is time.
- Too many colors. The plot becomes a category puzzle.
Next steps
Load the scatter sample and rebuild it with only two labels. Then read the Scatter Plot guide and compare it with the Bubble chart.