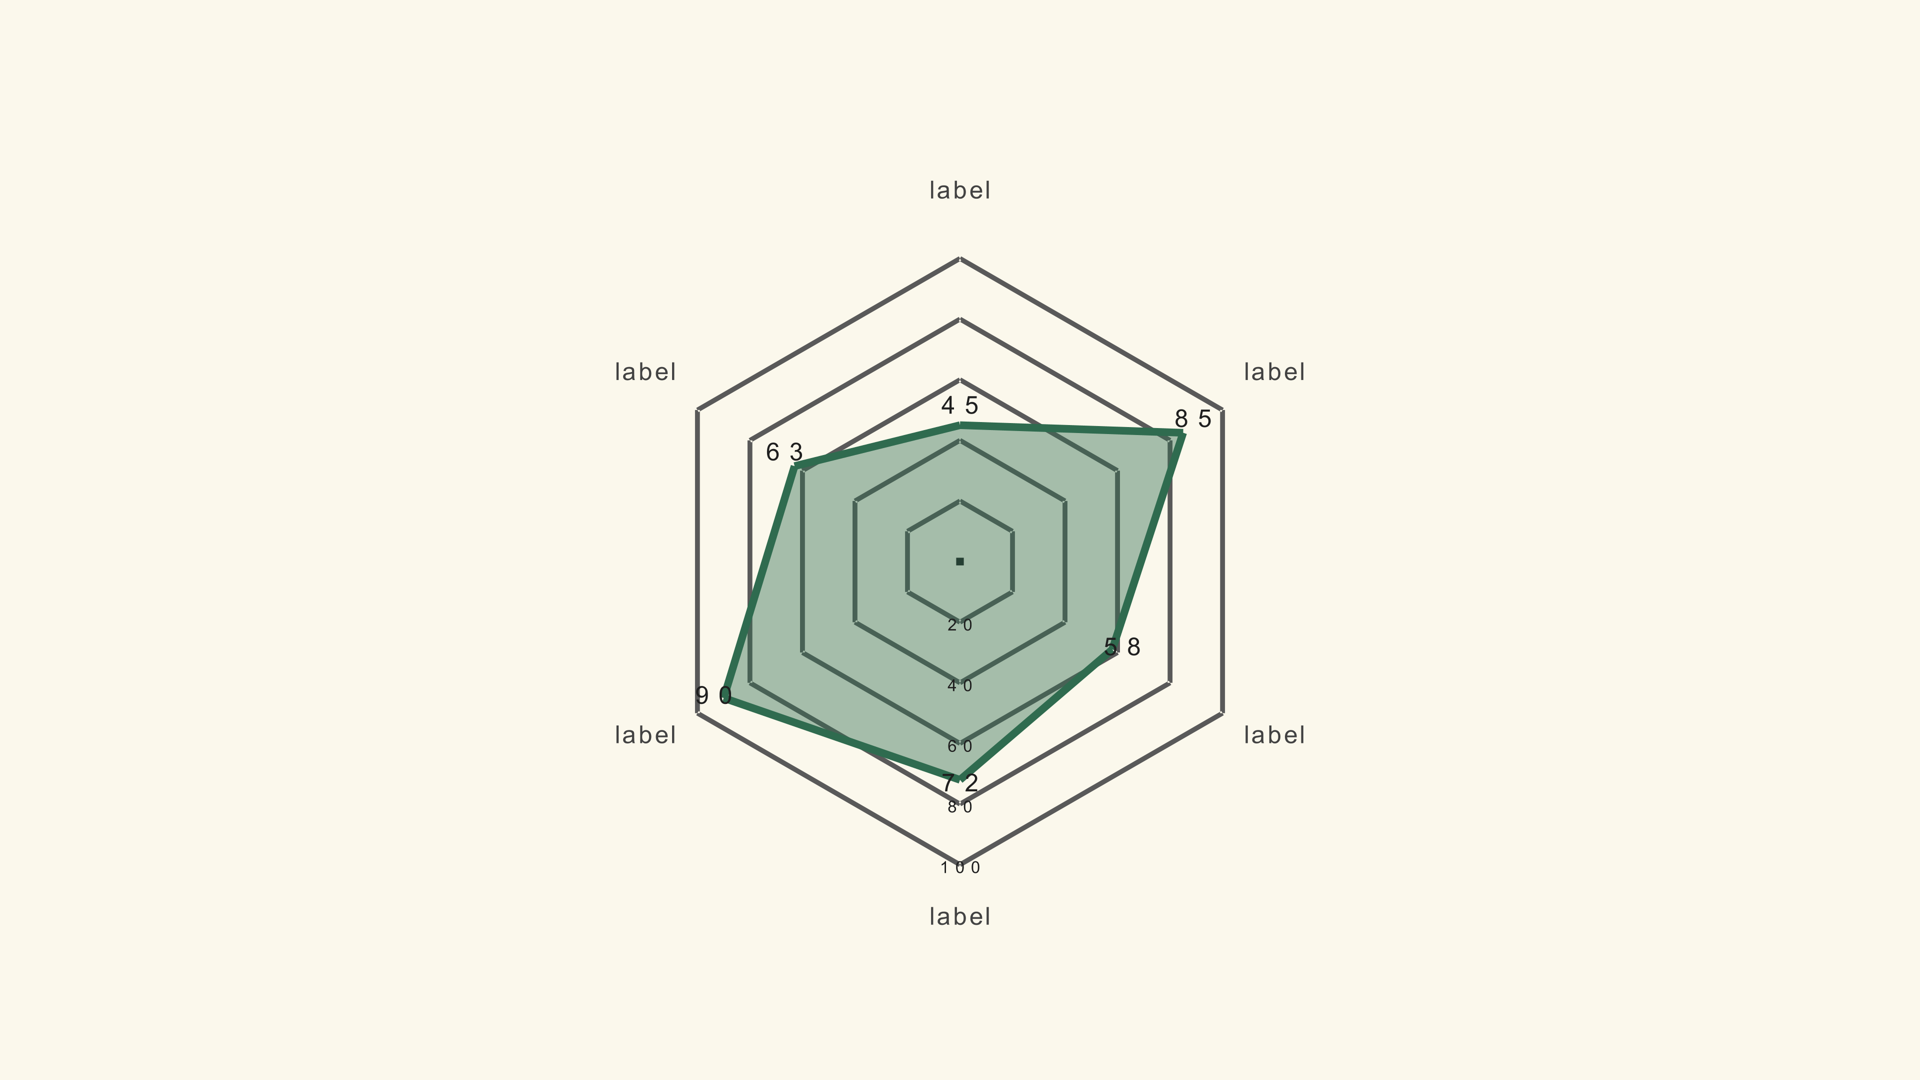
A radar chart places several metrics around a circle and connects the values into a shape. It is a compact way to show a profile: a product's strengths, a team's performance, a country's indicators or a player's stats. The shape is the message, not the exact number on each axis.
Radar Basic is a native Fusion generator for DaVinci Resolve. It reads a label/value CSV, draws a filled polygon and exposes the axes, scale, fill, grid and animation in the Inspector. This guide covers the data, the scale rule and the design choices that keep the shape honest.
When a radar chart works
Use a radar when the audience needs a profile rather than a ranking. It works when the metrics are on a comparable scale, the number of axes is small and the story is about the overall shape. A product that is strong on speed and price but weak on support is a natural radar story.
Radar charts are poor at precise comparison. The angles and the area make small differences hard to judge. If the script says "twelve percent better," use a bar chart. If the script says "this profile is balanced," the radar can work.
Prepare the data
Radar Basic expects a label/value table. Each row becomes one axis. The values should share a scale, or be normalized before import so that a value of 80 means the same thing on every axis.
Metric,Score
Speed,82
Price,64
Support,48
Reliability,76
Features,70
Ease of use,58
Keep the axis labels short. A radar with long labels needs a smaller chart or fewer axes. The labels sit around the outside of the shape, where space is tight.
Load the radar chart
- Drag Radar Basic from Effects - Generators - Noyris Charts onto a clip above your footage.
- Open Data and point CSV File at the table.
- Set Axes to the number of rows.
- Confirm the label and value columns.
- Check that the shape closes cleanly around the circle.
If the polygon looks lopsided, the value order may not match the axis order. The generator reads rows in order around the circle, so the CSV order is the axis order.
Fix the scale
Chart Max sets the outer edge of the radar. Every axis uses the same scale, so a value of 100 reaches the edge and a value of 50 reaches halfway. If the metrics use different units, normalize them before import or the shape will compare things that are not comparable.
Keep Chart Max fixed across a series. If one chart uses 100 and the next uses 50, the same profile will look twice as large in the second chart. The shape is already an abstraction; a moving scale makes it misleading.
Style the fill and grid
The fill makes the shape readable, but it can also hide the grid. Keep the fill opacity low enough that the concentric rings remain visible. If the chart sits over footage, turn the background card off and increase the stroke contrast.
Use a single accent color for the fill and stroke. A radar with a different color on every axis looks like a pie chart and loses the profile reading. If you need to highlight one metric, do it with a label or a callout, not with a rainbow.
Labels and axes
Keep the axis labels horizontal when possible. If the chart is small, reduce the number of axes before you rotate the labels. The value labels can be turned off when the shape is the story; exact numbers are better in a table or a bar chart.
The grid provides the reference for the values. Keep it subtle. A radar chart already has a lot of geometry; a heavy grid makes the frame busy.
Animate the shape
A draw or ring-build reveal follows the circular geometry. A grow or fade is simpler and works when the chart is small. Keep the animation short and let the final shape hold long enough to read.
For a multi-series radar, reveal the series one at a time so the viewer can compare the profiles. The Radar Multi generator supports up to five series and has its own series controls.
Radar vs. other charts
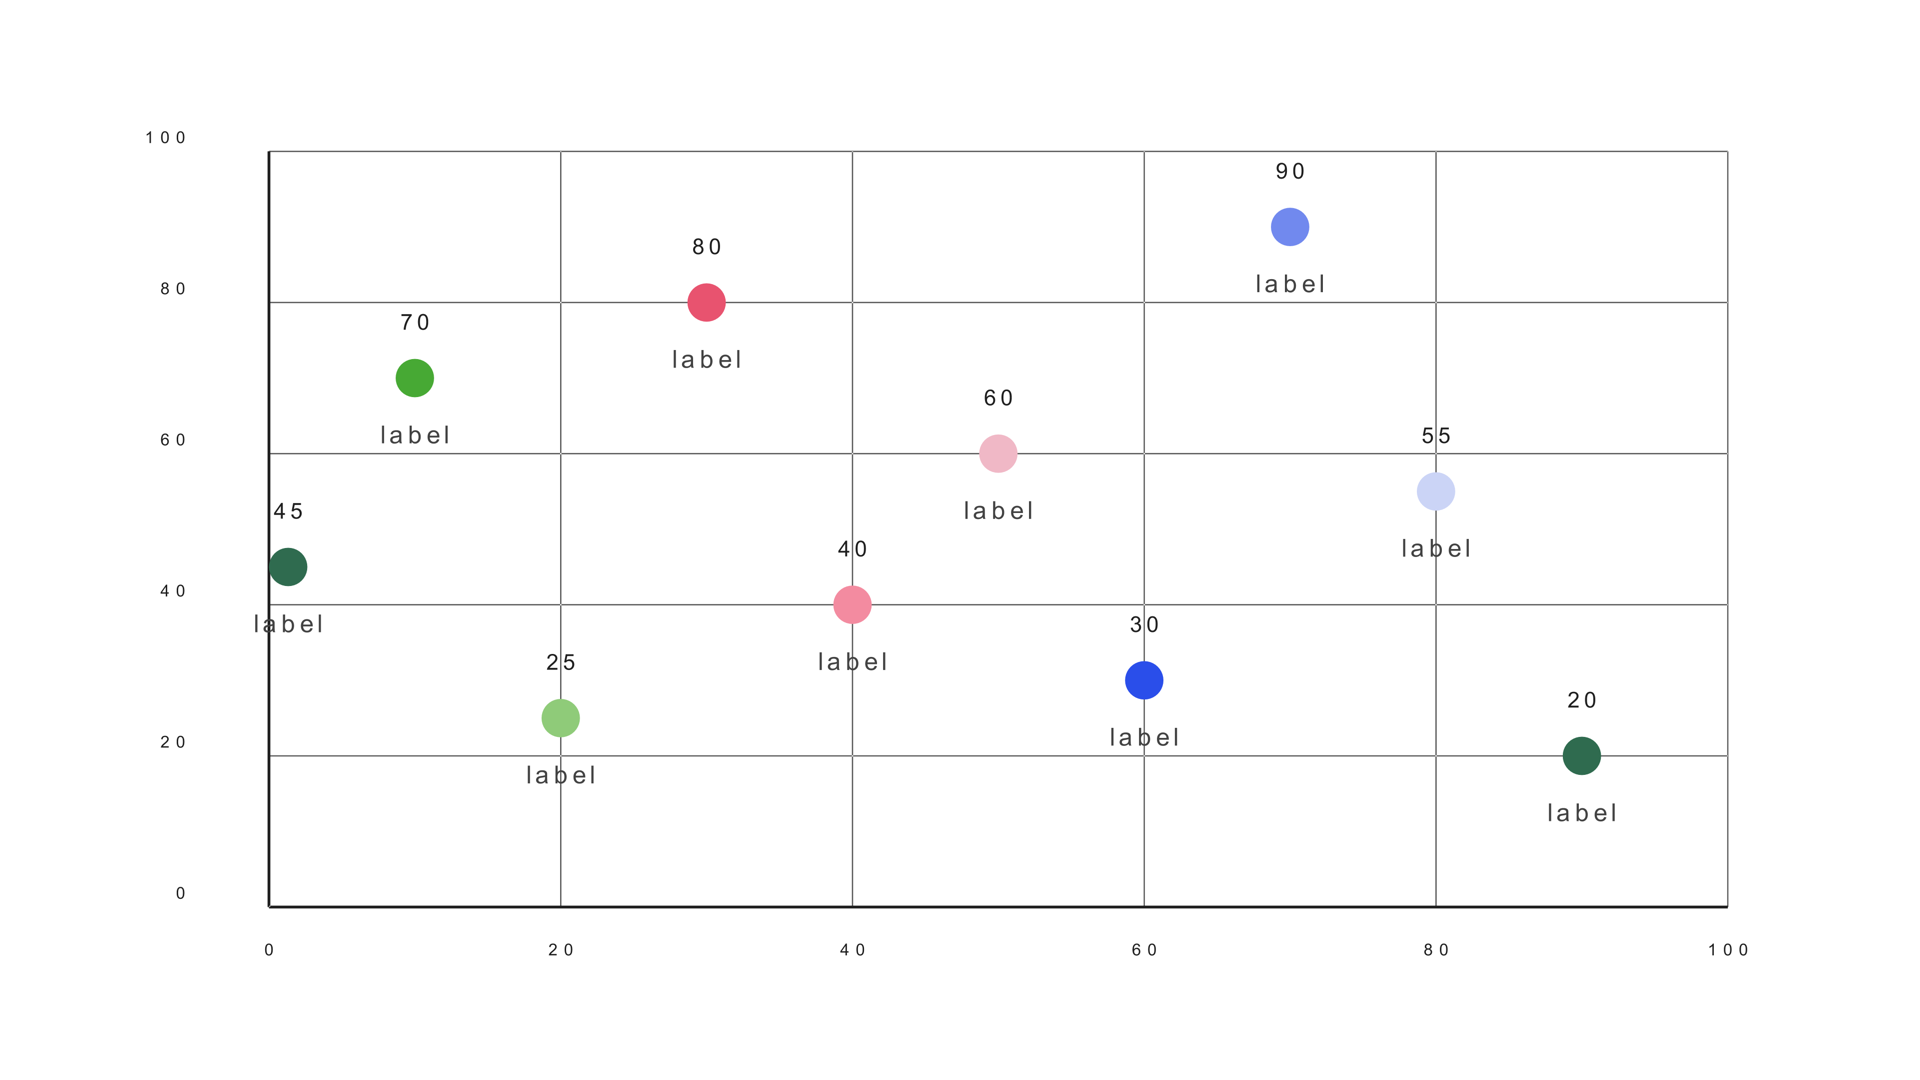
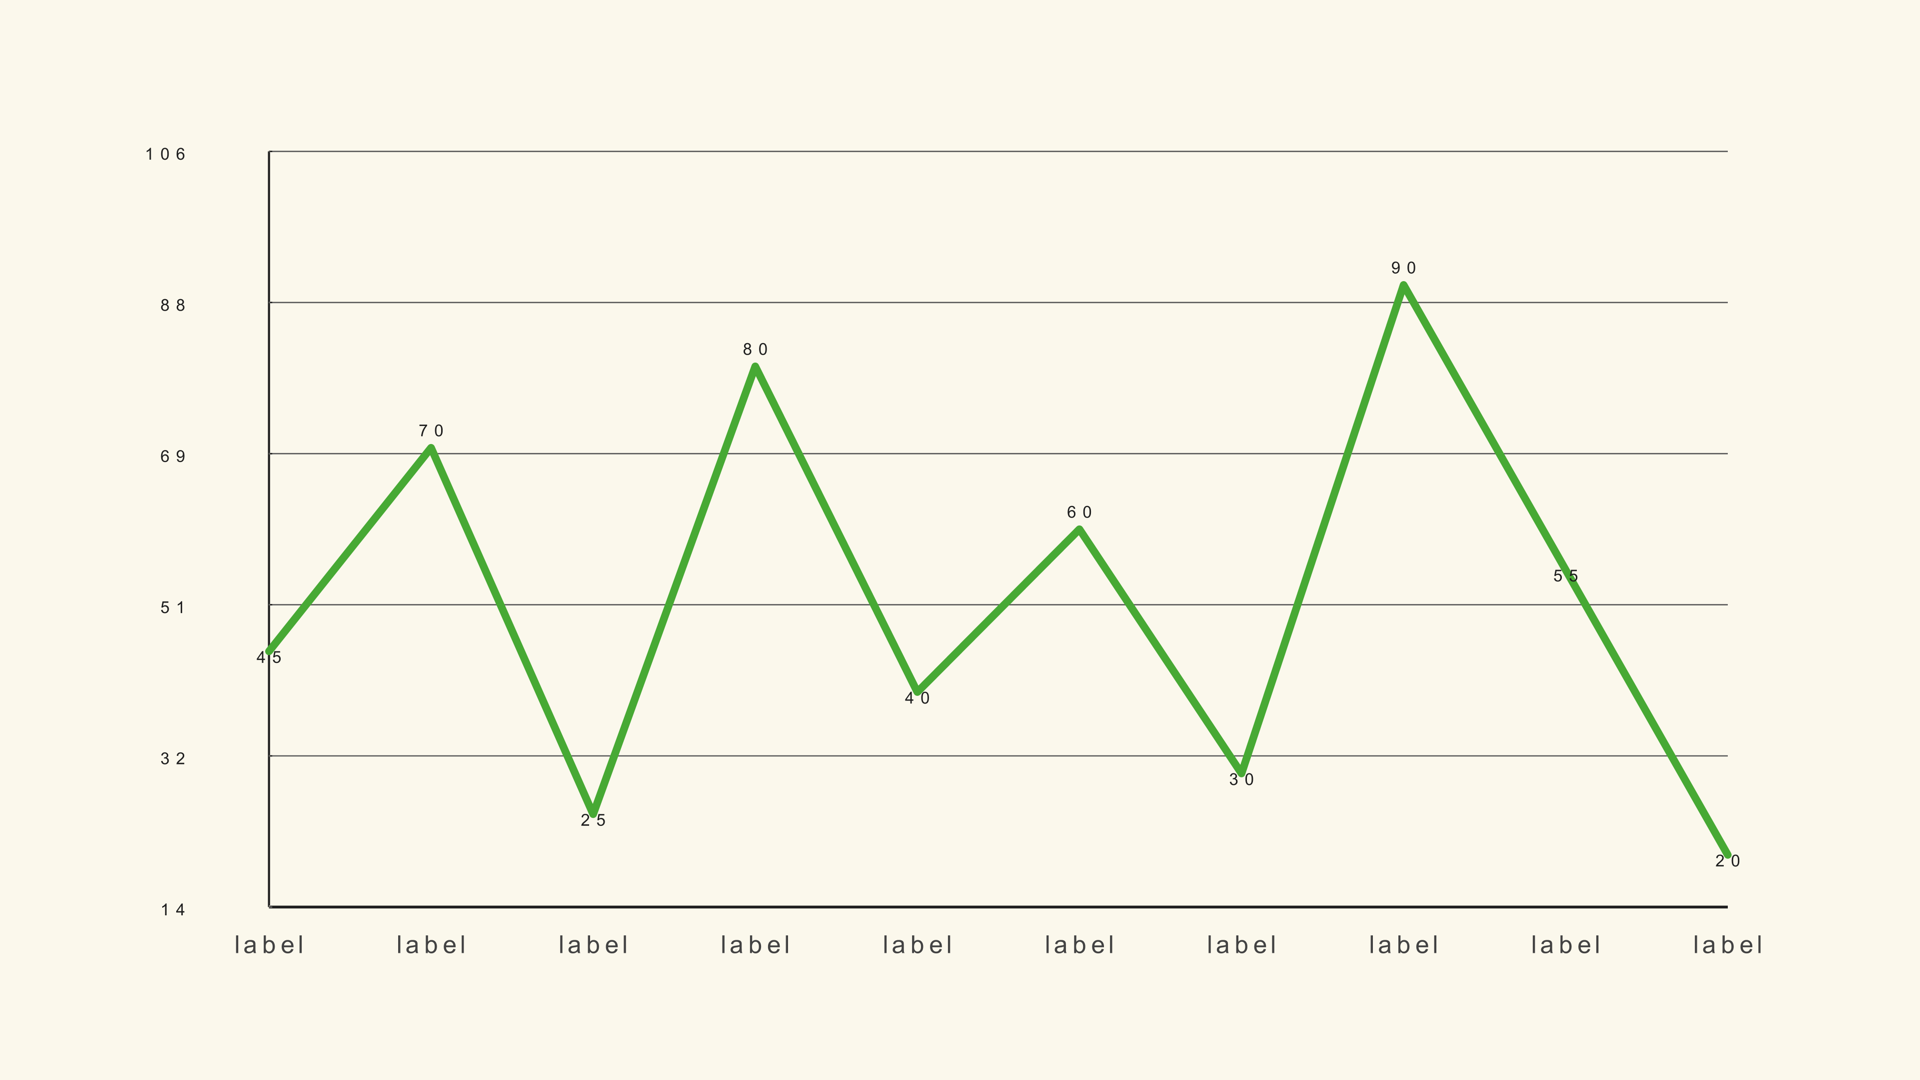
Use a radar for a profile across a few comparable metrics. Use a line graph for a trend over time. Use a bar chart for an exact ranking. Use a scatter plot when two numeric variables need to be compared.
Common mistakes
- Different units on different axes. The shape compares incompatible numbers.
- Too many axes. The labels collide and the shape becomes noise.
- A moving Chart Max. The same profile changes size between shots.
- Full-opacity fill. The grid and overlapping series disappear.
- Using a radar for precise values. Use bars when the exact gap matters.
Next steps
Read the Radar Basic guide for the full control list, then compare it with Radar Multi if you need more than one profile. The CSV guide covers the column mapping.