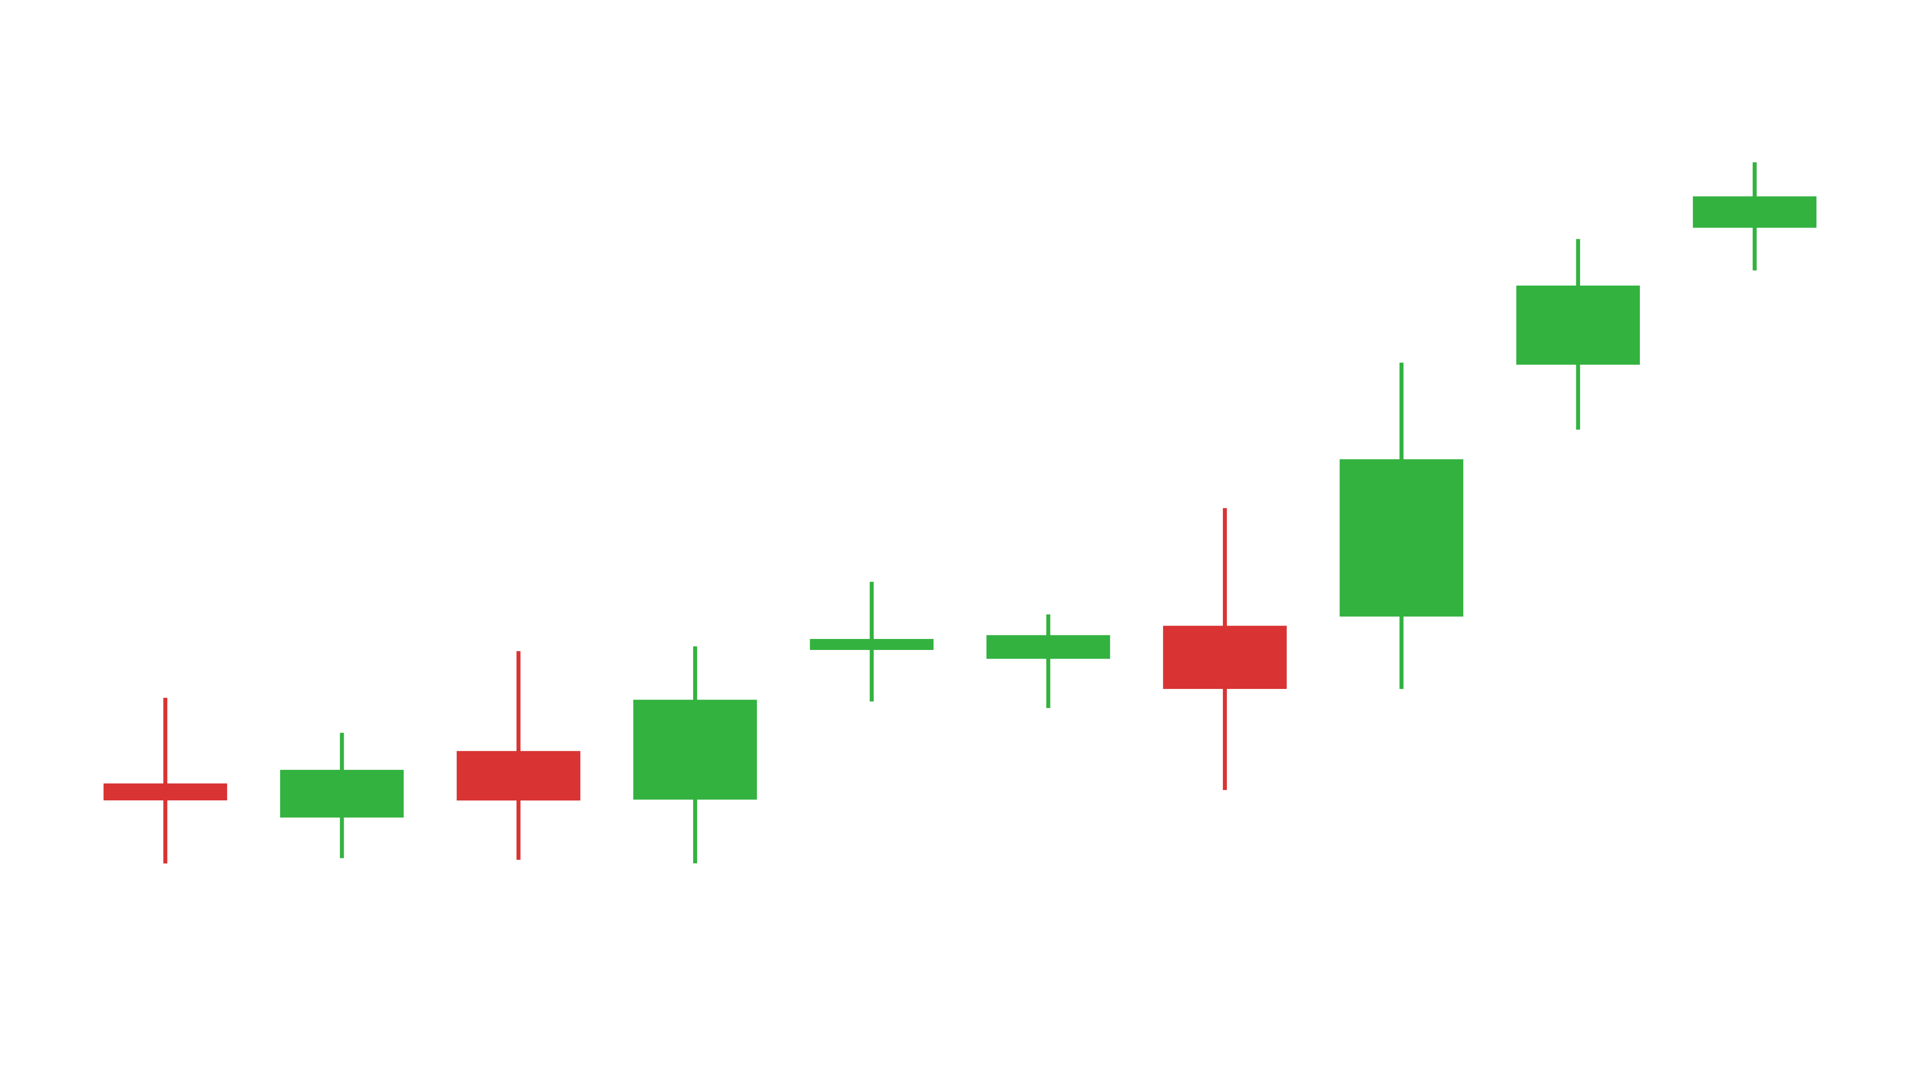
A candlestick chart is a compact record of market movement. Each candle shows an open, a close and, in the fuller version, the high and low range around them. The color tells the viewer whether the period closed up or down; the shape tells them how much the price moved.
Noyris Charts includes two native Fusion generators for DaVinci Resolve: Candle Body for the open-close body and Candle Wick for the full OHLC shape. Both render in Resolve Free and Studio and stay editable on the timeline. This guide covers the data, the price window and the visual choices that keep a market chart readable in a video edit.
Candle Body vs. Candle Wick
Candle Body draws only the open-to-close rectangle. It is the cleaner, more documentary look: no wicks, no grid, no axes. Use it when the direction of the session is enough and the high/low range would add clutter.
Candle Wick adds the high and low wicks, giving the full OHLC shape. Use it when volatility, rejection or the trading range is part of the story. The wick is often the most interesting part of a market graphic, especially around a news event.
Prepare the OHLC data
Candle Wick expects four numeric columns in this order: open, high, low and close. Each row becomes one candle. The x position is the row number, so the chart reads as a sequence even without dates.
Open,High,Low,Close
102.4,106.8,101.2,105.6
105.6,108.1,104.3,104.9
104.9,107.2,103.8,106.7
106.7,109.4,105.1,108.2
The sample files are candle-body.csv and candle-wick.csv. The high must be at or above the open and close, and the low must be at or below them. If those rules are broken, the wick will not represent the real range.
Load the candles into Resolve
- Drag Candle Wick from Effects - Generators - Noyris Charts onto a clip above your footage.
- Open Data and point CSV File at the OHLC table.
- Keep Header Row First off if the sample-style file has no header.
- Confirm Open 0, High 1, Low 2 and Close 3.
- Set Points to the number of candles you want to draw.
If the candles are all the same color, the close column is probably mapped to the wrong index. If the wicks are missing, check that the high and low columns are mapped and that the values are outside the body range.
Frame the price window
Fit to Data uses the actual high/low range, which is almost always the right starting point for a market chart. Turn it off when you need a fixed price window across several shots, then set Y Axis Min and Y Axis Max deliberately.
The X-axis controls isolate the candles that matter. X Axis Min sets the first candle; X Axis Max set to 0 uses all loaded candles. If the chart is part of an event explainer, frame a window around the event rather than showing a year of price action in a two-second shot.
Set the candle width
Candle Width controls the body width; Candle Height scales the body vertically. Candle Gap adds space between candles. A gap of zero keeps a continuous market sequence; a small gap can help when the chart is projected or compressed.
For a clean documentary look, keep the bodies thin enough that the wicks remain visible. If the bodies are too wide, the chart becomes a solid block of color and the high/low information disappears.
Choose the bull and bear colors
Use a restrained pair of colors that stay distinguishable after video compression. A bright green and a bright red on a dark background can vibrate; a muted green and red often read better. Keep the two colors close in brightness so the wick shapes, not just the hue, carry the information.
If the chart sits over footage, turn the background card off and add a subtle shadow in the edit. If the chart is a full-frame graphic, a dark background makes the wicks and bodies read clearly.
Animate the sequence
Reveal the candles in order. A left-to-right grow or sweep follows the time sequence and helps the viewer understand that each candle is a new period. Keep the duration near one second for a short sequence and lengthen it for a longer market story.
Check the final frame before rendering. The last candle should be fully settled and the price window should still include the highest high and lowest low. If the reveal ends on a clipped candle, adjust the Y-axis range.
Candlesticks vs. a line chart
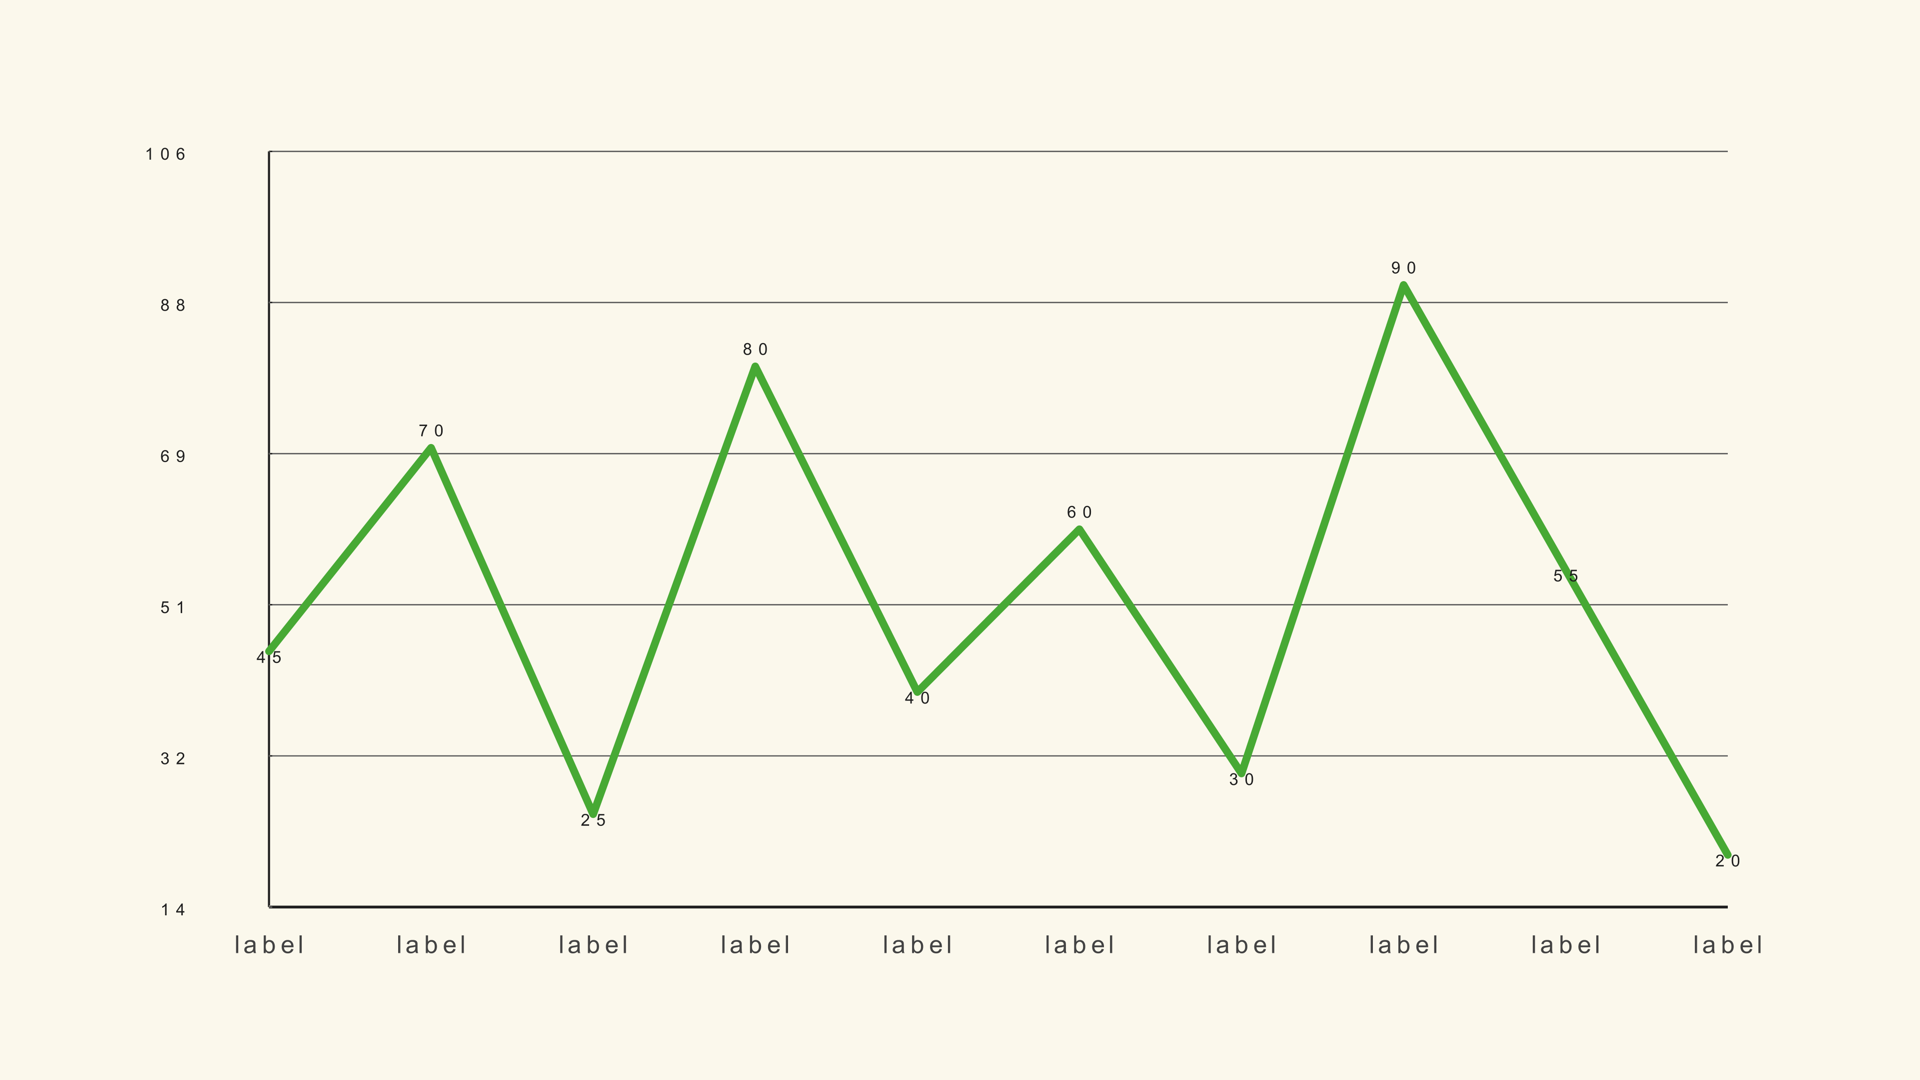
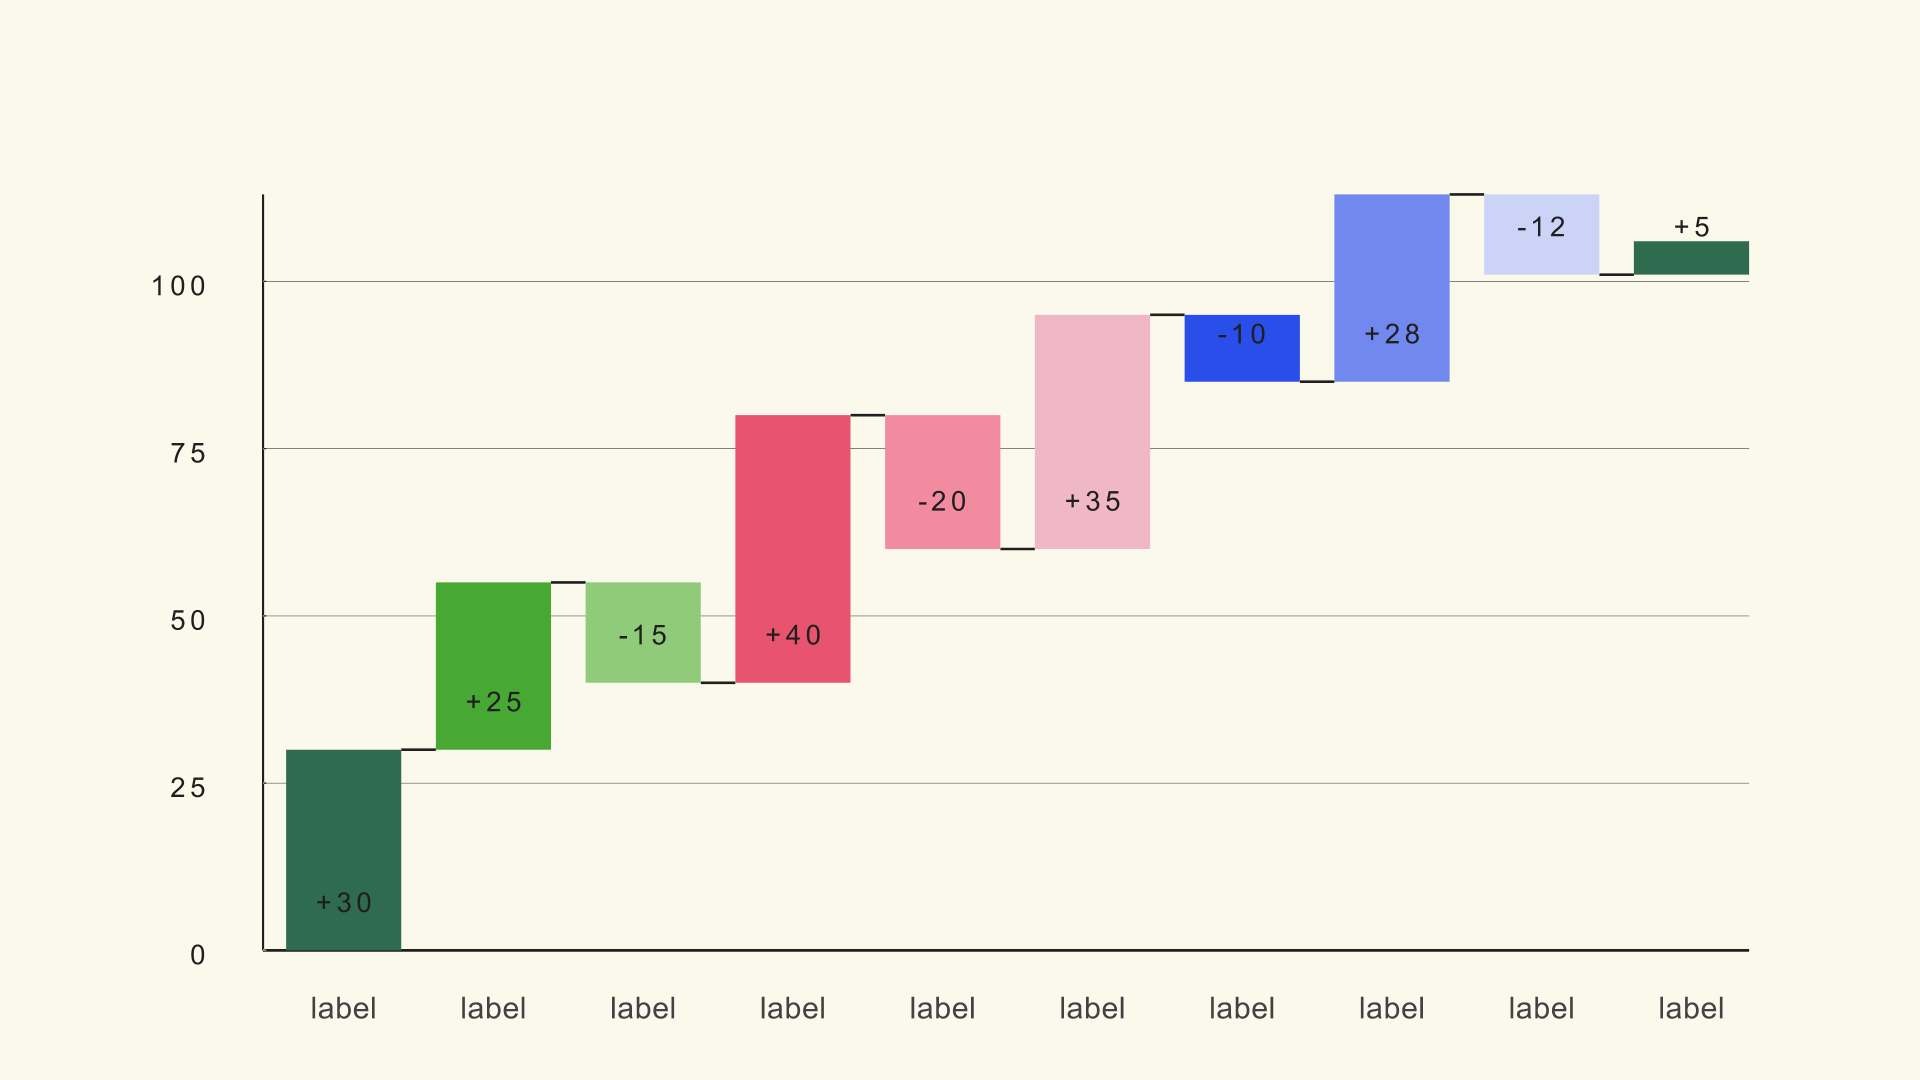
Use a candlestick chart when the open, close and range are all part of the story. Use a line graph when a single closing-price trend is enough. Use a bar chart for a straightforward comparison that has nothing to do with market movement.
Common mistakes
- Wrong column order. The wick or body will not match the data.
- High/low values inside the body. The wick disappears or looks broken.
- A zero-based Y axis. The price action flattens into a thin band.
- Too many candles. The individual shapes become unreadable.
- Neon colors on a dark background. The chart vibrates after compression.
Next steps
Load the OHLC sample and rebuild the chart once with Fit to Data on. Then read the Candle Wick guide and compare it with Candle Body.